Chainlink’s (LINK) price is currently stuck in a bearish continuation pattern that could result in a considerable decline.
Investors are not particularly optimistic either, which could result in LINK failing any potential recovery.
Chainlink Investors Could Sell
Chainlink’s price is falling lower daily due to broader market conditions. Such bearish market conditions are sometimes flipped into bullish ones by the activity of the investors. However, this is not the case with LINK.
Active addresses, i.e., addresses conducting transactions on the network, have hit a new low after declining for the past couple of days. In the last 24 hours, less than 3,500 investors have participated in Chainlink, the lowest figure since October 2023.
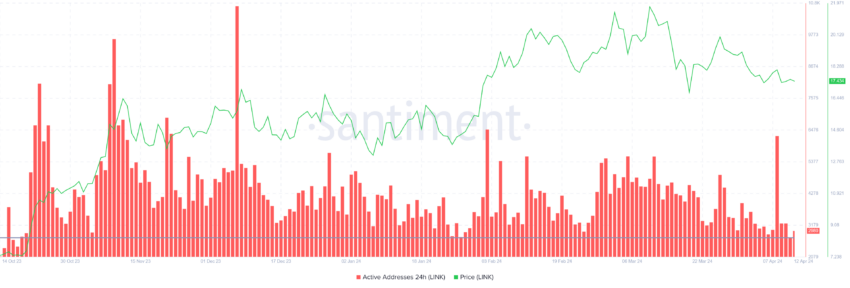
This shows that LINK holders are not particularly optimistic at the moment, extending their bearish behavior.
Read More: How to Buy Chainlink (LINK) With a Credit Card: A Step-By-Step Guide
Furthermore, daily price active addresses divergence, which flashes a sell signal at the time of writing. During instances when the price stays strong and participation declines, selling becomes highly probable.
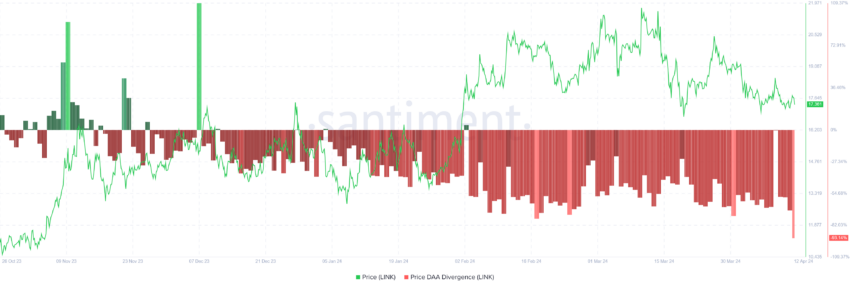
Additionally, this is the strongest sell signal noticed in the past year, which directly hints at the potential selling that is about to come.
LINK Price Prediction: Expect a Decline
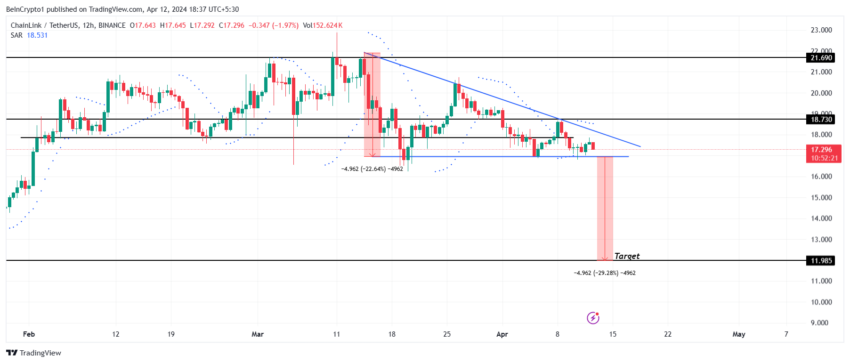
Chainlink’s current price is set to see a considerable drawdown owing to the descending triangle pattern it is stuck in. A descending triangle is a bearish chart pattern characterized by a horizontal support line and descending trendline, indicating potential further downside as selling pressure increases within a narrowing price range.
Based on this pattern, the downside target for Chainlink’s price is $11.98, which would mark an almost 30% correction for the investors.
Read More: How To Buy Chainlink (LINK) and Everything You Need To Know
However, halving induces bullishness in the market, and LINK follows the cue, so it could break out of the pattern. This would rally towards $18.73 and beyond, invalidating the bearish cues.


