
Aptos (APT) price has had a rough couple of days, bringing the altcoin down to a multi-week low.
APT is now attempting a recovery, which could be redemption for the bullish investors.
Aptos Sees Green
Aptos’ price trading at $12.43 bounces off the support line at $12.04. This is an opportunity for bullish investors as they have suffered considerably over the last few days.
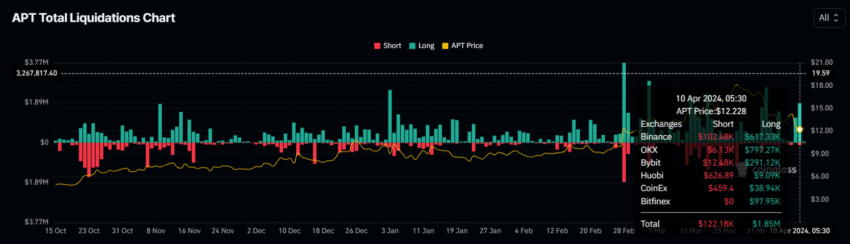
This is evident from the liquidation data, which shows that most contracts witnessing liquidation have been long. In the span of 24 hours, over $1.85 million worth of long contracts have been liquidated. This shows that traders that have been making bullish bets have been losing money owing to the decline.
This will potentially stop as the altcoin begins climbing on the charts.
Read More: How to Buy Aptos (APT) and Everything You Need to Know
Signs of this probability are visible on the price indicators Moving Average Convergence Divergence and Relative Strength Index (RSI). RSI gauges the magnitude and pace of price changes, offering insights into potential market overextension or undervaluation.
MACD, on the other hand, analyzes the convergence and divergence of two moving averages to indicate shifts in market momentum and potential trend reversals.

Both indicators are inching close to observing bullishness, with the RSI recovering from the oversold zone and MACD sitting at the cusp of marking a bullish crossover.
This would prove to be a boon for Aptos’ price.
APT Price Prediction: Beginning of a Rally?
Aptos’ price is closing in on breaching the barrier marked at $12.67 after bouncing off $12.04. This support coincides with the 23.6% Fibonacci Retracement of $18.82 to $9.95.
Should APT breach the $12.67 resistance, it would be on its way to reclaim the 50% Fib line marked at $14.39. A test of this resistance would result in a 15.66% rally for Aptos’ price.

Read More: Aptos Crypto (APT): A Guide to What it Is and How it Works
However, APT would be susceptible to a drawdown that could send it crashing through $12.04 if the breach fails. This would invalidate the bullish thesis and push Aptos’ price to $11.00.


