Polygon (MATIC) Price Gives Mixed Signals

Analysis4wks agoUpdate 6086cf...
63 0

In Brief

  • Crypto whales appear to be accumulating MATIC.
  • Daily active addresses have consistently decreased.
  • After dropping in March, supply on exchange stabilized.
  • promo

    var rnd = window.rnd || Math.floor(Math.random()*10e6);
    var pid588602 = window.pid588602 || rnd;
    var plc588602 = window.plc588602 || 0;
    var abkw = window.abkw || ”;
    var absrc = ‘https://servedbyadbutler.com/adserve/;ID=177750;size=0x0;setID=588602;type=js;sw=’+screen.width+’;sh=’+screen.height+’;spr=’+window.devicePixelRatio+’;kw=’+abkw+’;pid=’+pid588602+’;place=’+(plc588602++)+’;rnd=’+rnd+’;click=CLICK_MACRO_PLACEHOLDER’;
    document.write(”+’ipt>’);

Polygon (MATIC) shows signs of a complex pattern. This is highlighted by an increase in whale activity alongside a decrease in daily active addresses.

This confluence of on-chain metrics points to mixed sentiment within the market.

Polygon’s Mixed Signals

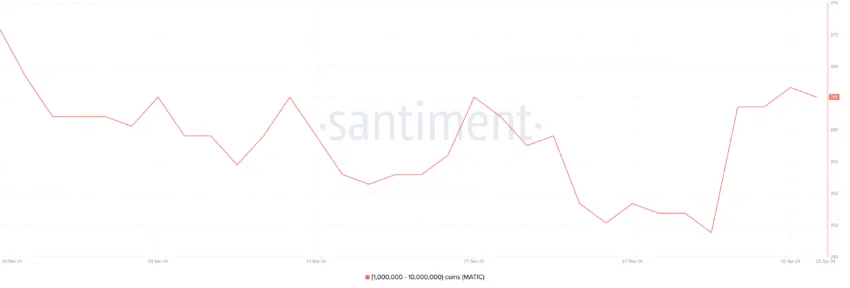
Initially, there was a decline in the number of addresses holding substantial amounts of MATIC, dropping from 273 to 252 by March 30. However, this trend reversed in the following days, with the count increasing to 266 by April 3.

This behavior indicates that whales are potentially “buying the dip,” a strategy that suggests optimism for MATIC’s price increase.

Polygon (MATIC) Price Gives Mixed Signals
MATIC Whales Holdings. Source: Santiment

Contrastingly, the daily active addresses have shown a consistent decline. These went from 2,959 by March 31 to 2,216 by April 3, which traditionally suggests reduced market interest.

Polygon (MATIC) Price Gives Mixed Signals
MATIC Daily Active Addresses. Source: Santiment

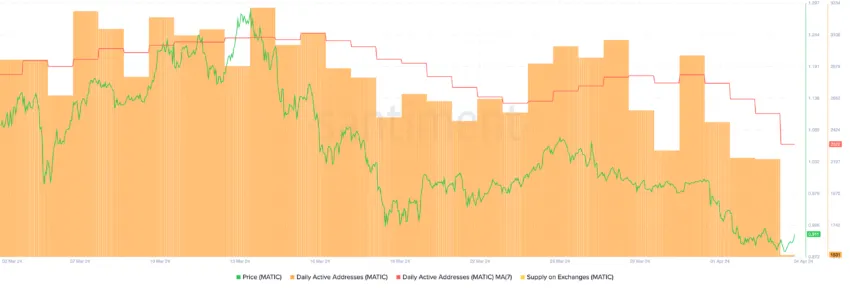
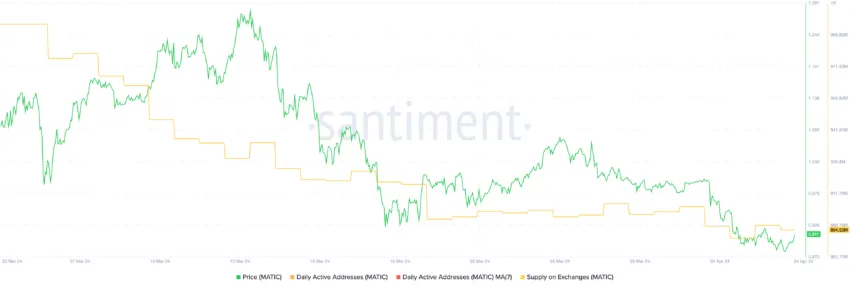
At the same time, the supply of MATIC on exchanges, after decreasing through March, has found a level of stability.

This equilibrium suggests that the selling pressure has eased, and a consolidation phase might be setting in, potentially laying the groundwork for future price movements.

Polygon (MATIC) Price Gives Mixed Signals
MATIC Supply on Exchanges. Source: Santiment

MATIC Price Prediction

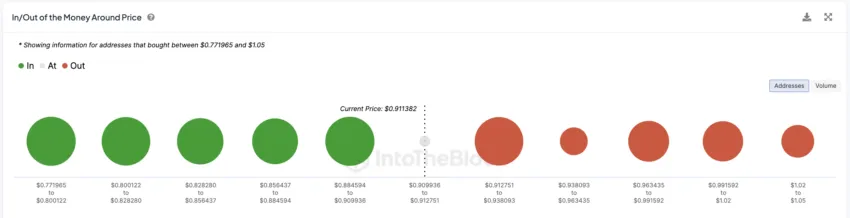
The In/Out of the Money Around Price (IOMAP) analysis shows significant resistance ahead for MATIC, with notable levels up to $0.99 and between $0.80 and $0.88.

These insights, alongside the observed market dynamics, paint a picture of potential consolidation, where the price might stabilize before making a decisive move.

Read more: Polygon (MATIC) Price Prediction 2024/2025/2030

Polygon (MATIC) Price Gives Mixed Signals
MATIC IOMAP Chart. Source: IntoTheBlock

Given these factors, MATIC’s future price direction hinges on market sentiment and the ability to overcome resistance levels.

A bearish trend might see MATIC retreat to lower support levels, possibly around $0.68. On the flip side, overcoming the resistance could propel MATIC toward $1.30, a level not reached since April 2022.

Top crypto platforms | April 2024

This article is sourced from the internet: Polygon (MATIC) Price Gives Mixed Signals

Related: Will Bitcoin (BTC) Reach $60,000? Analysts Weigh in on the Trend

In Brief Bitcoin’s (BTC) price moved above $53,000 on February 20, the highest price since November 2021. While the daily time frame readings are undetermined, the six-hour chart support the upward trend. Despite the bullish BTC price prediction, a breakdown from the channel can cause a significant drop. The Bitcoin (BTC) price reached a high of $53,015 on February 20 but has corrected since. Bitcoin trades in the upper portion of a short-term corrective pattern. Can it break out, or has the price reached a local top? Bitcoin Shows Weakness The technical analysis of the daily time frame shows the BTC price has moved upwards since January 23. In 28 days, it increased by 40%, leading to a high of $53,015 on February 20. This was the highest Bitcoin price since…

© Copyright Notice

Related articles

No comments

You must be logged in to leave a comment!
Login immediately
No comments...