
The Render (RNDR) price is in focus as its supply on exchanges has consistently decreased, signaling accumulation by investors. This is coupled with an increase in the mean coin age, indicating a stronger confidence in holding RNDR.
Moreover, EMA lines are aligning to offer strong support close to their current value, hinting at the potential for a bullish trend to develop shortly. Together, these factors suggest a positive shift in the market sentiment towards RNDR.
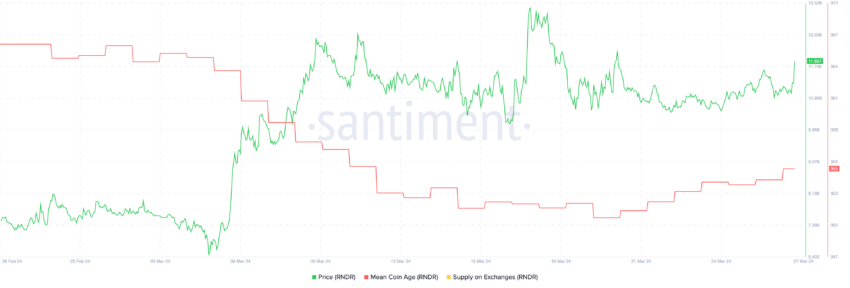
Render Mean Coin Age Is Increasing Again
The Mean Coin Age (MCA) of RNDR has significantly increased in the last week. MCA is a metric that measures the average amount of time that all the coins in a particular network have been held or remained unspent.
This metric is calculated by dividing the total coin days (the sum of the holding periods of all coins, where one coin held for one day equals one coin day) by the total supply of coins in circulation.
A rising Mean Coin Age indicates a trend of accumulation or holding, as it shows that coins, on average, are being held for longer periods before being moved or sold. Conversely, a declining Mean Coin Age suggests increased movement or trading activity, indicating that coins are being held for shorter periods.
For RNDR, we had a period of consistently declining MCA between March 4 and March 20. Then, between March 20 and March 26, MCA started to rise again. This suggests that investors are leaning towards holding onto their assets rather than trading them, possibly anticipating future gains.
Read More: Top 9 Web3 Projects That Are Revolutionizing the Industry
Supply on Exchanges Brings Insights
From February 26 to March 22, RNDR supply on exchanges grew heavily, showing the strong appetite of traders. Then, that supply started to decrease from March 22 to March 27.
A growing supply of RNDR on exchanges can imply that more holders are transferring their tokens to exchanges, possibly preparing to sell. This could lead to increased selling pressure on the RNDR token, potentially causing its price to drop if the demand doesn’t match the growing supply.
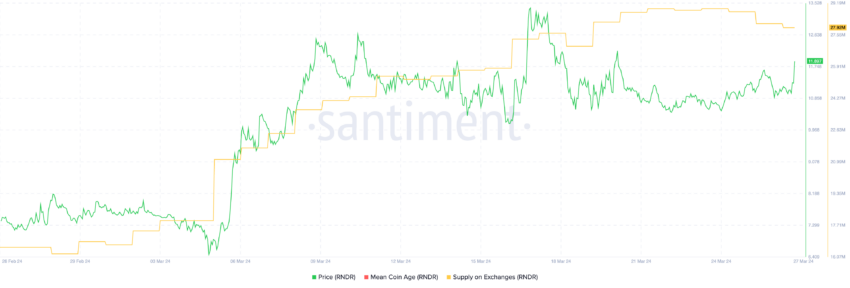
However, a declining supply of RNDR on exchanges, as it’s happening right now, is typically interpreted as a bullish signal. This trend suggests that holders are withdrawing their tokens from exchanges to hold them in private wallets, indicating a strategy of long-term holding or accumulation.
That also means that there are fewer tokens available for sale, which can reduce selling pressure. If demand remains constant or increases, the reduced supply can lead to a price increase.
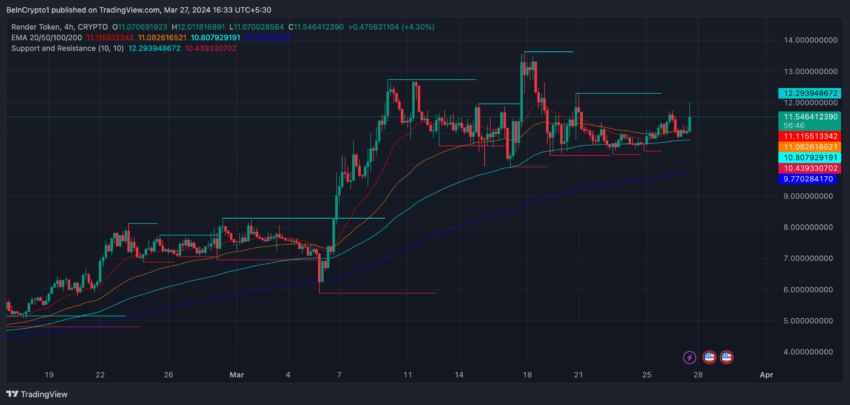
RNDR Price Prediction: Will EMA Lines Form The Bullish Trend?
The Exponential Moving Average (EMA) on the 4-hour price chart suggests a converging trend as it closely tracks the current price, signaling a period of market equilibrium. A bullish scenario may unfold if the shorter-term EMA breaks away from its longer-term counterparts and ascends. This could signal the start of a new bull run for RNDR.
This is because a short-term EMA rising above longer-term EMAs can often be a precursor to increasing buying pressure. EMAs prioritize recent price data, smooth out price fluctuations, and aid traders in clearly identifying trends.
EMAs are technical indicators used to analyze market trends over a specific period. Unlike simple moving averages, EMAs give more weight to recent price data, making them more responsive to new information. To achieve this, the calculation applies a multiplier to the most recent data points. Traders commonly use EMAs to smooth out short-term fluctuations and to highlight longer-term trends or cycles.
Read More: Top 10 Aspiring Crypto Coins for 2024
The tight alignment of the EMAs around the current price indicates a balanced tug-of-war between buyers and sellers, with the potential for a sharp move once one side overwhelms the other. If an uptrend starts, RNDR could break its previous ATH of $13.46 soon. However, if the support at $10.30 is not enough, it could continue falling until the $5.90 zone.


