The Tron (TRX) price took a downturn towards the end of February, just as most of the crypto market began trending upwards, with many even marking new all-time highs.
This bearishness will likely continue going forward as trend indicators signal a drawdown for the altcoin.
Tron Price Downtrend Begins
Tron price was noting a potential rise over the past week, which failed to trigger a recovery for the asset. The ongoing decline has considerably impacted the overall growth of the crypto asset and the network.
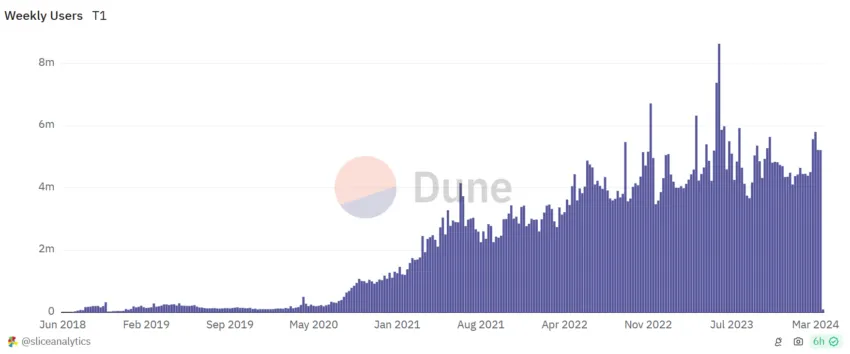
The project is losing traction among users, which can be observed by the fall in the number of users on the network. Weekly average users have taken a hit in the past two weeks, falling by 10% from 5.79 million to 5.25 million.

Additionally, a chunk of the TRX supply is awaiting a profit trigger, which, by its looks, will not take place anytime soon. About 1.36 billion TRX bought within the $0.1165 to $0.1205 range is hanging in uncertainty and might fall back into the loss-bearing territory.
Read More: How To Buy TRON (TRX) and Everything You Need To Know

This is because all signals point towards potential decline, which would turn the aforementioned price range into a resistance zone.
TRX Price Prediction: One Downtrend Ends, Another Begins
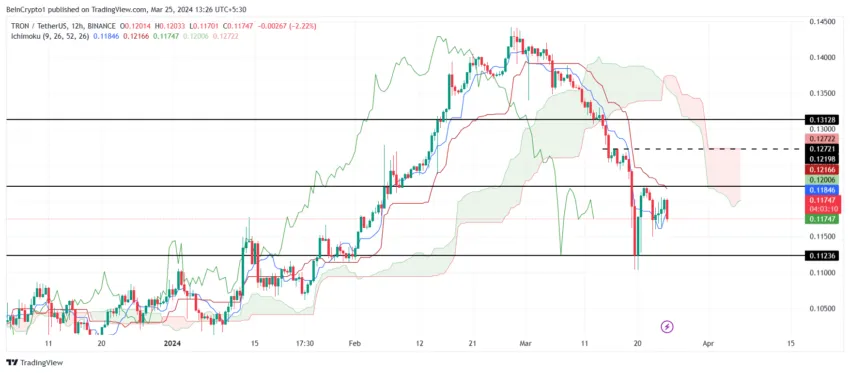
Tron’s price is trading at $0.1174 at the time of writing after failing to breach the barrier marked at $0.1219. The decline, while seemingly halted, is potentially set to continue going forward. This is because the crypto asset that has been trading below the Ichimoku Cloud is now noting a confirmed downtrend.
The Ichimoku Cloud is a technical analysis tool that indicates support, resistance, trend direction, and momentum. Generally, when the price is below the cloud, bearish outcomes are possible; however, as the cloud turns bearish, the asset is expected to trade further lower.
Such is the case with Tron price as well since the Ichimoku Cloud turned red over the last 48 hours. This is a signal confirming a downtrend for TRX, making this the first such instance in seven months since August 2023.

Thus, Tron’s price could note a further decline, potentially sending it to test the support level of $0.1123.
Read More: 7 Best Tron Wallets for Storing TRX Tokens
On the other hand, Ichimoku Cloud is known to be a leading indicator, and given the recent attempt at recovery, TRX might stabilize for a while. If so, Tron’s price could observe consolidation and continue moving sideways, potentially breaching $0.1219, invalidating the bearish thesis.


