Bitcoin has once again fallen below $60,000; after 20 months, all we got was a new low
Author: jk
Bitcoin once again breached the critical psychological support level of $60,000 during today’s trading session, dropping to a low of $59,023, marking its lowest point since October 2024, a near 20-month low. As of press time, BTC has slightly recovered from its lows, trading around $60,600, narrowing its 24-hour decline to approximately 3%, with a cumulative drop of about 9% over the past seven days.
This dip marks the third time Bitcoin has fallen below the $60,000 threshold this year. Unlike the previous two instances, this decline occurs against a backdrop of sustained institutional capital outflows and a sharp shift in macroeconomic policy expectations, systematically undermining market confidence.
What are the reasons?
Reason 1: Spot ETFs Face Longest Net Outflow Streak on Record
U.S. Bitcoin spot ETFs are the primary driver behind this decline. Since mid-May, ETFs have recorded net outflows for six consecutive weeks, with cumulative outflows of approximately $5.94 billion over the past 30 days—the largest wave of institutional capital withdrawal since their launch in January 2024.
Among them, BlackRock’s IBIT saw a single-day net outflow of $528 million on May 28, setting a record for the highest single-day outflow since inception. The total asset under management of Bitcoin ETFs has fallen from roughly $113 billion at the start of the year to approximately $77.5 billion, evaporating over one-third of its value. Notably, according to The Block data, ETFs still recorded a net outflow of approximately $113.8 million on June 23, indicating that the institutional withdrawal momentum has not yet shown a substantial reversal. Whether institutional selling pressure will ease going forward will be a key observation point for the market.
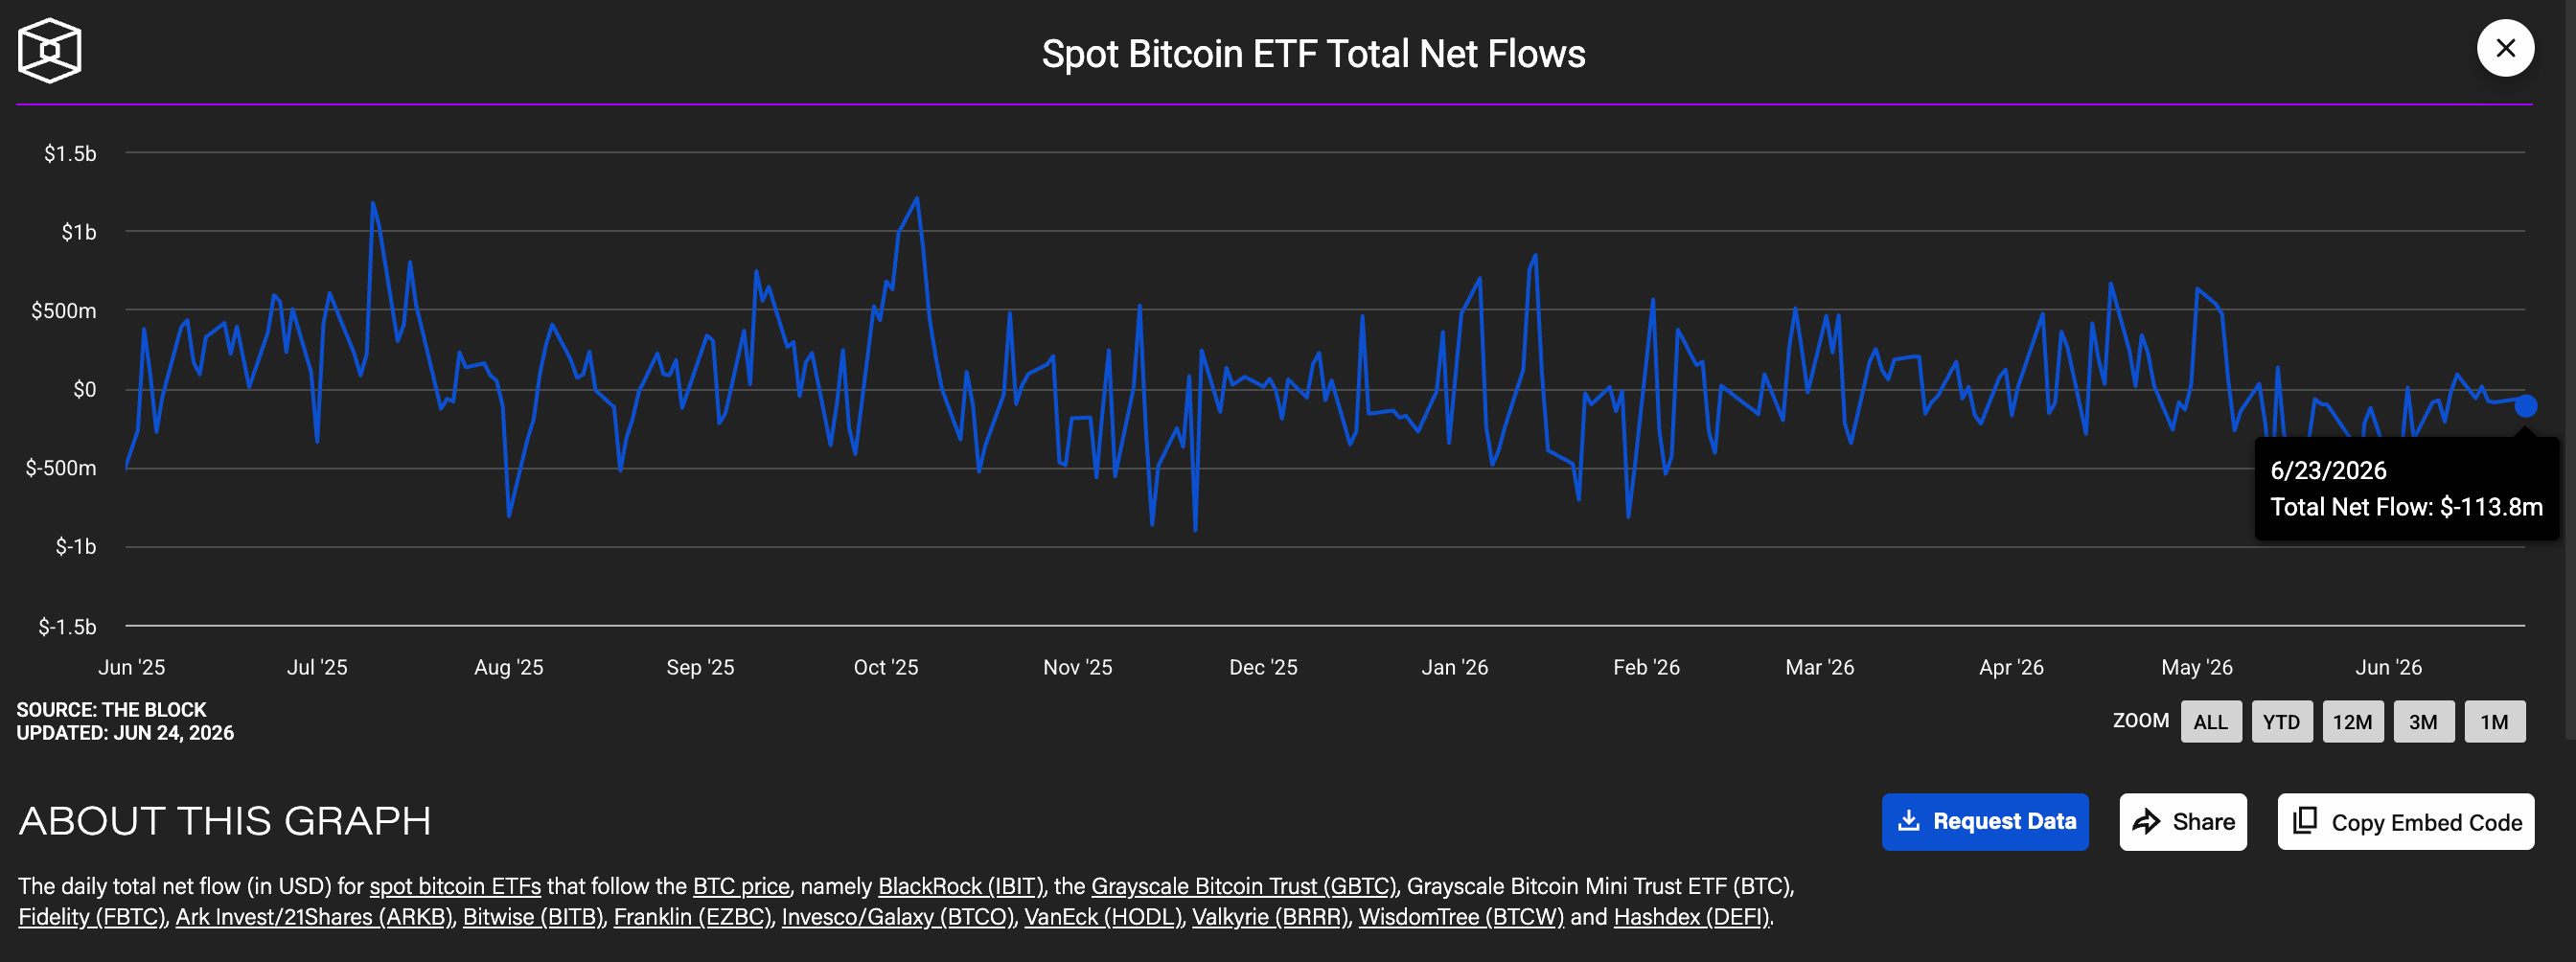
ETF Net Outflows, Source: The Block
The problem lies in the ETF cycle: when institutions redeem shares, authorized participants must sell corresponding Bitcoin directly on the secondary market, creating persistent spot selling pressure. CoinShares characterizes the current situation as an “emotional shock,” arguing it is not a structural breakdown in the fundamental crypto market.
Reason 2: Renewed Rate Hike Expectations Intensify Macroeconomic Pressure
On the macro front, Bitcoin faces undeniable headwinds. The number of U.S. job openings in April rose to 7.62 million, far exceeding market expectations and hitting its highest level in nearly two years, directly pushing the 10-year Treasury yield back above 4.45%.
Cleveland Fed President Beth Hammack subsequently stated publicly that if inflation remains persistently high, the Fed may need to resume rate hikes. Data from CME FedWatch shows that the market’s probability of a rate hike before year-end has risen to over 50%.
Conversely, the strong bull market of 2025 was built on the liquidity expectation of a “Fed rate cut.” Once rate cut expectations reverse and real interest rates rise, institutional funds tend to shift towards low-risk assets like bonds and cash, making Bitcoin, as a high-risk asset, the first to be affected.
What Are Different Analysts Saying?
- 21Shares: In its latest “State of Crypto Market” report, 21Shares notes that the current decline closely mirrors historical post-halving correction cycles. Although the firm had initially expected the four-year Bitcoin cycle to end, the current price action suggests the cycle remains intact. The firm maintains its forecast for prices to recover to $100,000 by year-end, arguing that the massive base of approximately $53 billion in cumulative ETF net inflows will form an effective bottom support.
- Arthur Hayes: Holds a more bearish outlook, predicting Bitcoin will bottom out at $40,000 over the next six months. His core logic is that the Fed’s hawkish stance will continue to suppress market liquidity. Hayes stated that while he maintains a long position, he has hedged downside risk through options.
- CryptoQuant: Citing on-chain data, CryptoQuant points out that the current average investor cost basis is approximately $53,000. Historically, bear market bottoms typically occur after the price falls below the “realized price.” The firm believes this bear market could extend until the end of 2026 or even early 2027, with no clear signs of sustained demand recovery yet.
In the short term, market focus will center on the upcoming U.S. inflation data and the Fed’s next policy signals. A CPI reading below expectations could offer Bitcoin a window for relief. Conversely, if it confirms inflation stickiness, further downside pressure will accumulate. Until extreme panic subsides and ETF flow direction provides a clear inflection point, whether Bitcoin can hold the critical defense line of $60,000 may determine the next direction of this bear market.
This article is sourced from the internet: Bitcoin has once again fallen below $60,000; after 20 months, all we got was a new low
Original Translation: Saoirse, Foresight News In my opinion, there’s only one way to make big money from tokenized stocks. Of course, you could buy these tokens hoping for a 10x spike, but aside from rare exceptions like Micron Technology (MU), the odds of such a windfall are minuscule. For starters, only 2,290 stocks have been tokenized, and only about 130 have a market cap exceeding $1 million. The vast majority of tokenized stocks have virtually no liquidity on-chain. According to RWA data site rwa.xyz, Strategy is among the largest of these assets, with a total value of $129 million. Currently, most tokenized stocks are established publicly traded companies. If you’re looking to uncover undervalued, overlooked stocks, traditional brokers like Interactive Brokers offer more opportunities. Secondly, holding tokenized stocks introduces risks…