Despite recent corrections in the Ethereum (ETH) price, Ethereum’s Daily Active Addresses continue to rise, suggesting sustained interest and engagement within the network. This contradiction between price movement and network activity raises questions about the immediate future of ETH price.
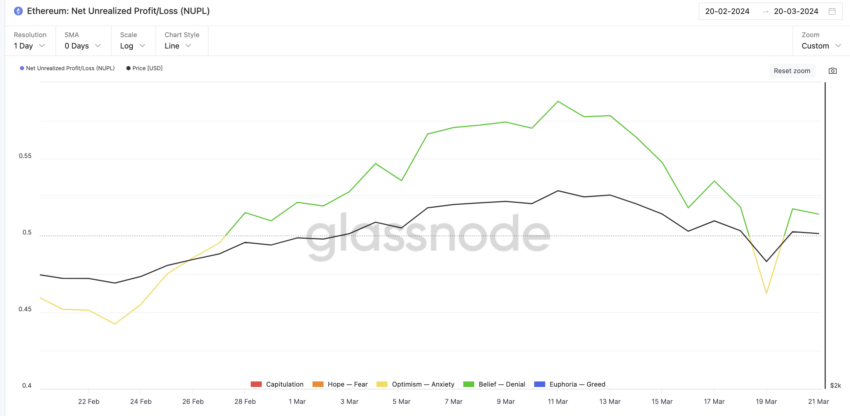
The move of ETH into the ‘Belief — Denial’ zone, as indicated by NUPL data, combined with EMA lines suggesting a potential phase of consolidation or further correction, poses a pivotal question: Will ETH price stabilize in a consolidation phase, or are we on the cusp of additional corrections?
Despite Recent Corrections, Daily Active Addresses Are Still On The Rise
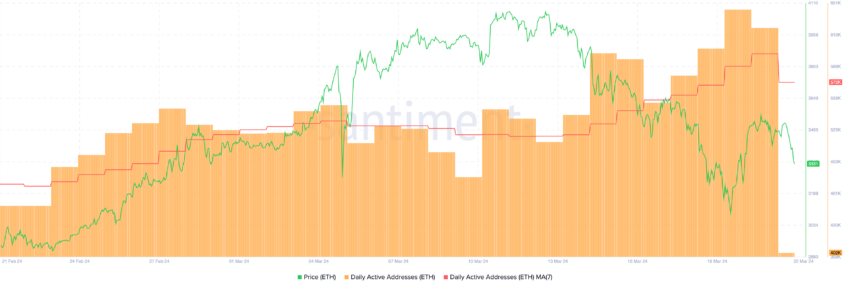
From February 22 to March 11, the price of ETH witnessed a significant surge of 36.52%, with its daily active addresses simultaneously increasing from 449,000 to 545,000, highlighting a period of robust growth and engagement within the Ethereum network. However, the trend took a turn recently, as ETH’s price underwent a correction, declining from approximately $4,000 on March 13 to $3,400 by March 21.

Traditionally, there has been a noticeable correlation between the number of active addresses on the Ethereum network and the price of ETH, suggesting that active network participation often mirrors price movements. Yet, this past week has seen a divergence from this pattern.
Despite the price correction, Ethereum daily active addresses continued to climb, rising from 540,000 to 626,000 between March 14 and March 21.
This divergence might imply that the Ethereum network’s increasing user activity and sustained engagement could potentially buffer against steep price corrections. Instead of witnessing strong downturns, the bolstering number of daily active addresses and ongoing network activity might provide enough support to stabilize the ETH price, hinting at a more consolidated market stance in the face of corrections.
Read More: Ethereum (ETH) Price Prediction 2024/2025/2030
Ethereum NUPL Metric Fluctuates
The ETH Net Unrealized Profit/Loss (NUPL) metric has been oscillating between the ‘Optimism – Anxiety’ and ‘Belief — Denial’ states, suggesting that a significant portion of ETH investors perceive their holdings in a positive light.
This perception shows a growing confidence and an optimistic outlook towards Ethereum’s value and its future potential. The NUPL metric, by measuring the overall unrealized gains versus losses across Ethereum wallet addresses, provides a comprehensive view of the network’s overall financial health and investor sentiment.

This wavering between optimism and belief hints at the community’s anticipation as they closely monitor price movements to strategize their next moves, potentially stabilizing prices through cautious trading behavior. Should the NUPL consistently trend towards ‘Optimism – Anxiety,’ it might indicate the conclusion of recent market corrections, signaling a period of recovery and stability for ETH prices as investor sentiment solidifies in anticipation of Ethereum’s upward trajectory.
ETH Price Prediction: $3,000 Next?
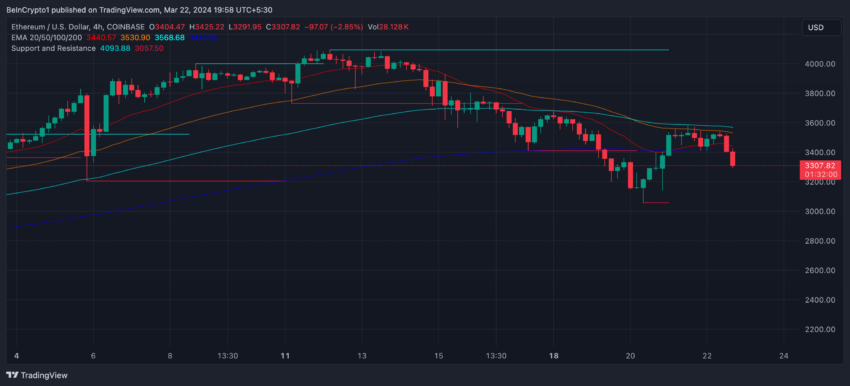
The ETH price chart has revealed a significant movement: its short-term Exponential Moving Averages (EMAs) have recently dipped below the longer-term EMAs, with all converging near the current price level. This pattern typically suggests a moment of decision for the asset’s future price direction.
When short-term EMAs cross below their longer-term counterparts, it often indicates a shift toward bearish sentiment, signaling that recent prices are lower than they have been on average, which could foretell a downward trend.

EMAs are designed to provide a more responsive measure of an asset’s trend by emphasizing recent price data over older prices. This sensitivity to new market data makes EMAs particularly useful for traders looking to gauge short-term market momentum and identify potential trend reversals.
Unlike simple moving averages, EMAs adjust more quickly to price changes, offering a nuanced view of market dynamics and helping investors make informed decisions based on the latest trends.
Read More: What Is Wrapped Ethereum (WETH)?
If this bearish trend happens, as suggested by the EMA lines, the ETH price could soon find itself testing the $3,000 mark, a critical support zone.
However, ETH is also highly responsive to news and developments within the ecosystem. For instance, positive news, such as developments on the approval of an Ethereum ETF, could swiftly alter investor sentiment and push prices back towards $4,000 or even higher.


