 .10?" alt="Is Dogecoin (DOGE) Price Headed Back to $0.10?" width="850" height="478" />
The growth in DOGE holders ceased after a February surge. The Relative Strength Index (RSI) has fallen since last week but remains overbought, suggesting potential selling pressure ahead. Additionally, forming a death cross by the Exponential Moving Average (EMA) lines sends a bearish signal for the DOGE price.
This technical analysis points to a shift in market sentiment as the short-term momentum weakens relative to the long-term, raising concerns among investors about the future price direction of DOGE. Such patterns are closely watched as indicators of market trends and potential shifts in investor behavior.
Dogecoin March Momentum Slows After January-February Holders Surge
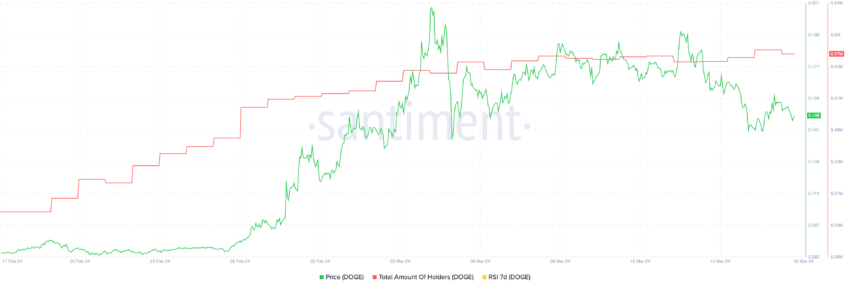
Between January 30 and February 10, DOGE experienced a significant increase in its holder base. It added 500,000 new holders to reach an impressive total of 6.3 million. Shortly thereafter, over a two-week span, its market value experienced a remarkable surge, climbing from $0.084 on February 26 to $0.18 by March 4. This represented a substantial growth of 114% in merely six days.
 .10?" />
Throughout February, DOGE holders continued upward, escalating from 6.34 million on February 10 to 6.51 million by the end of the month. Despite this growth, there’s an emerging trend indicating that enthusiasm for DOGE might be waning. From March 9 through March 18, DOGE holders fluctuated narrowly between 6.56 million and 6.57 million, showcasing a period of stagnation.
This pattern holds particular significance for DOGE, as significant increases in its holder count consistently heralded its previous price rallies. The current stagnation in the number of holders could suggest that the DOGE price might either stabilize or be corrected soon.
DOGE RSI Is Declining, But It’s Still Overbought
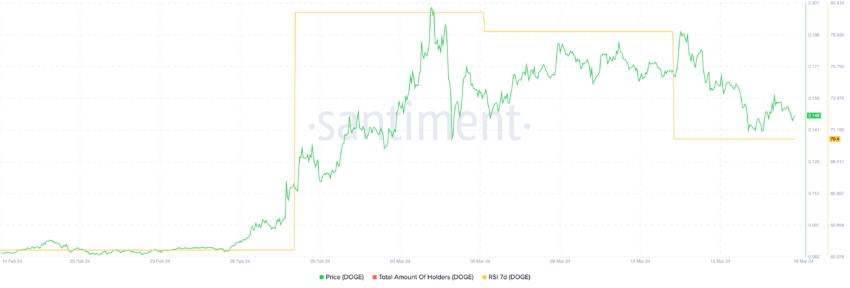
In the last two weeks, the 7-day Relative Strength Index (RSI) for DOGE has significantly shifted from a high of 81 to 70. This adjustment took place against the backdrop of a period marked by an uptick in price. Interestingly, RSI was above 80, but the price continued to grow despite that.
 .10?" />
The RSI serves as a tool to measure the speed and magnitude of directional price movements, operating within a range from 0 to 100. Readings surpassing the 70 mark indicate that an asset may be overbought. This can be followed by a price adjustment or a period of consolidation.
This modest retreat in DOGE RSI from such lofty heights suggests a gentle easing of its bullish momentum. Being close to the overbought territory often signals an imminent phase of price stabilization as the market endeavors to find a new balance. Or it may hint at an impending reversal in trend if the selling pressure starts to outweigh buying interest.
DOGE Price Prediction: Can It Fall Below $0.10?
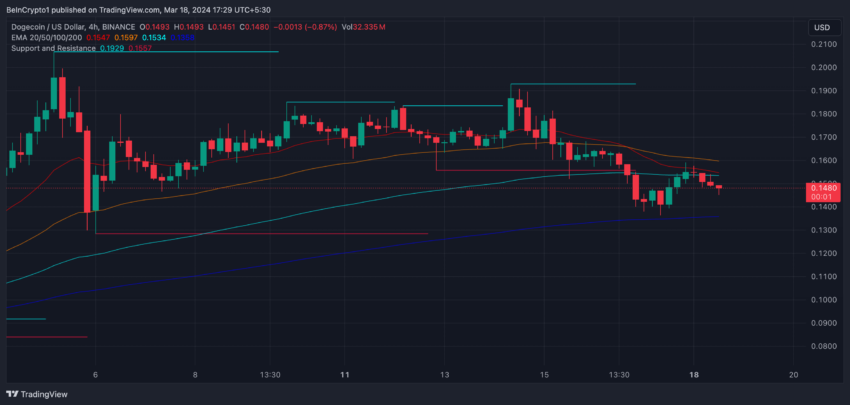
A recent examination of the 4-hour price chart for Dogecoin (DOGE) identified a death cross formation. This technical indicator, based on Exponential Moving Average (EMA) lines, suggests a potential downward trend for DOGE. A death cross forms when a shorter-term EMA intersects downward with a longer-term EMA.
 .10?" />
Unlike a Simple Moving Average (SMA) that equally weights all prices within a defined period, EMAs assign greater significance to more recent prices. This weighting is achieved through a mathematical formula incorporating a decay factor, emphasizing the latest data point more. Consequently, EMA lines react quicker to price fluctuations, offering a more responsive view of price trends than SMAs.
DOGE price currently shows strong support at $0.13. However, if that one is not strong enough, the DOGE price could be lowered to $0.084. That would mean a 42% correction related to the current price.
On the other hand, DOGE is highly influenced by BTC. If BTC rises again, DOGE could revert to the current downtrend and rise to $0.18 or $0.19 very soon.


