
Ethereum (ETH) has recently demonstrated formidable strength, with its price steadily increasing. Recent on-chain insights paint a promising picture, suggesting a bullish trend that could see ETH price breaking a new all-time high.
However, other metrics show that a correction could happen before that if the support zone is not strong enough. Will ETH continue its uptrend, or is a correction imminent?
Ethereum Relative Strength Index Is Rising Fast
Over the past month, the RSI (Relative Strength Index) for Ethereum has seen a notable increase from 73 to 82. This rise in the RSI is a sign that Ethereum has been experiencing strong buying pressure. Traditionally, an RSI value above 70 indicates that an asset may be getting overbought, which can be a precursor to a potential pullback as the market seeks to correct and find equilibrium. However, a mere high RSI isn’t always a reliable harbinger of a downturn.
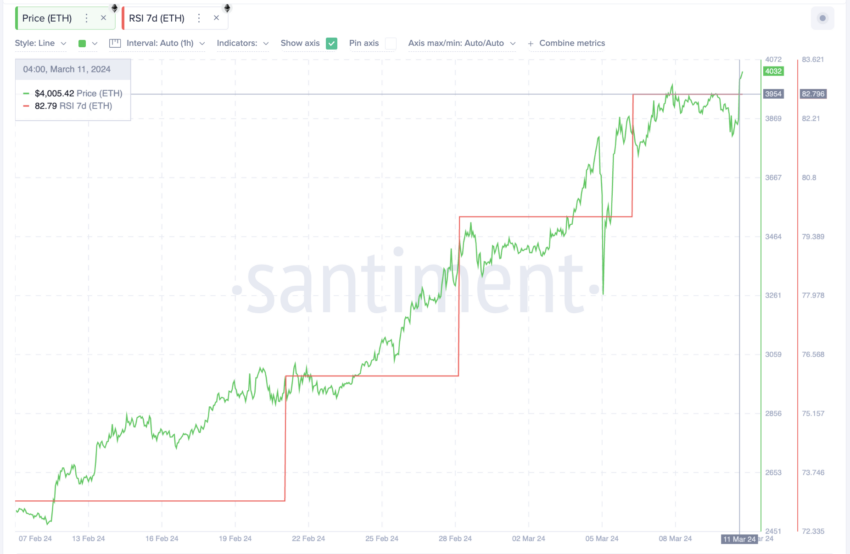
RSI is a momentum oscillator that measures the speed and change of price movements. The RSI oscillates between zero and 100 and is typically used to identify overbought or oversold conditions in a trading asset.
High RSI merits caution but isn’t always a predictor of price drops. Historically, ETH prices have risen despite high RSIs, defying expected market corrections.
NUPL Indicator Climbs Rapidly in One Week
Between February 27 and February 28, the ETH Net Unrealized Profit/Loss (NUPL) indicator shifted from the ‘Optimism – Anxiety’ stage to the ‘Belief – Denial’ level. This shift suggests that most ETH holders are now in profit. It usually signals a bull market gaining momentum as investors maintain solid trust in their assets without overzealous behavior.
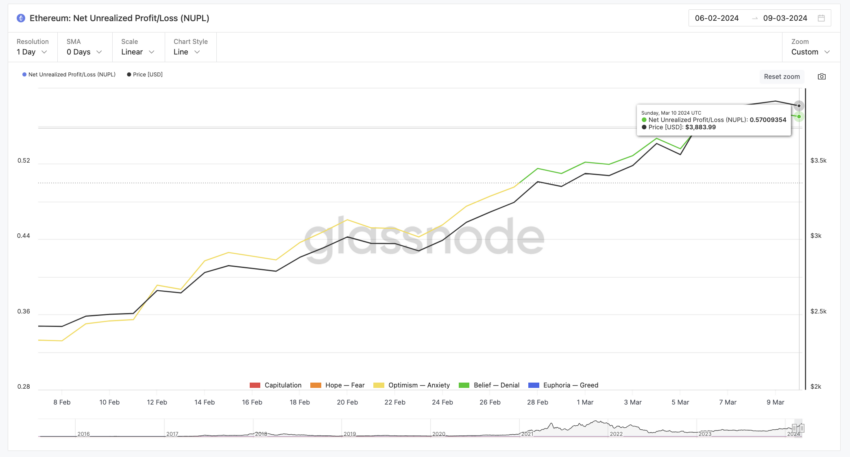
The NUPL is a measure that calculates the difference between the unrealized gains and losses among all on-chain entities. It’s a gauge to assess if the network’s participants are predominantly in profit or loss at the moment. It reached the ‘Belief – Denial’ status, going from 0.51 on February 28 to 0.57 on March 10, it became pretty stable between March 6 and March 10.
The NUPL metric grew fast, meaning its status could soon change from ‘Belief – Denial’ to the ‘Euphoria – Greed’ category. This can imply an overly optimistic market, with most investors enjoying profits. Historically, this sentiment has been a precursor to a market peak, potentially leading to a correction as more investors are tempted to cash in on their gains.
ETH Price Prediction: Can it Reach $5,000?
ETH price is still 17% below its all-time high of $4,867.17, reached on November 10, 2021. Prices between $3,790 and $3,910 areas might act as support zones, where the price could potentially stabilize due to a concentration of holders seeing their positions remain profitable.
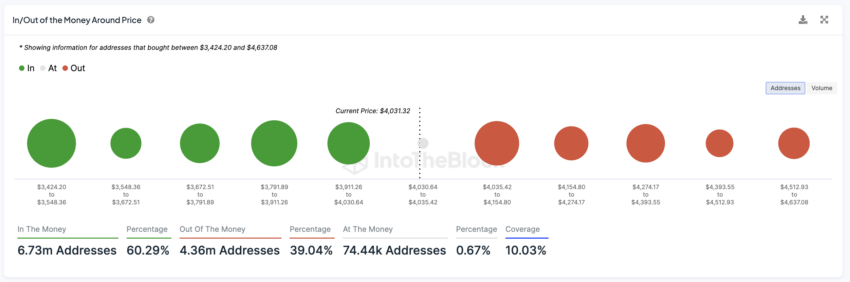
The In/Out of the Money Around Price (IOMAP) is a metric that represents where holders will likely profit or lose. It maps out the price points where investors purchased varying quantities of tokens and compares them to the current price.
The two highest resistance levels must be broken at $4,035 and $4,274 to achieve a new all-time high ETH price. If it can do this, this could trigger a strong rise to $4,900 and even $5,000, a new historical record.
The correlation between BTC and ETH prices can also trigger this. Since BTC has reached a new all-time high recently, this could also push ETH higher in price. Other movements could also positively impact ETH prices, such as approving an ETH ETF that is inevitably coming soon.


