Solana (SOL) has witnessed significant price movements, and market participants are eager to understand the potential trajectory of this asset.
This article delves into Solana’s current market performance, analyzing various metrics and chart indicators to provide a comprehensive outlook.
Market Resurgence: Solana’s Bullish Indicators
Solana’s price has risen to $128.60, a notable rebound considering its all-time high of $258.67 and cycle low of $8.28. This marks an incredible recovery of 1,486.15% from its low point.
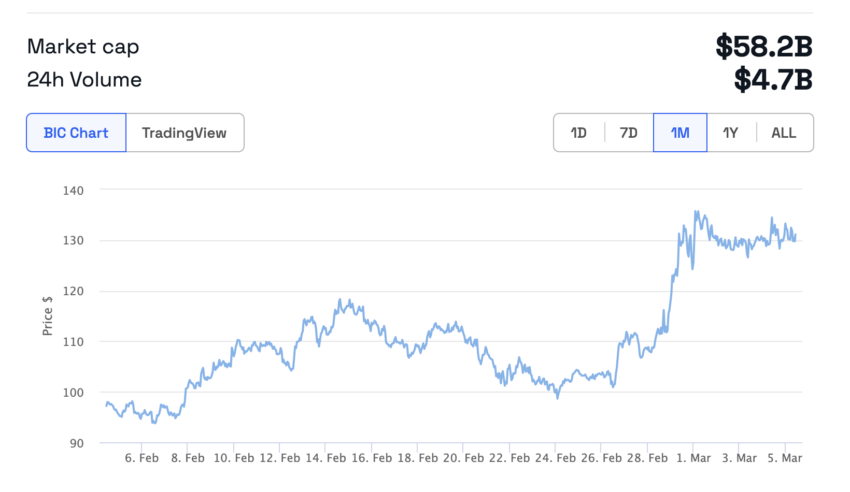
The trading volume above $1 Billion in the last 24 hours underscores the heightened investor interest and market liquidity that could fuel further price movements.
Is Solana Overbought or Oversold?
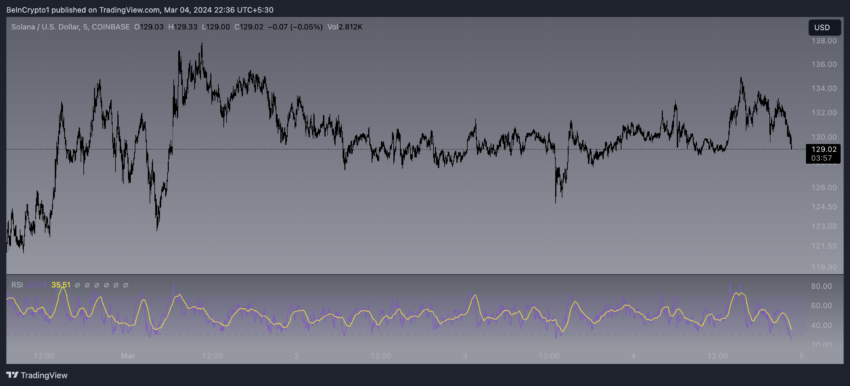
For Solana, a persistent Relative Strength Index (RSI) indicator near 35 without dipping into the oversold region can signal that the selling pressure is not strong enough to push it into an undervalued state, nor is buying pressure pushing it into overbought territory. This can mean Solana is at a potential tipping point, waiting for a catalyst to direct the next price move.
The RSI is a momentum oscillator that measures the speed and change of price movements. It oscillates between zero and 100, typically using a threshold of 70 to indicate an overbought condition and 30 to indicate an oversold condition. When the RSI is around 35, as with Solana, it suggests that the asset is slightly below the neutral zone.
This neutrality can imply a couple of scenarios:
- Consolidation: The market might be undecided, leading to a period where the price stabilizes as traders look for signals of the next significant move.
- Preparation for a Breakout: A neutral RSI could also precede a breakout if it follows a trend or if external market factors that might influence investor sentiment are at play.
Solana On-Chain Activity Is Still on the Rise
Solana Unique Transaction Signers have been growing exponentially in the last six months. The chart shows this trend has been true for the last 14 days.
As we can see, on February 20, that number was roughly 400,000 per day. On March 4, it reached almost 600,000.
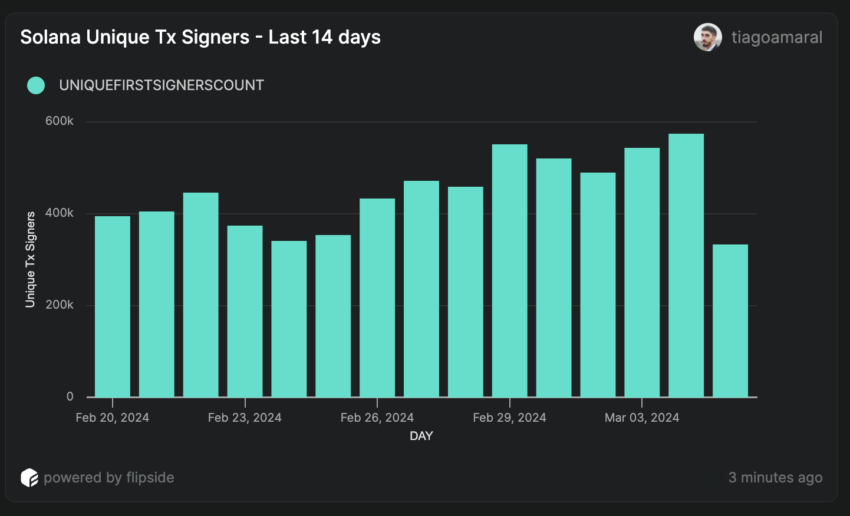
Although this is not a price metric, it shows that users are actively using Solana applications, which can impact the network’s activity and, consequently, its price.
The number of decentralized exchange (DEX) Trades in Solana shows a similar picture. It has been growing exponentially since September 2023 and rising in the last 14 days.
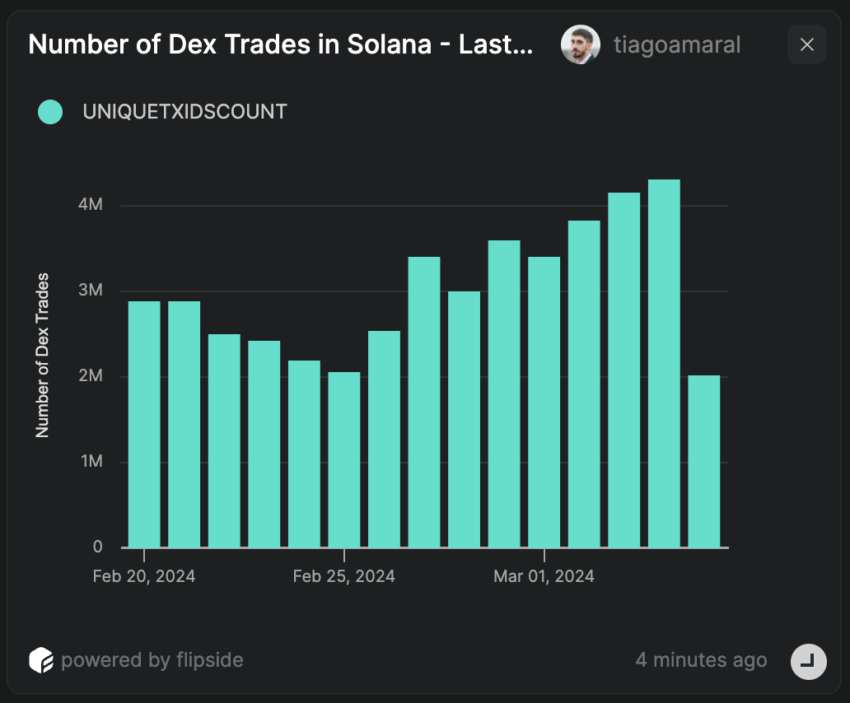
On February 20, the number of DEX Trades in Solana was 2.88 million. This metric grew to 4.31 million on March 4, a 66% increase in just 14 days.
This indicates that users are willing to spend more time using Solana dApps, and since the majority of tokens launched on Solana decentralized exchanges are traded using SOL, this can directly affect its price as more users speculate on Solana blockchain tokens.
SOL Price Prediction: New Yearly High or Correction Next?
A recent look at the 5-minute SOL/USD chart indicates a potential resistance level at $133. If the price breaks above this point, the bullish trend could continue.
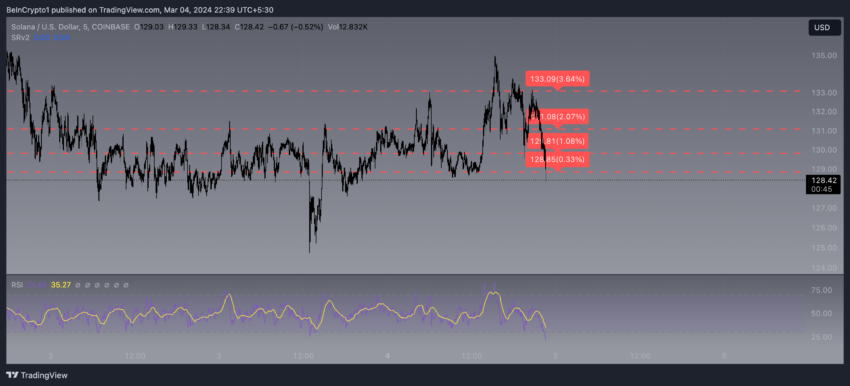
Conversely, a support level has formed around $128, where the price has shown resilience. This support level is a crucial threshold that could dictate the short-term price direction.
Solana is still 49.26% below its all-time high. This indicates that it has a lot of growing space in the upcoming months. However, strong resistance levels and crossing EMAs can indicate that a correction will occur before seeing a new yearly price high.