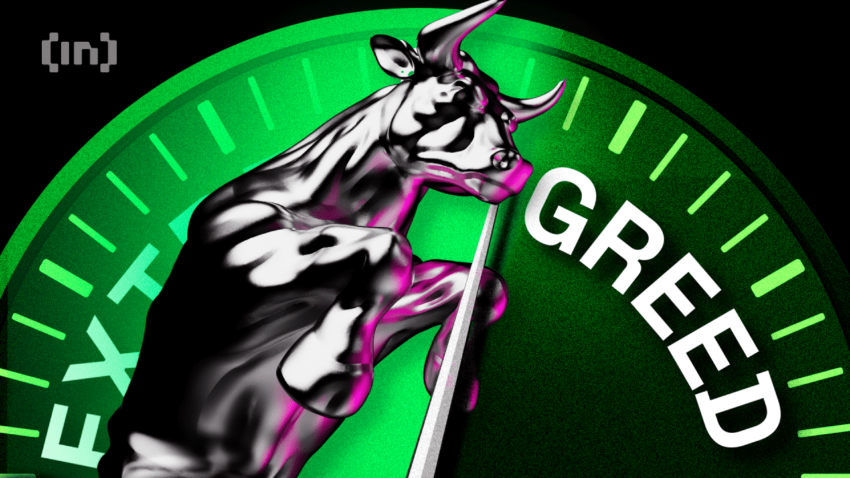
The famous Fear and Greed Index re-entered the territory of extreme greed above 75 today. Although such a state in the cryptocurrency market may last for weeks and months, the similarities with the 2019-2020 fractal suggest the possibility of a deeper correction.
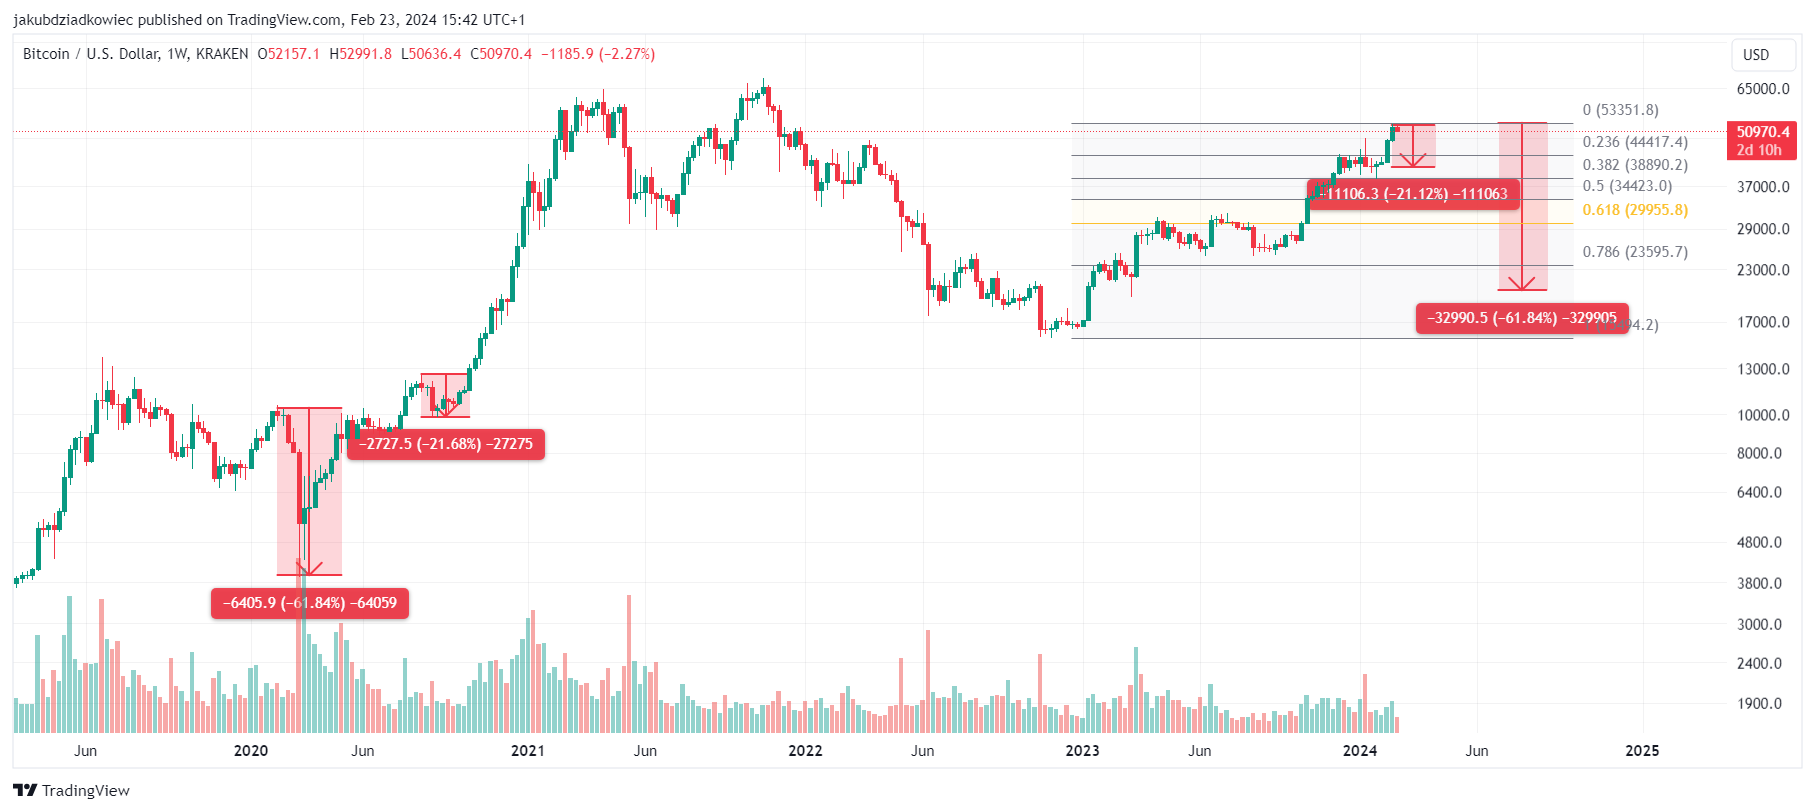
If Bitcoin experiences a sharp decline before halving, it could retest the $20,000 region. This would be consistent with the price action and events before the previous halving. There is also the possibility of a moderate correction (about 21%) after halving, which proved to be an ideal buying opportunity the previous time.
Fear and Greed Index Returns to Extreme Greed
Today’s readings from the Fear and Greed Index show 76. This is a value from the dark green area of extreme greed. Usually, such sentiment signals an impending correction, but it can last for a relatively long time in the cryptocurrency market.
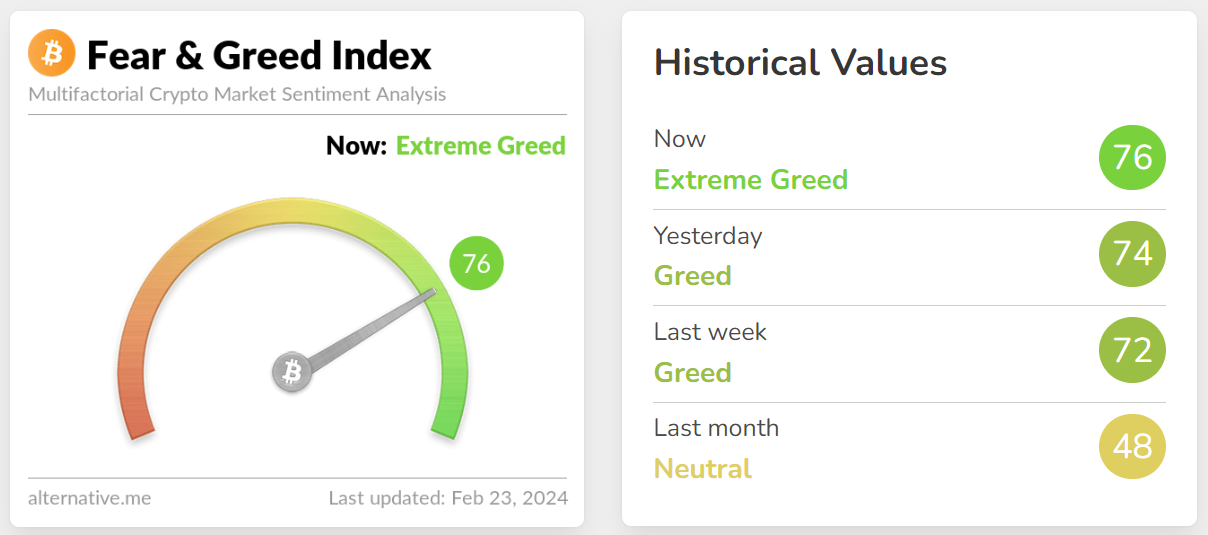
Interestingly, the average indication of the Fear and Greed Index for the previous month shows 48. This is a fairly neutral sentiment of market participants, which usually accompanies periods of consolidation and sideways trends.
Next, we should look at the movements on the Fear and Greed Index chart for the past 12 months and compare them with the corresponding period before the previous halving. This one occurred in May 2020 and was preceded by extremely volatile BTC price action. The culmination of this volatility was the 62% drop in Bitcoin price in March 2020. It was naturally triggered by the crash in the broad financial markets caused by COVID-19.
Despite this black swan, we see similarities in the two fractals (red areas). First, the increase in Fear and Greed Index readings was linked to the systematic BTC price surge, counting from the macro lows. 2020, this growth brought the index into greed territory (above 55). On the other hand, we are reaching a bit higher today, as several days have already resulted in readings above 75 in 2024.
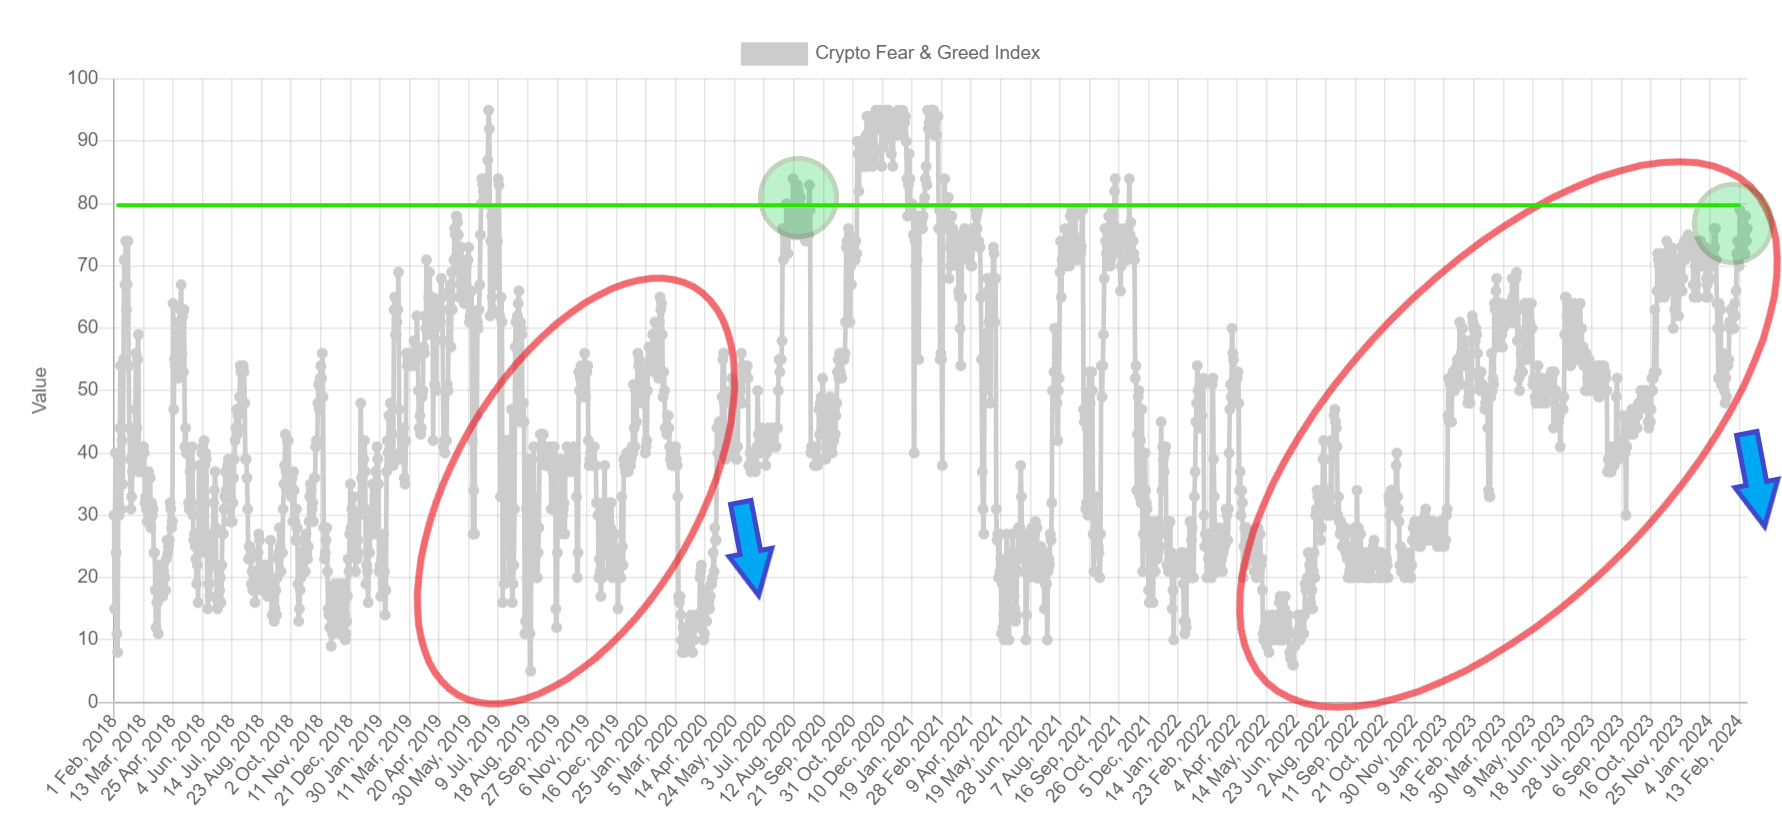
The 2020 crash ended with the Fear and Greed Index returning to extreme fear territory, in the vicinity of 10. This happened 3 months before Bitcoin’s previous halving. Under the current conditions, 2 months before the halving and with the market quite heated, the probability of a deeper correction (blue arrow) remains high.
Extreme Greed and the BTC Price
In addition, it is worth noting that in the previous cycle, the Fear and Greed Index did not reach the area of extreme greed before halving. Unlike now, the index indicated values above 75 only after halving when the BTC price reached the $12,000 area (green area).
It turned out that the first test of this resistance (green line) ended in rejection, and Bitcoin dropped briefly below $10,000 for the last time in September 2020. If such a situation were to occur now as well, a roughly 21% correction in the price of BTC remains in play. At that point, the Bitcoin price would test the $41,000 area, slightly above the 0.382 Fib retracement of the entire one-year upward movement.
If, on the other hand, there had been a stock market crash comparable to the COVID-19 events even before the halving, BTC could have fallen by about 62%. Then the price of BTC would have reached $20,000 again, which seems extremely unlikely under current market conditions.
However, despite these fractal similarities, each Bitcoin cycle runs slightly differently. Perhaps the extreme readings on the Fear and Greed Index will not end in a deep correction this time.
With the SEC approving Bitcoin ETFs, the oldest cryptocurrency is becoming an increasingly recognized and trusted global asset. This, in turn, eases the volatility of the broad cryptocurrency market, making deep corrections and absurdly high breakouts less and less common events.
For BeInCrypto’s latest crypto market analysis, click here.


