
Ethereum’s (ETH) price broke out from a combination of long-term resistance levels this week, nearly reaching $3,000.
Does this signify the start of Ethereum’s rise that will eventually take it to a new all-time high? Let’s find out!
Ethereum’s Indicator Gives Bullish Signal
The technical analysis of the weekly time frame shows the ETH price has increased quickly since October 2023.
Last week, it broke out from a long-term horizontal area that acted as support and resistance since June 2021. The ETH breakout led to a high of $2,984 yesterday, the highest since April 2022.

The weekly Relative Strength Index (RSI) gives an extremely bullish sign. Market traders use the RSI as a momentum indicator to identify overbought or oversold conditions and to decide whether to accumulate or sell an asset.
Readings above 50 and an upward trend indicate that bulls still have an advantage, whereas readings below 50 suggest the opposite.
The RSI is increasing and just moved above 70 (red icon). The previous bullish cycle (green vertical trend line) led to the acceleration of the upward movement toward the all-time high.
What Are Analysts Saying?
Cryptocurrency traders and analysts on X positively view the future Ethereum trend.
CryptoMichNL believes that ETH will outperform Bitcoin (BTC) in the ensuing upward movement.
“#Ethereum at $2,980. The cynical sounds that Ethereum wouldn’t provide anything as it was only down trending. This is still a massive period to be rotating from Bitcoin towards Ethereum. The upward momentum is continuing in Ethereum, not in Bitcoin” He stated.
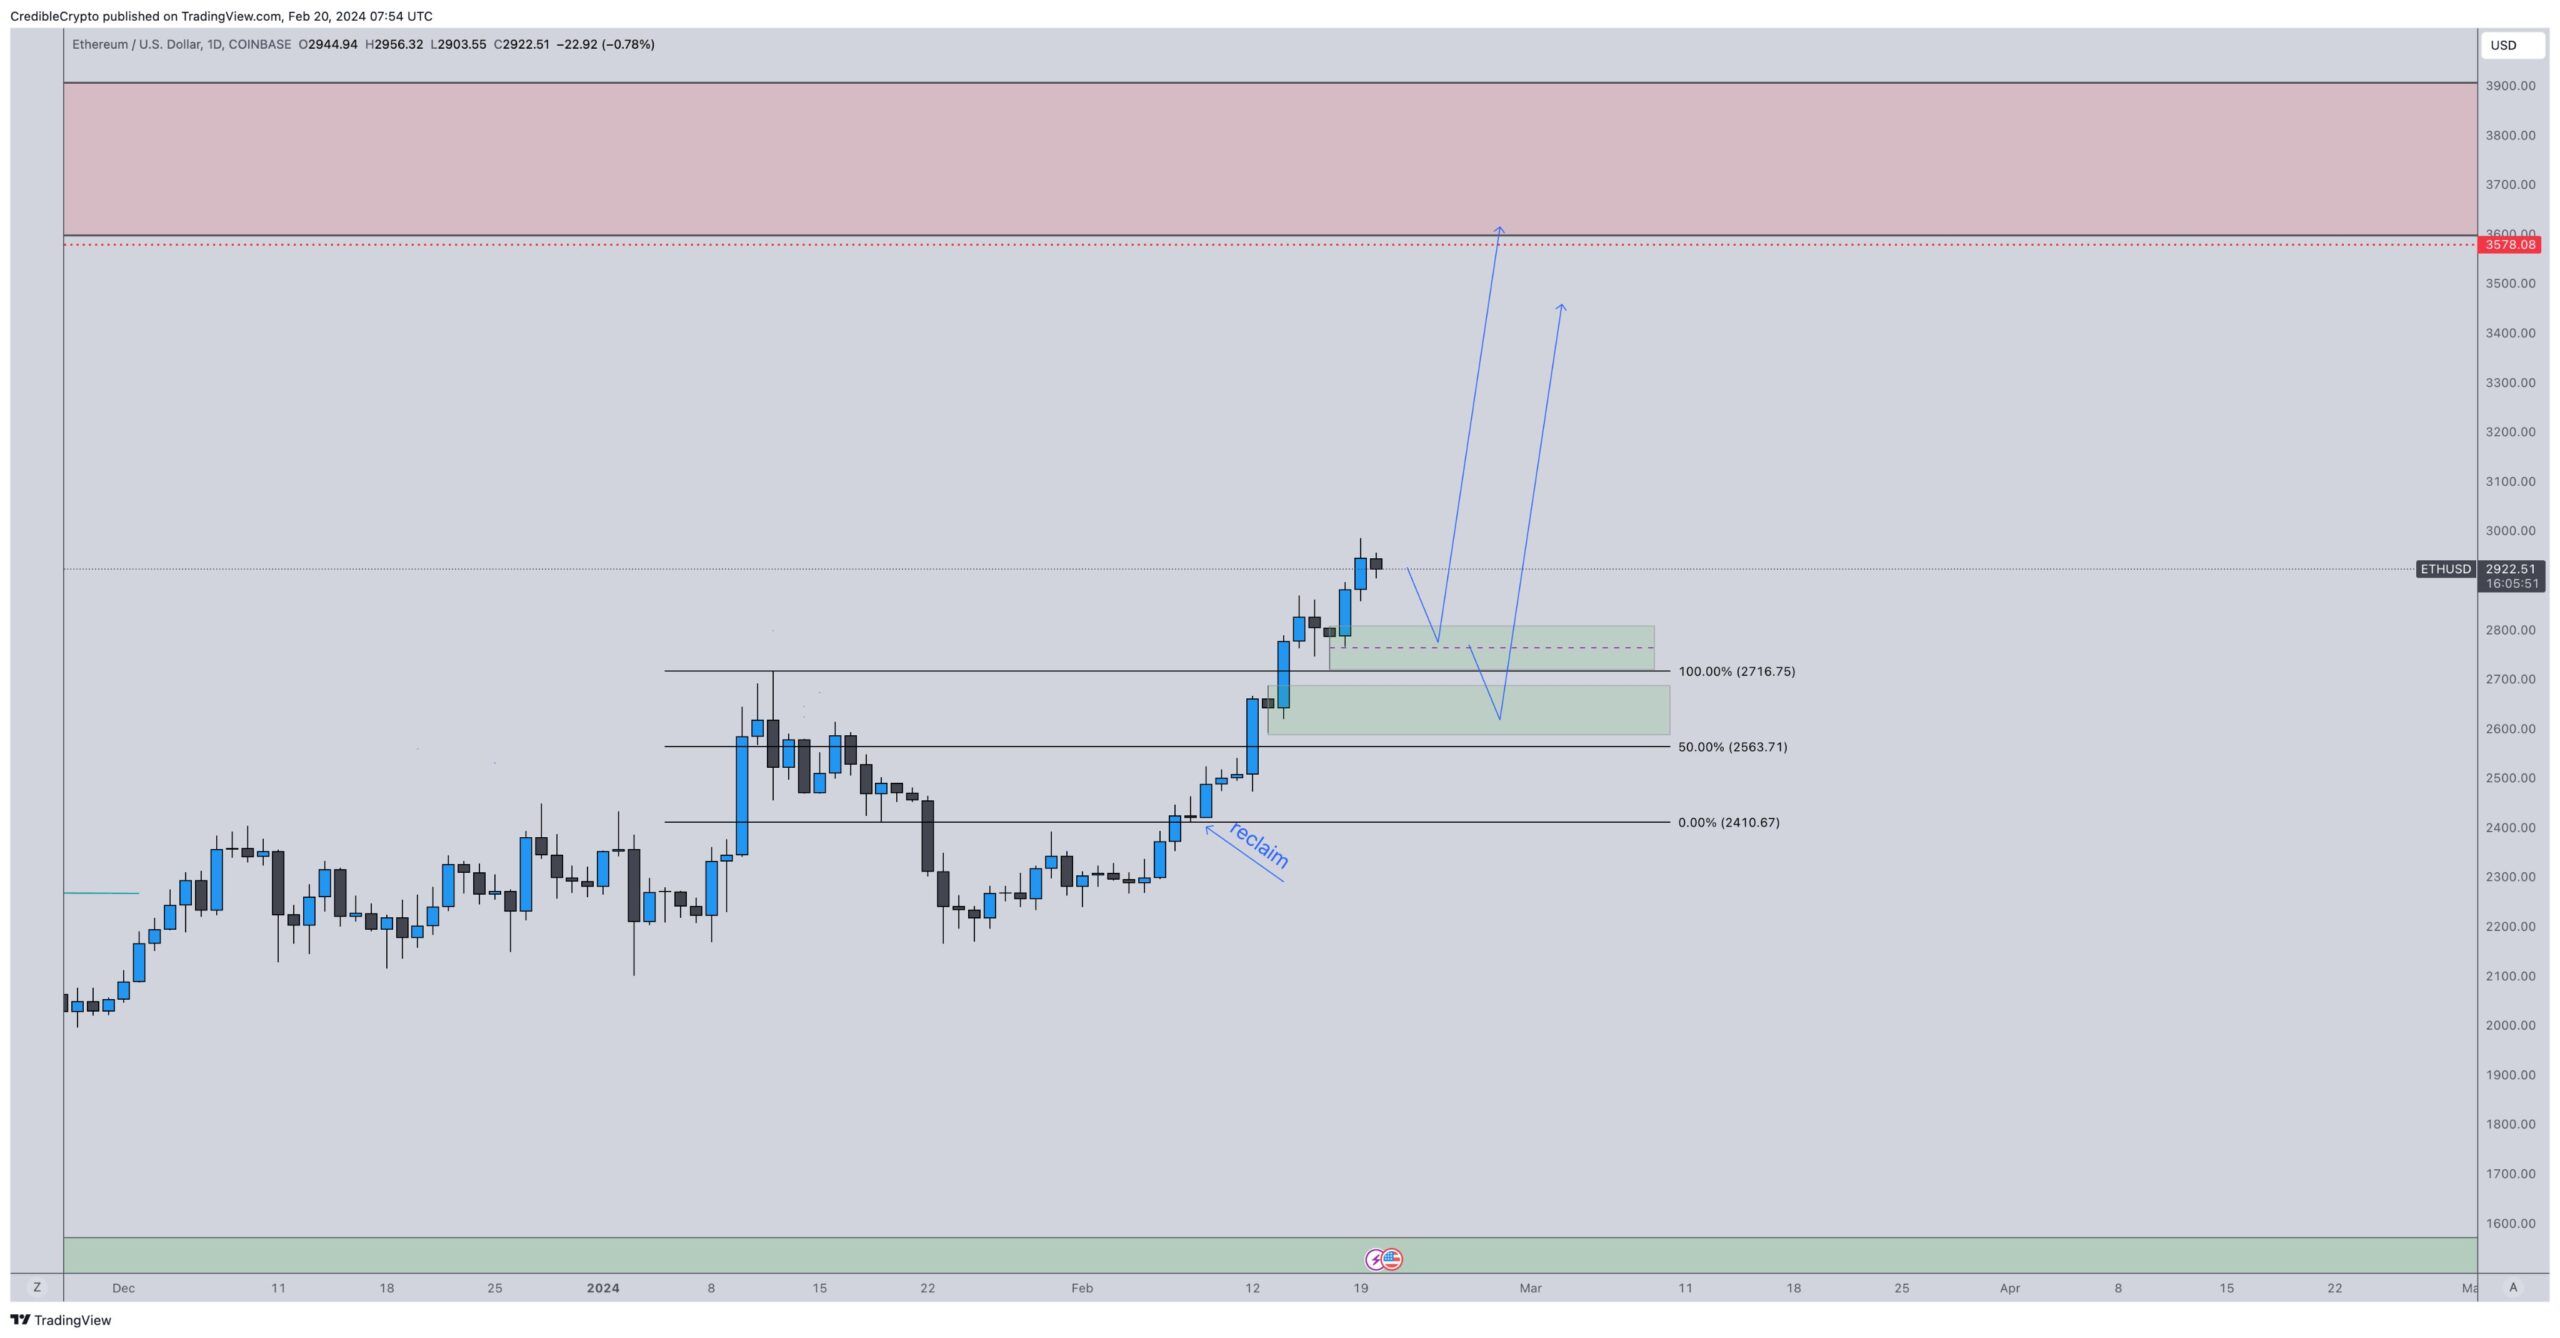
InmortalCrypto also believes ETH will outperform BTC because of the bullish-looking ETH/BTC chart, while CredibleCrypto suggests the ETH price will increase after a potential short-term drop.
Finally, Byzantine General notes that both the ETH price and interest are moving up at the same rate.
Ethereum Price Prediction: All-Time High Incoming?
A closer look at the price action since May 2022 gives all the signs of an impulsive upward movement.
Last week, the ETH price cleared two important resistance levels. The first was the ascending resistance trend line of an ascending parallel channel that has existed since the low. ETH has made two unsuccessful breakout attempts until now.
The second resistance is the middle of a long-term range (white) existing since 2021.
So, the Ethereum price action and indicator readings suggest the ongoing upward movement is impulsive and will eventually lead to a new all-time high. The range high is $4,000, 35% above the current ETH price.

Despite this bullish ETH price prediction, closing below $2,700 can lead to a nearly 20% drop to the channel’s midline at $2,500.
For BeInCrypto‘s latest crypto market analysis, click here.


