
Considering the Pi Cycle Top Indicator, the ETH price analysis suggests that Ethereum could see more corrections before attempting to reach the $4,000 mark again. Additionally, the Net Unrealized Profit/Loss (NUPL) indicates it’s still distant from the euphoria zone, hinting at a potential period of consolidation in the near future.
Furthermore, the Exponential Moving Average (EMA) Lines reveal prices converging closely, suggesting that there is strong support at the current levels, which may stabilize ETH prices before any significant upward movement.
Ethereum Pi Cycle Shows An Important Scenario
ETH trajectory on the Pi Cycle Top Indicator suggests a brewing consolidation phase, as evidenced by the gap between the 111-day moving average and the 350-day moving average times two.
Currently, the indicator’s upper boundary is set near $4,231, while the lower boundary rests around $2,750, a spread that allows for a breathing room indicative of market stabilization rather than a peak. It’s within this bandwidth that the ETH price could be carving out a foundation for its next ascent.
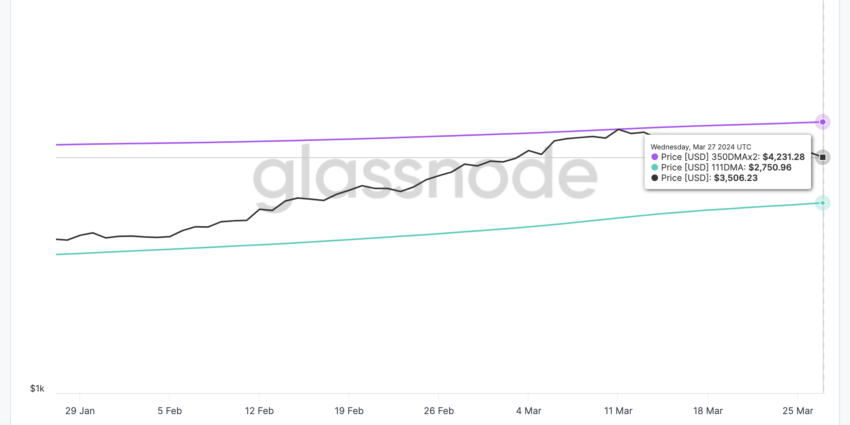
Pi Cycle Top Indicator operates on the principle that when the price surpasses the longer-term average (350-day multiplied by 2), a market top could be imminent, suggesting an overheated market poised for a downturn. When it’s below the short-term average, it could indicate the asset is undervalued.
ETH price between these averages and the parallel trajectory of the lines without a crossover event implies that while the heights of market euphoria are yet to be reached, the groundwork is being laid for a robust support level. This lack of convergence, combined with the current price activity, lends weight to the argument that ETH could be entering a consolidation phase.
Read More: Ethereum ETF Explained: What It Is and How It Works
ETH Is Still Far From Euphoria
ETH Net Unrealized Profit/Loss (NUPL) has been consistently oscillating between “Optimism — Anxiety” and “Belief — Denial,” a pattern that is indicative of the market’s indecision. Such a rhythmic shift between sentiment zones suggests that investors are alternating between cautious optimism and a stronger conviction in the asset’s potential, yet without fully committing to an overarching trend. This back-and-forth movement, or ‘going and coming,’ implies a potential consolidation phase for Ethereum.
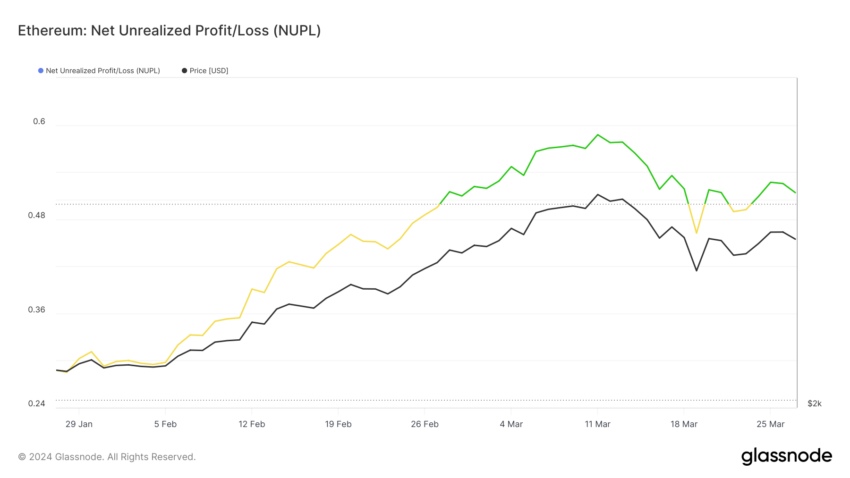
The NUPL’s brief stays in “Belief — Denial” to prevent market overheating. The sentiment suggests a market stabilizing, avoiding big sell-offs or selloffs.
This sentiment balance may prep ETH’s price for steady climbs. Without strong greed or fear, a gradual rise is more likely than volatile swings.
ETH Price Prediction: Consolidation Before New Surges
ETH Exponential Moving Average (EMA) lines on the 4-hour price chart provide valuable insight into the asset’s price action. The EMA lines are tracking close to each other, which indicates that there’s little volatility and the price is experiencing a consolidation phase.
EMAs are a type of moving average that gives more weight to recent prices, making them more responsive to new information. When EMA lines converge, as they seem to be on the chart below, it often signifies that a strong trend is not in place, and prices could move sideways for some time.
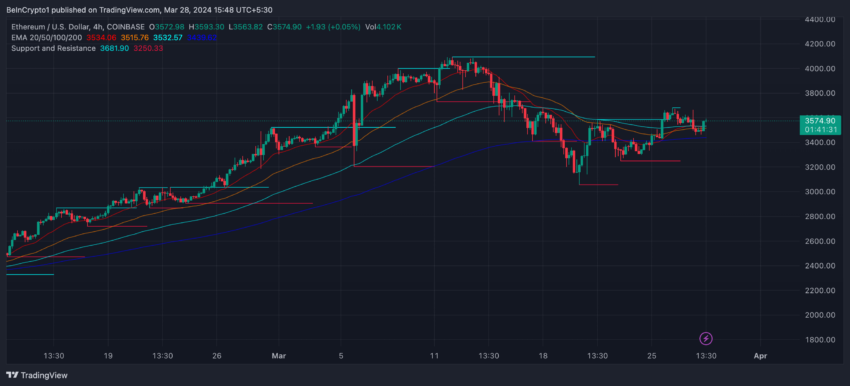
The price of ETH is hovering around these lines, suggesting an equilibrium between buyers and sellers. If an uptrend is to commence, a decisive break above these tangled EMA lines could propel ETH’s price toward the $4,100 resistance level. An upcoming ETH ETF could help this uptrend to appear.
Read More: Ethereum Restaking: What Is It And How Does It Work?
If the consolidation phase turns bearish, ETH could drop to $3,200 support. A deeper slide to $2,900 is possible under wider negative sentiment. Currently, clustered EMA lines hint at ongoing range-bound trading for Ethereum. Any decisive move out of this band will likely define its next major price trend.