
The Filecoin (FIL) price reached a high of $8.45 today. This is the highest price since February 2023.
FIL broke out from a descending resistance trend line and moved above a horizontal resistance area.
Filecoin Breaks Out
The technical analysis of the weekly time frame shows the FIL price had fallen under a descending resistance trend line for 570 days. The decrease culminated with a low in December 2022, and the FIL price has gradually increased. After two unsuccessful breakout attempts, FIL finally moved above the trend line and a horizontal resistance area this week.
FIL reached a high of $8.48, the highest since February 2023. If the upward movement is sustained until the end of the week, it will confirm the breakout from the resistance trend line.
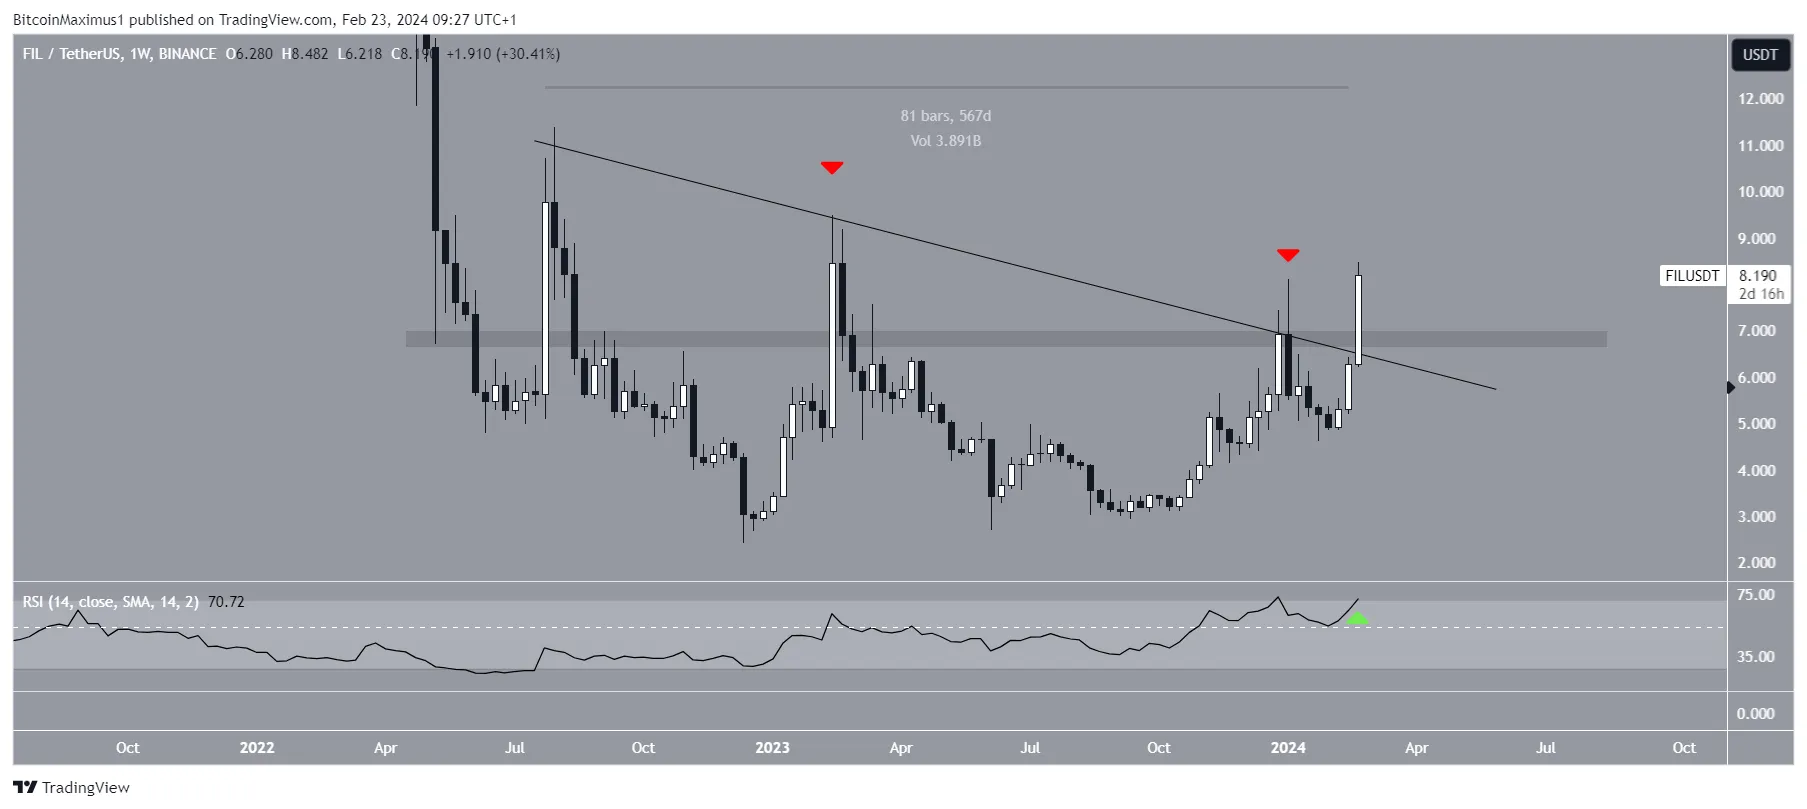
The weekly Relative Strength Index (RSI) is bullish. The RSI is a momentum indicator traders use to evaluate whether a market is overbought or oversold and whether to accumulate or sell an asset.
Readings above 50 and an upward trend suggest that bulls still have an advantage, while readings below 50 indicate the opposite. The indicator is increasing and nearly above 70 (green icon).
What Are Analysts Saying?
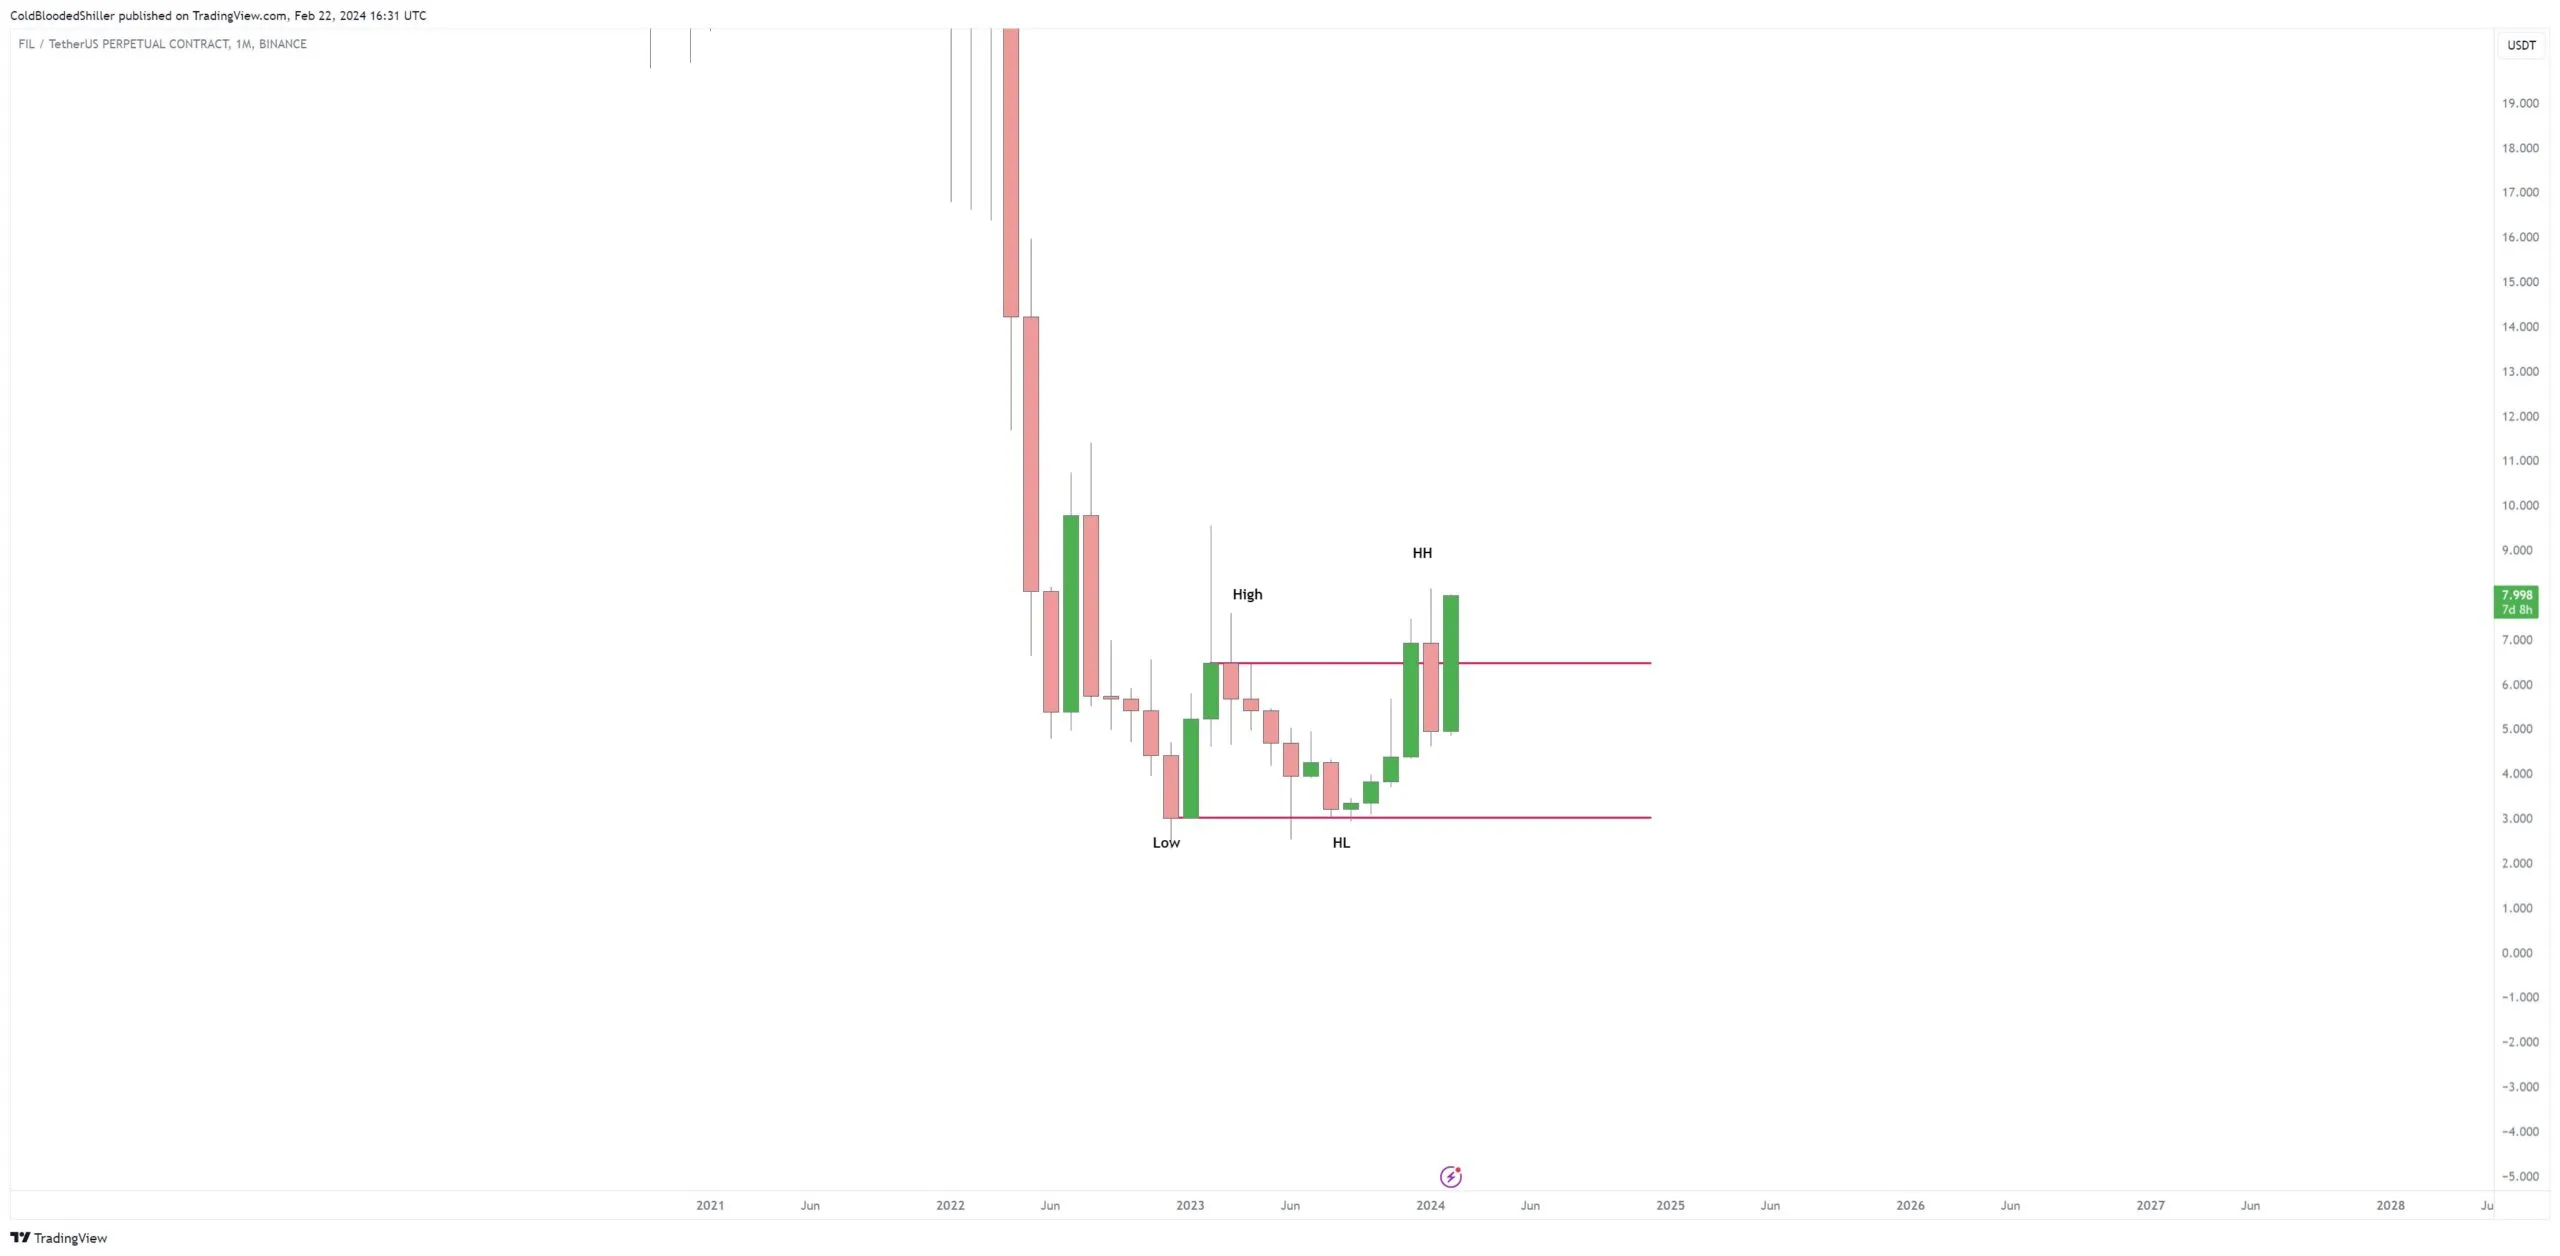
Cryptocurrency traders and analysts on X positively view the future FIL trend. ColdBloodShill noted the price is higher in the monthly time frame.
BluntzCapital noted the price is breaking out from a long-term resistance trend line, while Captain Faibik predicts a nearly 200% price increase.
FIL Price Prediction: Is $10 Next?
The daily time frame price action, wave count, and RSI readings support the continuation of the upward movement. The price action shows that FIL increased and closed above the $7.60 horizontal resistance area, which is now expected to provide support.
The wave count suggests that FIL is in wave three of a five-wave upward movement. Elliott Wave theory involves the analysis of recurring long-term price patterns and investor psychology to determine the direction of a trend.
So, if the count is correct, FIL could undergo a short-term decrease that validates the $7.60 area and completes wave four before an upward movement begins. Finally, the daily RSI is above 70 and increasing.
Additionally, if the FIL upward movement continues, the next resistance will be at $10.30, nearly 30% above the current price. The resistance is created by the 1.61 external Fib retracement of the previous decrease.
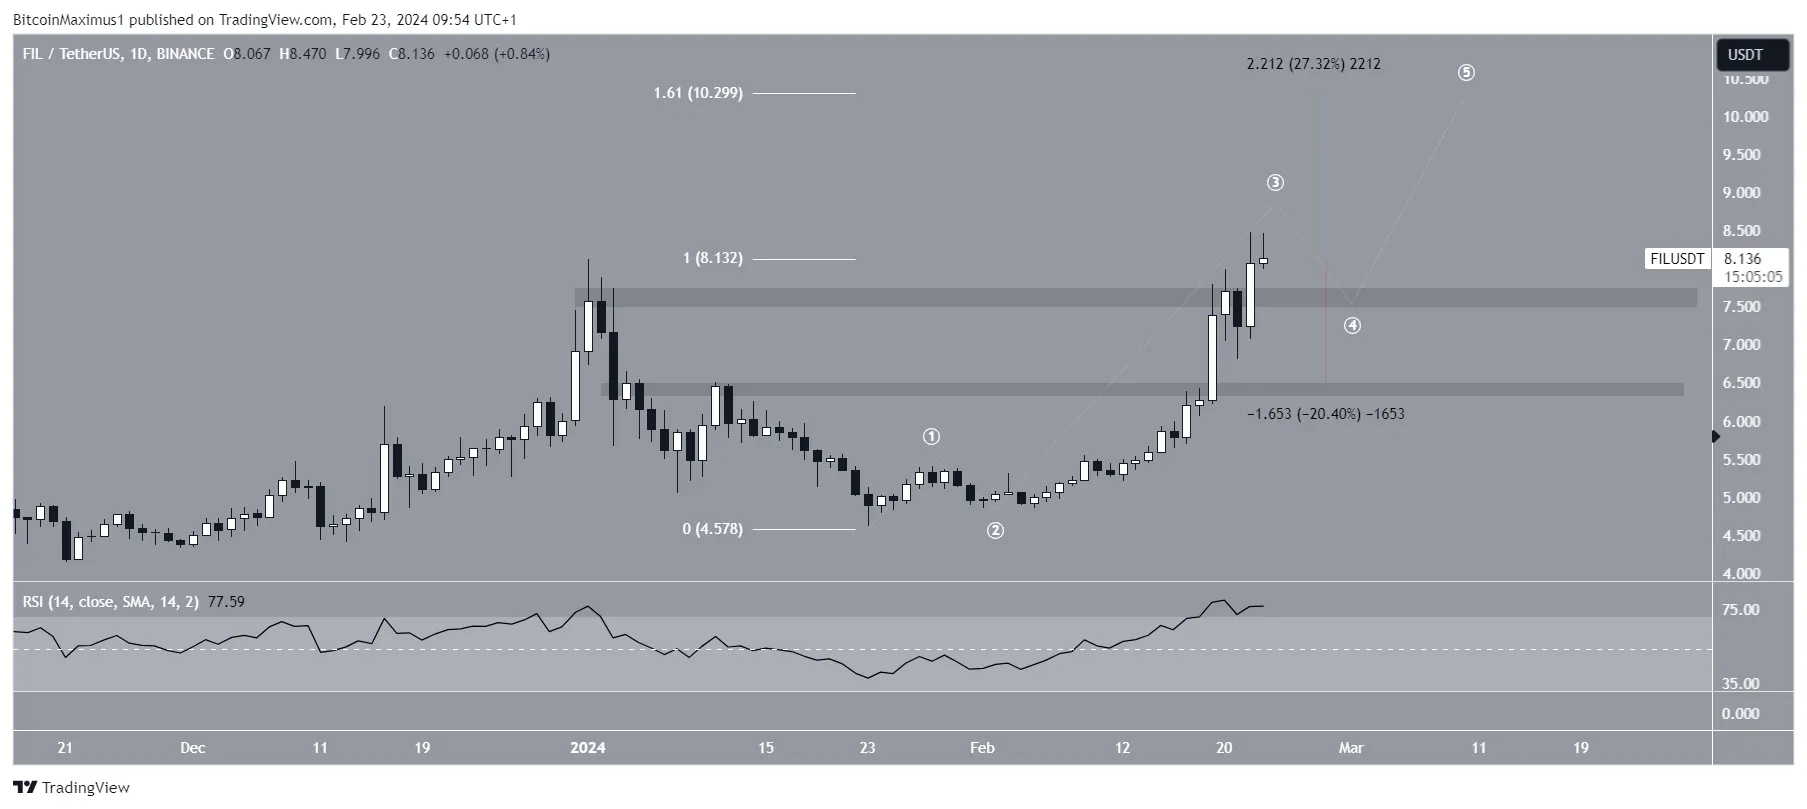
Despite this bullish FIL price prediction, closing below $7.60 can trigger a significant downward movement that takes the price to the next support at $6.50, a decrease of 20%.
For BeInCrypto‘s latest crypto market analysis, click here.