
Bitcoin Cash (BCH) is currently struggling to break through the golden ratio resistance level. However, if it successfully surpasses this resistance, there’s potential for a bullish breakout in the BCH price.
The price of Bitcoin Cash fluctuates between the golden ratio support and golden ratio resistance levels. Despite these fluctuations, a bullish breakout has not yet materialized.
Bitcoin Cash Struggles to Surpass $270 Golden Ratio Barrier
The price of Bitcoin Cash is currently facing challenges in surpassing the golden ratio resistance, located approximately at $270. Recently, BCH experienced a bearish rejection at this level.
In the daily chart, the Moving Average Convergence Divergence (MACD) histogram is trending downwards, signaling a bearish trend. However, the MACD lines are still in a bullish crossover, and the Relative Strength Index (RSI) is neutral, indicating mixed signals.
Bitcoin Cash is finding short-term support at around $249.6. Should this level be breached, the next support is expected at the 50-day Exponential Moving Average (EMA), around $234.6. In case of further decline, significant Fibonacci (Fib) support for BCH is anticipated at the golden ratio level, approximately $200.
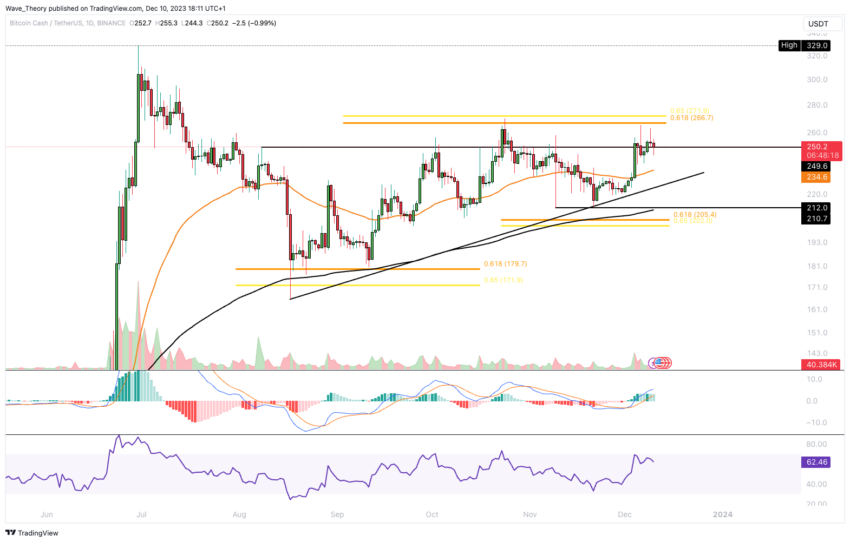
Despite the current challenges, the overall trend for Bitcoin Cash remains bullish in the short to medium term, as evidenced by the golden crossover of the EMAs.
Golden Crossover Emerges in Bitcoin Cash’s 4H Chart
In the 4-hour chart, a golden crossover has emerged for Bitcoin Cash, indicating a bullish trend in the short term. Additionally, the Relative Strength Index (RSI) is currently neutral.
Contrastingly, the Moving Average Convergence Divergence (MACD) lines have crossed bearishly, and the MACD histogram also reflects a bearish trend. Currently, BCH is finding support at the 50-4H Exponential Moving Average (EMA), which is around $245.
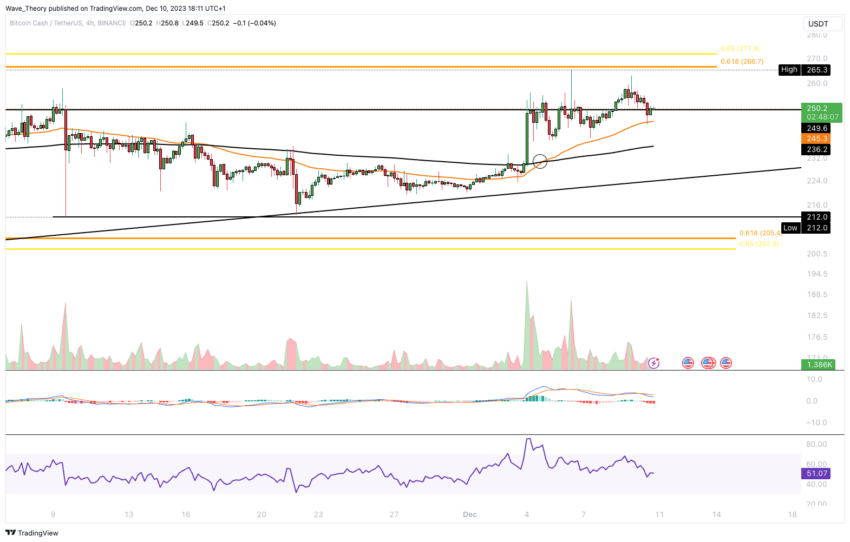
Despite these bearish signals, Bitcoin Cash still maintains an overall upward trajectory. The bullish trend for BCH will remain intact as long as the price stays above the golden ratio, around $200.
Weekly Chart Update: MACD Histogram in Bitcoin Cash Ticks Upward Bullishly
In the weekly chart for BCH, the Moving Average Convergence Divergence (MACD) histogram is showing a bullish uptick this week. However, the MACD lines remain in a bearish crossover, and the Relative Strength Index (RSI) is positioned in neutral territory, not indicating a clear bullish or bearish trend.
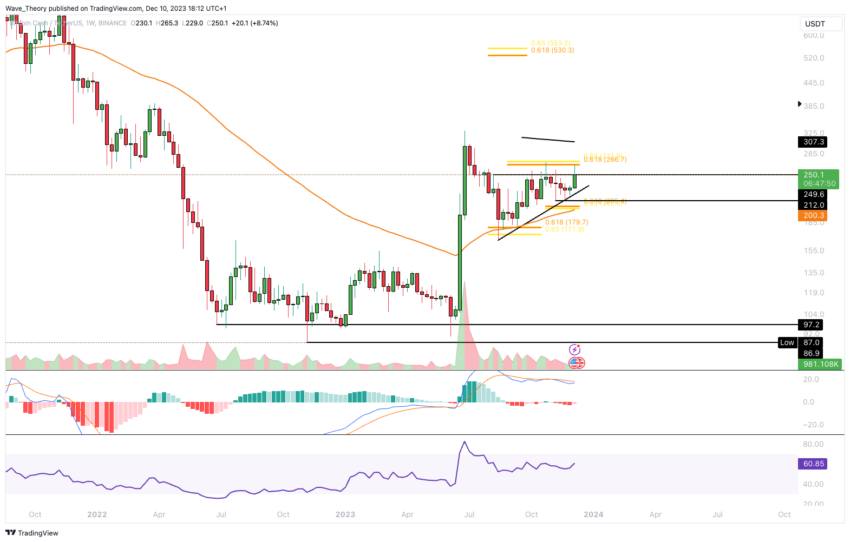
Should BCH successfully break through the Golden Ratio resistance level at approximately $270, there’s potential for the price to ascend towards the last high, around $329.
However, it’s important to note that the 200-week Exponential Moving Average (EMA) poses a significant resistance level at around $307, which BCH must surpass to continue its upward trajectory.
Monthly Chart Analysis: Bullish Uptick in Bitcoin Cash’s MACD Histogram
In the monthly chart for Bitcoin Cash, the Moving Average Convergence Divergence (MACD) histogram displays a bullish increase this month, following a bearish downturn in the previous month. Additionally, the MACD lines are in a bullish crossover.
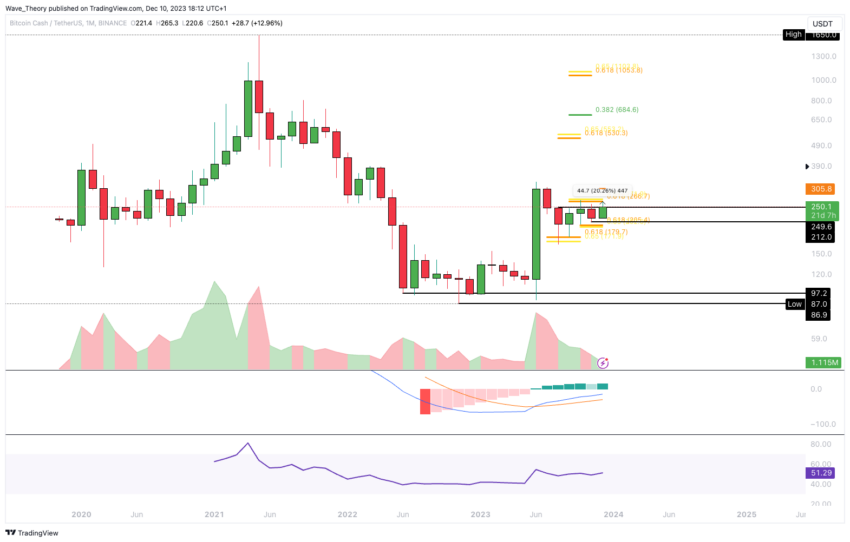
Reflecting this positive momentum, the price of Bitcoin Cash has experienced an approximate 20% increase so far this month. This notable uptrend indicates that December has been a particularly bullish period for Bitcoin Cash.
Bitcoin Cash Price Fluctuates Between Fibonacci Resistance and Support vs BTC
In trading against Bitcoin (BTC), Bitcoin Cash has bearishly broken through the significant golden ratio support level at approximately 0.0062 BTC. Currently, the price is finding notable support in the range between roughly 0.00497 BTC and 0.0059 BTC.
Looking upwards, the former support level at the golden ratio, around 0.0062 BTC, now serves as a resistance level. The overall indicators in the monthly chart for BCH against BTC appear rather bearish.
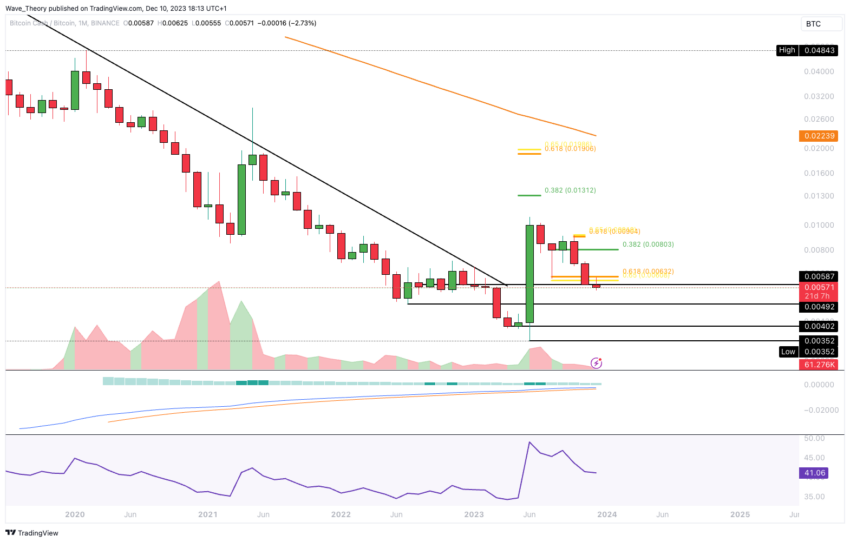
While the Moving Average Convergence Divergence (MACD) lines remain in a bullish crossover, the MACD histogram has been trending downwards in a bearish manner for several months.
Additionally, the Relative Strength Index (RSI) is neutral, not indicating a clear bullish or bearish trend. This combination of indicators suggests a period of uncertainty and potential volatility for Bitcoin Cash in its value relative to Bitcoin.


👍