
With a recent strong correction in NEAR price, its transactions have decreased since peaking on March 3, with its Relative Strength Index (RSI) also declining but remaining above the overbought threshold. The price chart indicates an approaching death cross, a bearish signal suggesting a potential downtrend.
This trio of factors – reduced transactions, a high yet falling RSI, and the imminent death cross – signals caution for the NEAR market outlook.
Near Number of Transactions Is Falling
After reaching a peak of more than 6 Million daily transactions on March 3, the number of transactions started to fall in the last two weeks. That peak in March was the biggest daily number of transactions for NEAR protocol since December 29, 2023, and its second-biggest value ever.
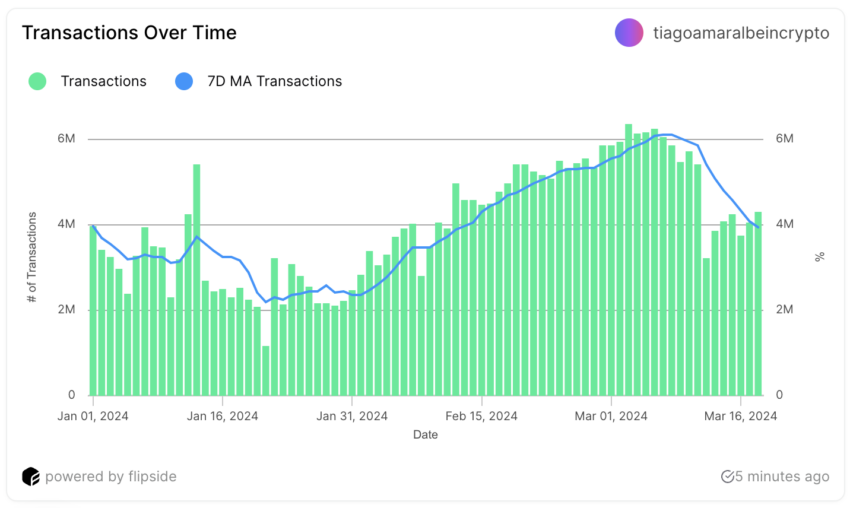
Since its number of transactions started to grow daily, from February 1 to March 3, its price also followed that lead. In that same period, NEAR price went from $2.85 to $4.81, a 68.77% growth.
Following its March 3 peak, the 7-day Moving Average indicates a slowdown in transactions. Interestingly, NEAR price still surged, rising from $4.13 to $8.94 by March 14, marking a 116.46% increase. This implies that NEAR price, in the recent crypto market environment, might not closely follow its fundamentals. The swift 11-day price jump could stem from broader crypto market growth.
RSI Is Still Showing an Overbought State
After a strong bull run like the one that happened with NEAR, it’s also good to check the RSI 7D.
For NEAR, its RSI was above 80 from February 29 to March 13, the same period the price skyrocketed. However, the correction started, and the NEAR price went from $8.84 to $6.6 in 4 days. NEAR RSI currently sits at 78. Its RSI moving from 82 to 78 implies a slight decrease in the momentum of price increases.
Initially, an RSI of 82 indicates that NEAR was potentially overbought. That suggests that its price might have risen too quickly and could be due for a correction or pullback as traders might start taking profits.
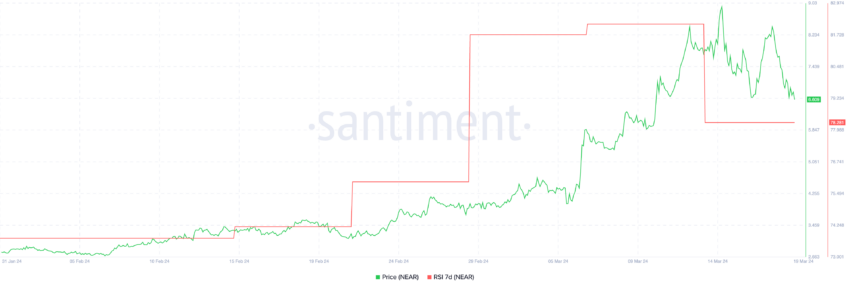
The Relative Strength Index (RSI) is a momentum indicator used in technical analysis that measures the magnitude of recent price changes to evaluate overbought or oversold conditions. The RSI can have a reading from 0 to 100.
Typically, an RSI above 70 is considered overbought, while an RSI below 30 is considered oversold. These thresholds can help traders identify potential reversal points based on perceived overvaluation or undervaluation.
NEAR Price Prediction: Is A Death Cross Imminent?
It’s possible to see that the short-term EMA lines are close to crossing below more long-term lines. This would form a “death cross,” a bearish signal.
EMA lines, or Exponential Moving Average lines, are trend indicators that give more weight to the most recent price data. They’re used to smooth out price action and identify the direction of the trend over a specific period. This indicates that the current trend could be reversing from bullish to bearish, which aligns with the potential price movements discussed.
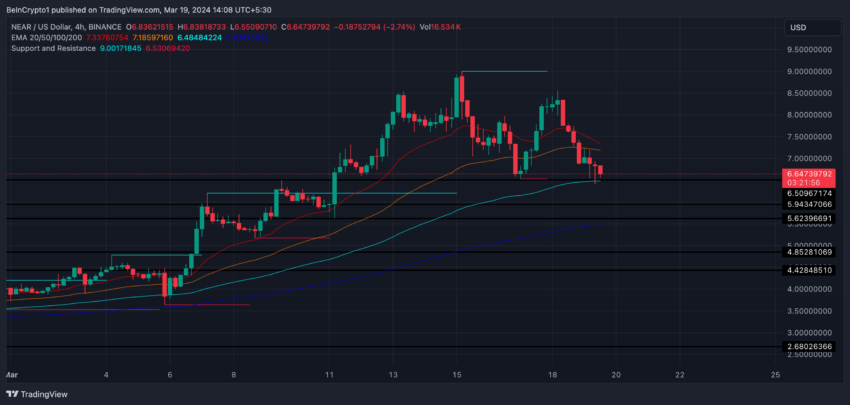
In the context of NEAR price, the $5.13 level serves as a crucial support zone. If NEAR fails to maintain this support, it could witness a decline towards $3.64. That would represent a potential drop of about 45% from the current price of $6.64.
If there’s a reversal in the current trend, NEAR could climb back to the $9 mark. That would be a potential increase of approximately 35%.