Bitcoin’s Short-Term Volatility Does Not Alter Mid-Term Bearish Trend, HYPE Presents Another Long Opportunity | Invited Analysis
This week, we will focus on two main themes: First, HYPE’s Wave IV correction is nearing completion in terms of both time and price. The daily chart bottoming pattern is strengthening, and our quantitative model has also triggered a bottom warning. We will focus on capturing long entry opportunities this week. Second, Bitcoin’s medium-term bearish trend remains unchanged. We maintain our range-bound consolidation forecast for this week and will flexibly execute two short-term trading plans (A and B) based on support/resistance levels and model signals.
Summary of This Week’s Core Trading Views:
• HYPE multi-timeframe structure analysis. (See Part 1)
• HYPE market forecast and short-term trading strategy for this week. (See Part 2)
• BTC multi-timeframe structure interpretation. (See Part 3)
• BTC market forecast and medium/short-term trading strategies for this week. (See Parts 4 & 5)
Market Validation of Last Week’s Core Views:
• BTC Short-term Trade Performance: We executed one short-term short trade on Bitcoin last week (1x leverage), successfully achieving a profit of approximately 2.45%. (See Table 1)
• BTC Medium-term Trade Performance Validation: Following the established medium-term strategy, we continued holding the short position opened at around $89,000 (1x leverage). As of last week’s close (~$69,031), the profit is approximately 22.43%, with a maximum profit of about 32.58% during the period.
• BTC Market Forecast Validation: In last week’s article, we stated that the market would maintain a range-bound consolidation pattern. The current market action validates this previous view.
I. HYPE: Structure Analysis
1. HYPE Daily Timeframe Structure Division: (Based on price action since Jan 21)
HYPE Daily Candlestick Chart
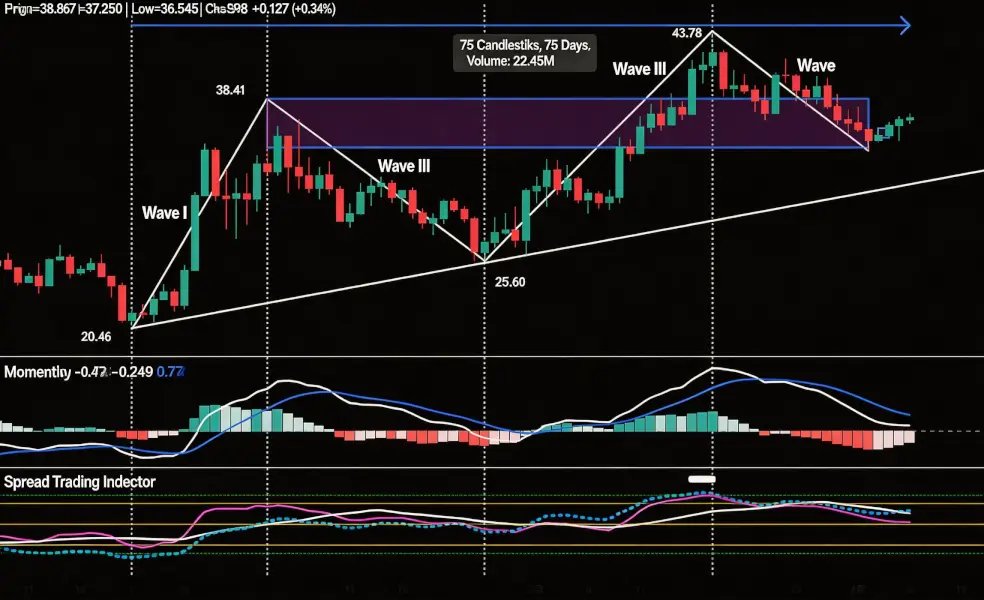
Figure 1
As shown in (Figure 1):
• Wave I (Impulse Wave): From the Jan 21 low of $20.46 to the Feb 3 high of $38.41, lasting 14 days, with a maximum gain of 87.73%.
• Wave II (Corrective Wave): From the Feb 3 high of $38.41 to the Feb 24 low of $25.60, lasting 20 days, with a maximum decline of 33.35%.
• Wave III (Main Impulse Wave): From the Feb 24 low of $25.60 to the Mar 18 high of $43.78, lasting 23 days, with a maximum gain of 71.02%.
• Wave IV (Corrective Wave): From the Mar 18 high of $43.78 to present, has lasted 18 days so far, with a maximum decline of 21.33%.
2. In-depth Analysis of HYPE’s Current Structure (Using 4-hour as analysis cycle)
HYPE 4-hour Candlestick Chart
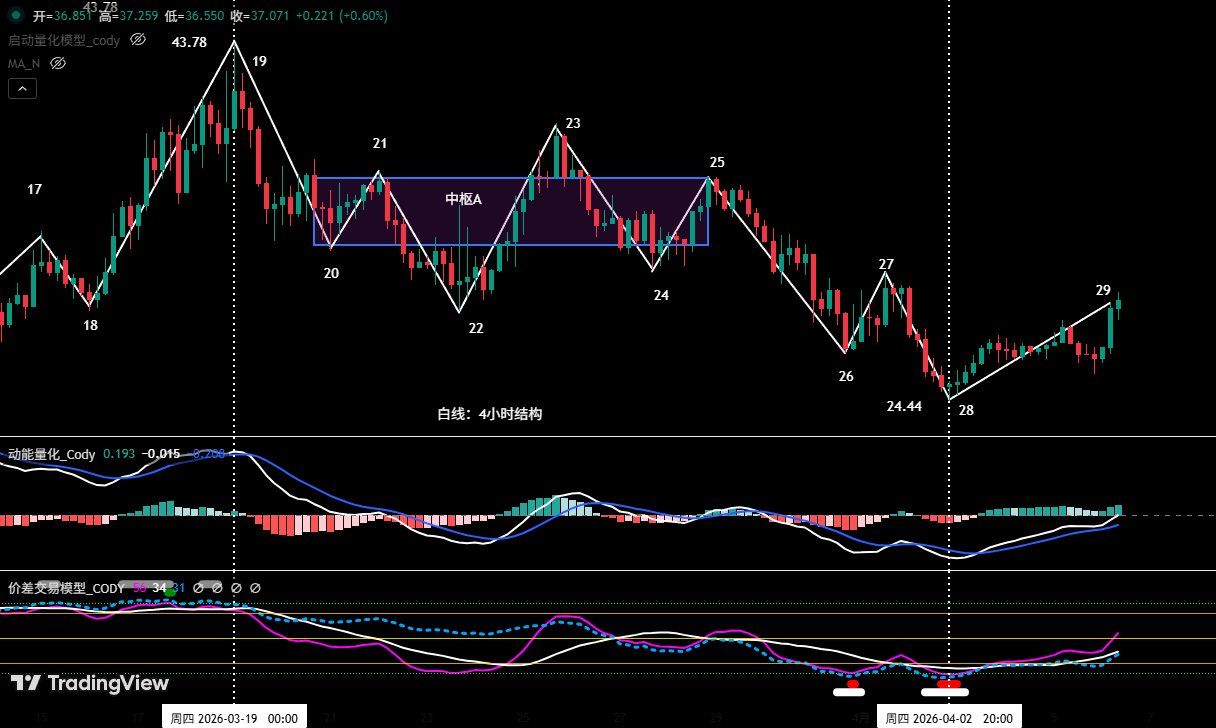
Figure 2
• Division based on the Wave IV correction following the Mar 18 high of $43.78.
• As shown in (Figure 2), Wave IV can be subdivided into a complex corrective structure consisting of 9 segments between pivot point 19 and pivot point 28: 19-20, 20-21, 21-22, 22-23, 23-24, 24-25, 25-26, 26-27, 27-28.
• Center A: Within the 5-segment structure of 20-21, 21-22, 22-23, 23-24, 24-25, these segments overlap with each other, forming a descending center (Center A).
• The current price action is in segment 28-29. The chart shows that key momentum divergence signals have appeared: comparing the entry segment (19-20) with the exit segment (25-26), and comparing segment 25-26 with segment 27-28, both show weakening downward momentum. This suggests the Wave IV correction is highly likely to have ended near pivot point 28.
• From our proprietary Spread Trading Model, bottom warning signals were triggered at pivot point 26 and pivot point 28 (red and white dots in the chart).
II. HYPE: This Week’s Market Forecast & Short-term Trading Strategy
1. HYPE Market Forecast for This Week:
• From a daily perspective, the Wave IV correction initiated from the Mar 18 high of $43.78 has lasted 19 days. Considering the previous Wave II correction lasted about 20 days, this correction may be nearing its end.
• Analysis from the 4-hour cycle suggests a high probability that the Wave IV correction ended near pivot point 28.
• This Week’s Forecast: From a technical analysis perspective, HYPE’s Wave IV correction has largely fulfilled its time and price objectives. The daily “bottoming candlestick pattern” formed at the Apr 1 low is strengthening, combined with the bottom warning signals triggered by the quantitative model. Therefore, this week we focus on identifying the end of HYPE’s correction and capturing entry opportunities.
2. HYPE Short-term Trading Strategy for This Week:
• Based on the forecast of an overall uptrend, the strategy should follow “trade with the trend, buy on dips”.
• Using signals from our proprietary quantitative model, with 30-minute/60-minute as the operation cycle, utilize 30% of capital to capture long entry opportunities.
• Entry Strategy: The price is currently oscillating higher. If the price can break through the key resistance at $38 this week and successfully retest and hold above the support at $34.47 (Apr 2 low) (the further the retest is from this low, the better), it may constitute a high-probability right-side buying opportunity.
3. HYPE Upside Risk Warning: Although HYPE’s price action has some independence, it cannot completely decouple from Bitcoin’s broader environment. If Bitcoin shows a significant correction later, it may affect HYPE’s rebound momentum.
III. Bitcoin: Structure Interpretation
1. BTC Daily Timeframe Structure Analysis: (Based on price action since Feb 6)
• The rally in Bitcoin initiated from the ~$60,000 low on Feb 6 can still be defined within the Elliott Wave structure as a C-2 wave oversold rebound within a larger-degree C wave correction. If the subsequent rebound fails to break above the ~$76,000 level from Mar 17, the probability of a subsequent C-3 wave decline is high.
• Key Observation Points for Structural Evolution:
The current rebound cycle is extending. We need to monitor whether the subsequent rebound can break above the Mar 17 high. If it successfully breaks, this rebound may upgrade to a more complex D wave rebound (same degree as the C wave), potentially followed by an E wave correction.
• Core Conditions for Trend Confirmation:
The key signal to ultimately determine the start of the C-3 wave (or E wave) correction is a decisive price break below the previous low support around $60,000 from Feb 6. Before that, the market remains in a phase of contention between rebound and trend reversal.
2. In-depth Analysis of BTC’s Current Structure: (Using 4-hour as analysis cycle)
Bitcoin 4-hour Candlestick Chart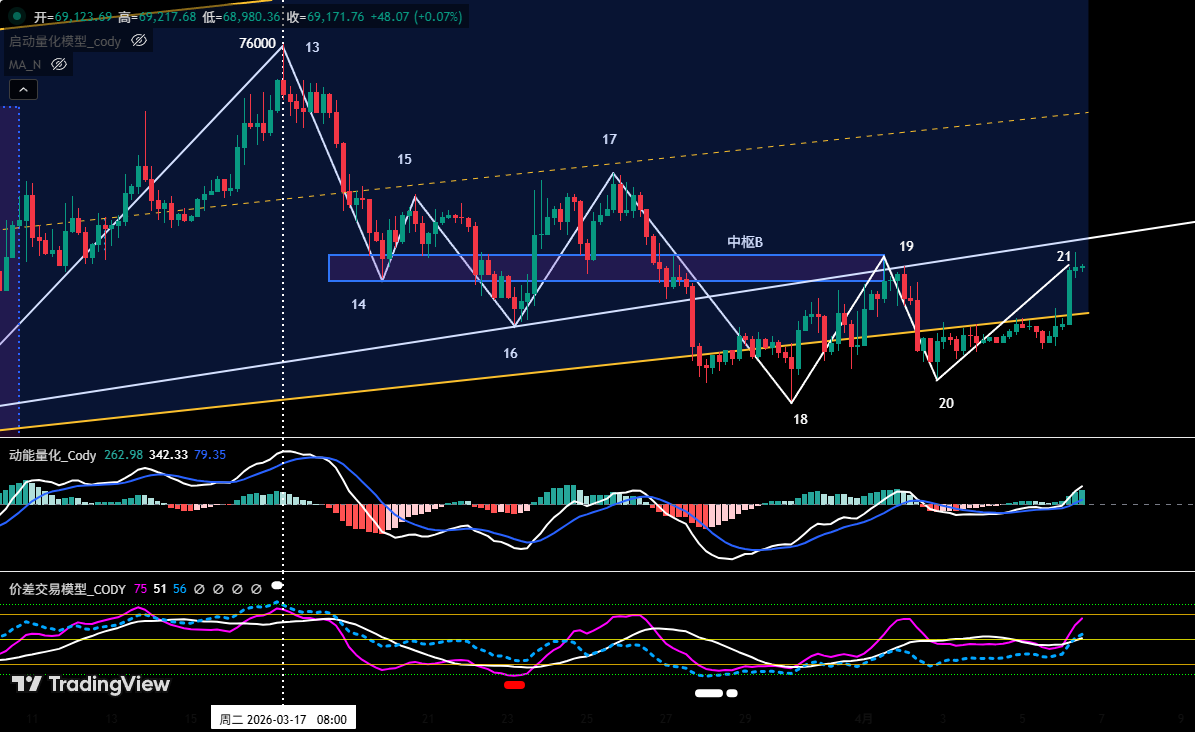
Figure 3
• Based on price action following the Mar 17 high (~$76,000).
• As shown in (Figure 3), BTC has been in a correction since the Mar 17 high. From pivot point 13 to pivot point 21, there is an 8-segment structure.
• Center B: The descending center consists of 6 segments: 14-15, 15-16, 16-17, 17-18, 18-19, 19-20, and is continuously extending to the left.
• Currently, segment 20-21 is in progress, with the price touching near the upper boundary of the center around $69,300.
IV. Bitcoin: This Week’s Market Forecast & Short-term Trading Strategy
1. BTC Market Forecast for This Week:
• Core View for This Week: Price maintains range-bound consolidation between $65,000 and $69,500. If it effectively breaks above the resistance near $69,500, it may enter a wider consolidation range of $65,000 to $72,000. If it breaks below the $65,000 support, watch for support in the $60,000 to $62,500 zone.
• The beginning of the week is near a news-sensitive window; a wait-and-see approach is recommended.
3. Core Resistance Levels:
• First Resistance Zone: $69,500 – $72,000 area (previous consolidation range)
• Second Resistance Zone: $74,500 – $76,000 area (near the November 2025 low)
4. Core Support Levels:
• First Support Level: $65,000 – $66,000 area (previous important support zone)
• Second Support Level: $60,000 – $62,500 area (near the Feb 6 low)
• Third Support Level: Around $57,400
5. This Week’s Trading Strategy (Excluding Impact of Sudden News): (04.06~04.12)
① Medium-term Strategy:
Bitcoin Daily Candlestick Chart: (Position Monitoring Model)
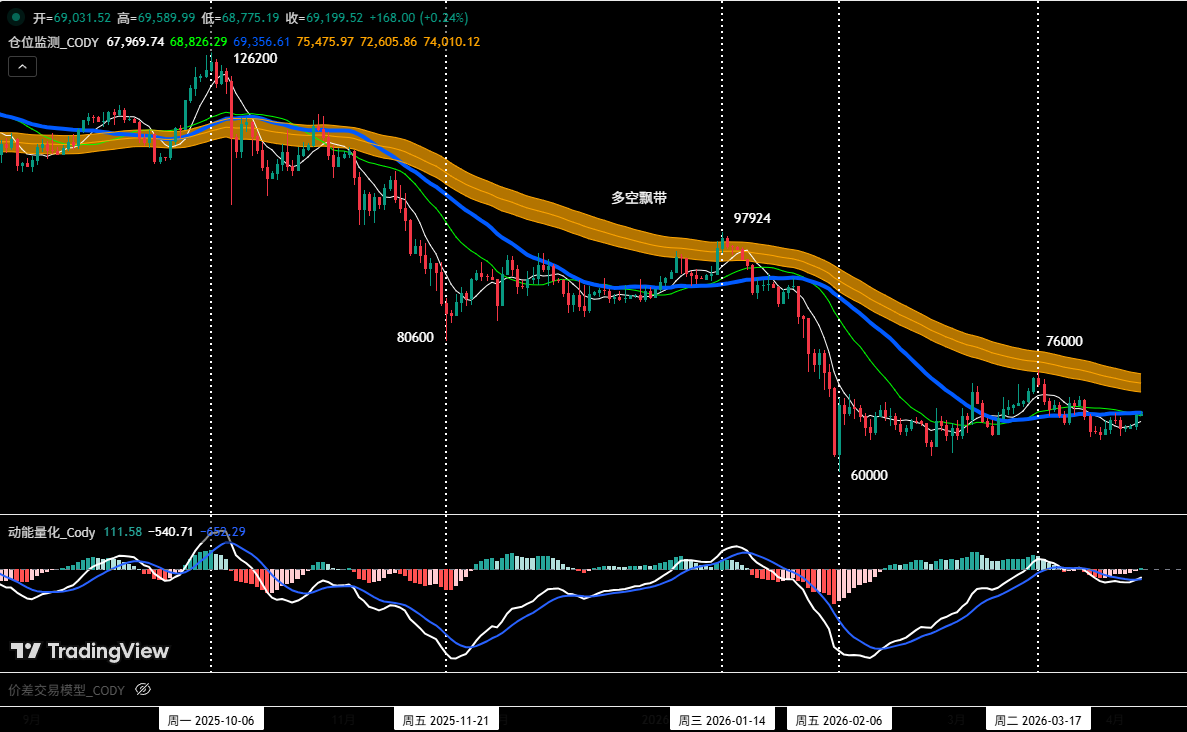
Figure 4
Position Monitoring Model: As shown in (Figure 4), the price is currently below the Bull-Bear Ribbon (yellow), indicating the bearish trend continues. Following the strategy rules, we continue to hold the 60% short position established at $89,000 (Jan 28).
• If the price rebounds and effectively breaks above and stabilizes above the Bull-Bear Ribbon, all medium-term positions will be closed.
② Short-term Strategy: Utilize 30% of capital, set stop-loss points, and look for “spread” trading opportunities based on support and resistance levels. (Using 30-minute/60-minute as operation cycle).
③ Based on the forecast of a medium-term bearish market trend, the current operating principle should be “trade with the trend, go short”. To dynamically respond to the market’s complex evolution and combined with signals from our proprietary trading model, we have formulated two short-term operation plans (A and B):
• Plan A: Short on rallies encountering resistance.
• Entry: When the price rallies to the $69,500 – $72,000 zone, triggers a resistance signal, and combines with a model top signal, a 15% short position can be established.
• Add Position: When the price continues to rally to the $74,500 – $76,000 zone, triggers a resistance signal, and combines with a model top signal, an additional 15% short position can be added.
• Risk Control: Initial stop-loss for both short entries is set above $76,500.
• Exit: When the price falls near important support levels and combines with model signals, positions can be gradually closed to take profits.
• Plan B: Follow-through short on breakdown.
• Entry: When the price effectively breaks below the support near $65,000 and combines with a model top signal, a 30% short position can be established following the trend.
• Risk Control: Initial stop-loss for the short position is set above $67,000.
• Exit: When the price declines to support levels and combines with model signals, positions can be gradually closed to take profits.
V. Bitcoin: Last Week’s Trade Review
1. Short-term Trade Review: (See Table 1)
We strictly followed the operation plan. Based on trading signals from our proprietary Spread Trading Model and Momentum Quantitative Model, we executed one short-term (short) trade last week, achieving a profit of 2.45%.
① Summary of Bitcoin Short-term Trade Details: (Leverage*1x)
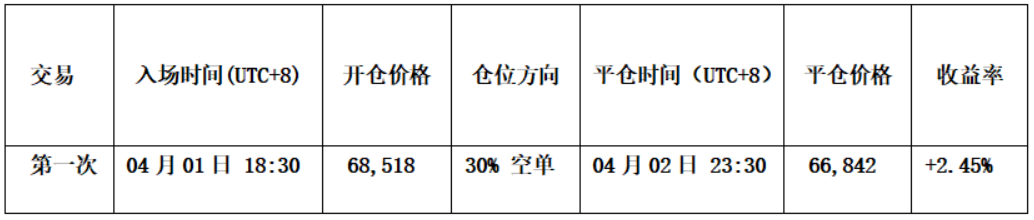
Table 1
② Short-term Trade Review: (See Figure 5)
• Entry: When the price rallied near $72,000 and encountered resistance, the Spread Trading Model simultaneously triggered a top warning signal (white dot), forming a shorting resonance with the Momentum Quantitative Model. Therefore, we established a 30% short position at $68,518.
• Exit: When the price fell near $65,000 and stabilized, and the Spread Trading Model triggered a strong bottom warning signal (red dot + white dot), we closed all positions near $66,842.
• Summary: This trade successfully achieved a profit of approximately 2.45%.
Bitcoin 30-minute Candlestick Chart: (Momentum Quantitative Model + Spread Trading Model)
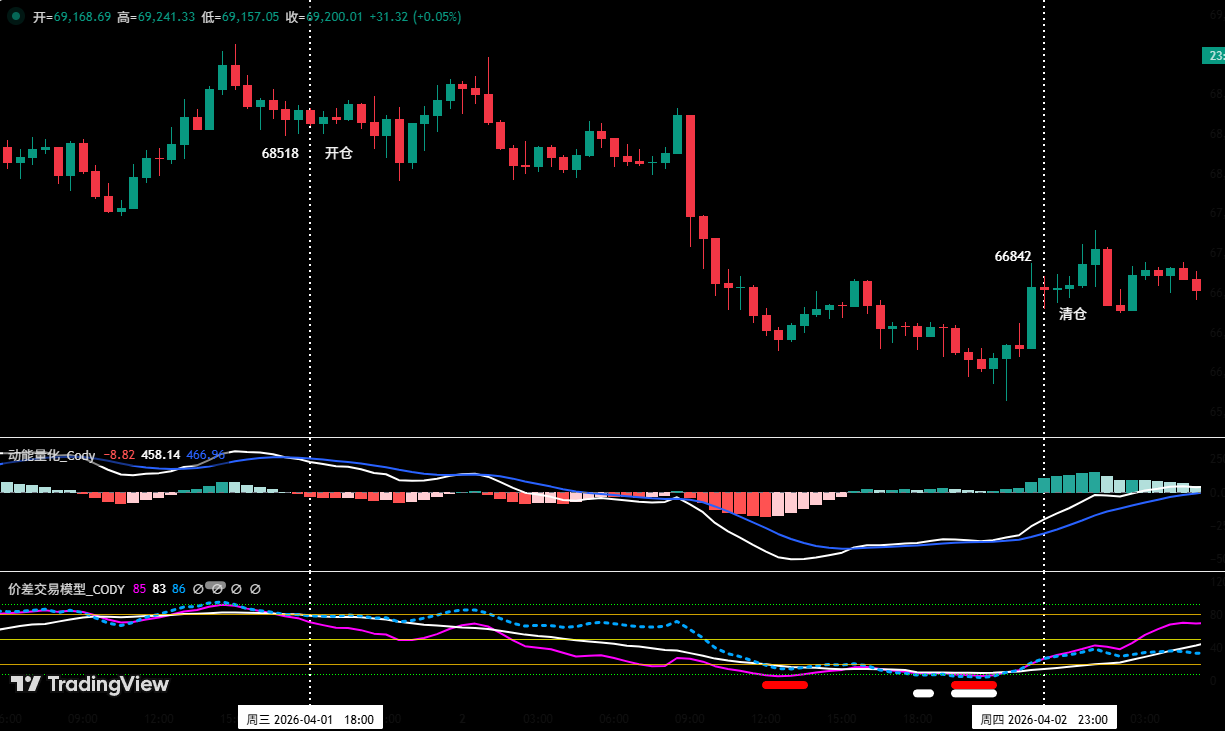
Figure 5 (Short-term Trade Illustration)
2. Medium-term Trade Review:
Medium-term Strategy: Continue holding the 60% short position established near $89,000 (Jan 28). As of last week’s post-market close (closing price ~$69,031), the profit is approximately 22.43%.
VI. Special Notes
1. Upon Entry: Immediately set the initial stop-loss.
2. When Profit Reaches 1%: Move the stop-loss to the entry price (breakeven point) to ensure capital safety.
3. When Profit Reaches 2%: Move the stop-loss to the 1% profit level.
4. Continuous Tracking: Thereafter, for every additional 1% profit, move the stop-loss up by 1% accordingly, dynamically protecting and locking in profits.
Financial markets change rapidly. All market analysis and trading strategies require dynamic adjustment. All views, analytical models, and operational strategies mentioned in this article are derived from personal technical analysis, intended solely as a personal trading log, and do not constitute any investment advice or operational basis. Markets involve risks, investment requires caution. Please do not make decisions based on this.
This article is sourced from the internet: Bitcoin’s Short-Term Volatility Does Not Alter Mid-Term Bearish Trend, HYPE Presents Another Long Opportunity | Invited Analysis
Related: The Most Important Thing in Web3 Primary Market Investment
1. Project Essence: The Changing Value and Judgment of Founders In the Web3 space, the team is the only non-standardized variable and the soul of an early-stage project. Judging founders requires looking beyond their impressive resumes to assess their degree of “crypto-native” understanding, the authenticity of their technical delivery, and their moral bottom line in the face of extreme interests. Since many projects in the primary market are in their infancy, the capabilities, vision, and professional ethics of the founding team are crucial. The ability to judge people has become one of the most important talents and skills for investors in this field. Github Commit Frequency: Don’t just listen to the technical vision in the Pitch Deck. In the AI era, many BPs are even generated with one click by…