“Trillion” Liquidity Release: Can Pre-IPO Equity Tokenization Reshape PE/VC Exit Models?
1. Market Status: Despite global unicorn valuations reaching trillions of dollars, the actual on-chain tokenized market size is only in the range of $100-200 million (if projects with limited free float are excluded, the actual tradable size is merely tens of millions). The market exhibits a strong top-heavy effect, with assets highly concentrated in a few AI tech unicorns like OpenAI and SpaceX. This indicates the industry is still in a very early stage transitioning from “narrative space” to an “effective market,” lacking scaled asset supply and absorption capacity.
2. Diverging Pathways: The industry has formed three distinct pathways, differentiated primarily by the “degree of rights confirmation” and “level of issuer involvement”:
• Synthetic Asset Type (Republic, Ventuals): Includes Perps and debt note types. These do not hold the underlying equity but only provide valuation exposure, using high leverage to meet speculative demand, primarily serving as a traffic funnel.
• SPV Indirect Holding Type (Jarsy, PreStocks, Paimon): Holds shares through offshore SPVs and tokenizes the SPV interests. This is currently the most prevalent implementation form. However, it faces dual compliance pressure from both the target companies and regulators. Recent public warnings from companies like OpenAI have exposed the legal vulnerability of this model regarding violations of “transfer restriction clauses.”
• Native Collaborative Type (Securitize, Centrifuge): Essentially provides TaaS (Tokenization-as-a-Service) to the target companies. Leveraging Transfer Agent licenses, it achieves a legal mapping between on-chain tokens and the shareholder registry, realizing true on-chain equity. Although the implementation cycle is longer, it solves the legal finality dilemma and provides a compliant path for IPO conversion.
3. Trend Analysis: Tokenization does not automatically create liquidity. The current market faces liquidity issues (thin markets, pricing inefficiency). The future breakthrough for the industry lies not in unilateral issuance but in collaboration with target companies:
• Compliance Side: Under pressure from both regulators and corporate legal departments, business models will gradually shift towards compliant collaboration, where service providers offer TaaS infrastructure to issuers.
• Asset Side: Target assets will shift from the crowded top-tier unicorns down to long-tail private companies with more urgent exit needs.
• Infrastructure Side: There is a need to build native RWA trading facilities adapted to the attributes of securities (e.g., compliant AMMs, on-chain order books) to address the lack of depth.
• Ecosystem Side: The future market will evolve towards a multi-layered symbiotic structure rather than a single-model survival-of-the-fittest scenario. The synthetic asset model serves as the traffic entry point and user education tool. The SPV indirect holding model offers greater flexibility for early validation of specific assets. The native collaborative model provides TaaS services and represents the standardized path for future institutional capital onboarding and large-scale asset tokenization.
Keywords: Pre-IPO Equity Tokenization, RWA, SPV Structure, TaaS (Tokenization-as-a-Service), Transfer Agent
Table of Contents
1. Research Scope and Key Definitions
1.1. Research Subject
1.2. Research Premises
2. Market Background: The “Trillion-Dollar Siege” of Private Equity
2.1. Asset Spectrum and Holder Structure
2.2. Scale Characterization: Dual Evidence from Capital Allocation and Asset Valuation
3. Core Contradictions and the Value Path of Tokenization
3.1. Dual Bottlenecks: Restricted Participation and Hindered Exit
3.2. Three Types of Gains: Transfer Channels, Price Discovery, and Financing Supplement
4. Market Status: From Narrative Space to Measurable Scale
4.1. Scale Status: “Tens of Millions” Volume in the Early Validation Phase
4.2. Asset Preference: Concentration in Top Tech Unicorns and AI Assets
5. Implementation Pathways: Structural Differences and Rights Boundaries of Three Models
5.1. Synthetic Asset Type: Value Mapping Detached from Underlying Rights Confirmation
5.2. SPV Indirect Holding Type: The Mainstream Form for Validating Demand First
5.3. Native Collaborative Type: True On-Chain Equity with Transfer Agent at the Core
6. Case Studies: Deconstructing Typical Cases of the Three Models
6.1. Synthetic Asset Type: Introduction of Speculative Traffic
6.2. SPV Indirect Holding Type: Coexistence of Low-Barrier Implementation and High Compliance Controversy
6.3. Native Collaborative Type: Achieving TaaS Service Model Through License Compliance
6.3.1. Securitize Path A: Exodus – A Lifecycle Sample from ATS to NYSE
6.3.2. Securitize Path B: Curzio Research – A Sample of Private Transfer via ATS Without Public Listing
6.3.3. Centrifuge’s Entry: A Directional Signal for the Native TaaS Route
7. Key Challenges: Three Bottlenecks Determining the Industry’s Ceiling
7.1. Compliance Squeeze: Dual Pressure from Regulators and Issuer Legal Departments
7.2. Liquidity Paradox: Tokenization Does Not Automatically Bring Depth
7.3. IPO Finality Connection: The Conversion Issue for Private Companies Going Public
8. Trend Judgment: From Early Validation to Ecosystem Stratification
8.1. Asset Side: Shifting from Top Unicorns to Long-Tail Enterprises
8.2. Liquidity: Native RWA Infrastructure Will Become the Breakthrough Variable
8.3. Collaboration Model: Shifting from Unilateral Issuance to TaaS Service Collaboration
8.4. Ecosystem Endgame: Misaligned Symbiosis and Stratification of the Three Models
9. Conclusion
1. Research Scope and Key Definitions
Private company equity, particularly that of high-growth unicorns, constitutes a significant asset segment in the global economy that cannot be ignored. [1] However, for a long time, its investment access and primary value appreciation have been dominated by professional institutions like PE/VC and a small number of high-net-worth individuals, making it generally inaccessible to ordinary investors. As blockchain technology matures, the “equity tokenization” path is becoming feasible—using on-chain digital tokens to represent equity shares, improving the transfer efficiency of private assets within compliance boundaries. Boston Consulting Group (BCG) estimates that the on-chain RWA market size could reach $16 trillion by 2030. [2] This reflects the market’s high attention to the tokenization direction: on one hand, due to the enormous value of top private companies themselves, and on the other, because tokenization technology is expected to lower barriers and transaction frictions in traditional financial markets.
Based on this background, this article will systematically review the market background and development status of private equity tokenization, analyze the pain points of traditional markets and the mechanism advantages of tokenization, and combine case studies of major platforms, technical and regulatory points, and key challenges to provide insights into future evolution directions.
1.1. Research Subject
This report focuses on the tokenization of underlying equity in private companies (especially unicorns), i.e., the direct tokenization of “issuer company equity,” rather than the tokenization of LP interests in private equity funds (PE Funds) in the traditional sense.
The reason is that discussions on “private equity fund tokenization” typically start from the investment side, using traditional financial frameworks for measurement and analysis, thus easily overlooking larger portions of unicorn equity structures—such as founder holdings and employee stock ownership plans (ESOPs). Such omissions can lead to biased assessments of the “equity tokenization” coverage scope and real liquidity needs, thereby underestimating the market’s actual potential and scalability.
1.2. Research Premises
Time Frame: The research for this article is current as of December 27, 2025.
Data Caliber: Private equity valuations naturally lack a unified official standard. Therefore, market size and tokenized market capitalization are approximated using public statistics and available platform data.
Equity Tradability: Private equity inherently has lock-ups, transfer restrictions, and shareholder registry management requirements, posing practical difficulties for tokenization. Therefore, a distinction is made between “theoretical tokenization (full amount)” and “tradable tokenization (post-restrictions).”
Currency and Exchange Rate Caliber: Involving multi-currency pricing, this article uniformly presents figures in USD. Exchange rate conversions are approximated based on the assumption of USD stablecoin pegs, without separate scenario analysis for extreme de-pegging situations.
Special Products: For synthetic contract products on platforms like Bybit and Hyperliquid, Open Interest is used as a separate metric and is not included in “equity token market capitalization” calculations.
2. Market Background: The “Trillion-Dollar Siege” of Private Equity
2.1 Asset Spectrum and Holder Structure
Broadly defined private equity covers all company shares not listed on public exchanges, with highly diverse types: from early-stage startups to mature large private groups. Holders are not limited to institutional funds and commonly include: founding teams, employee shareholders (equity, option incentives), angel investors, VC/PE, strategic investors, and various secondary transferees.
Table 1: Common Holder Structure of Private Equity
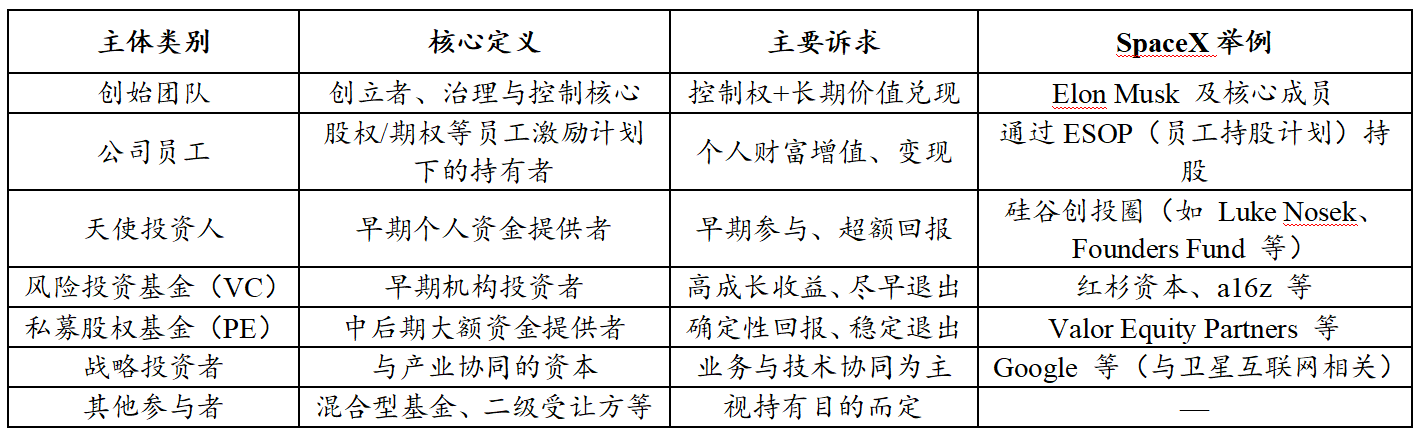
Source: PKUBA Research compilation
As shown in Table 1, apart from strategic investors and some founding teams, other equity holder groups generally have varying degrees of monetization needs: the institutional side emphasizes exit efficiency; employees often need liquid, realizable assets at points of departure or financial planning. However, under traditional mechanisms, aside from a few methods like share repurchases, secondary market equity transfer efficiency is low, making “difficulty exiting” a long-standing structural dilemma.
2.1. Scale Characterization: Dual Evidence from Capital Allocation and Asset Valuation
It must first be emphasized that due to the lack of a unified official standard for private equity scale, this section primarily relies on statistics from mainstream institutions to infer the magnitude from two dimensions: “capital allocation capacity” and “asset valuation size.”
Table 2: Key Indicator Statistics for Global Private Markets and Unicorn Valuations
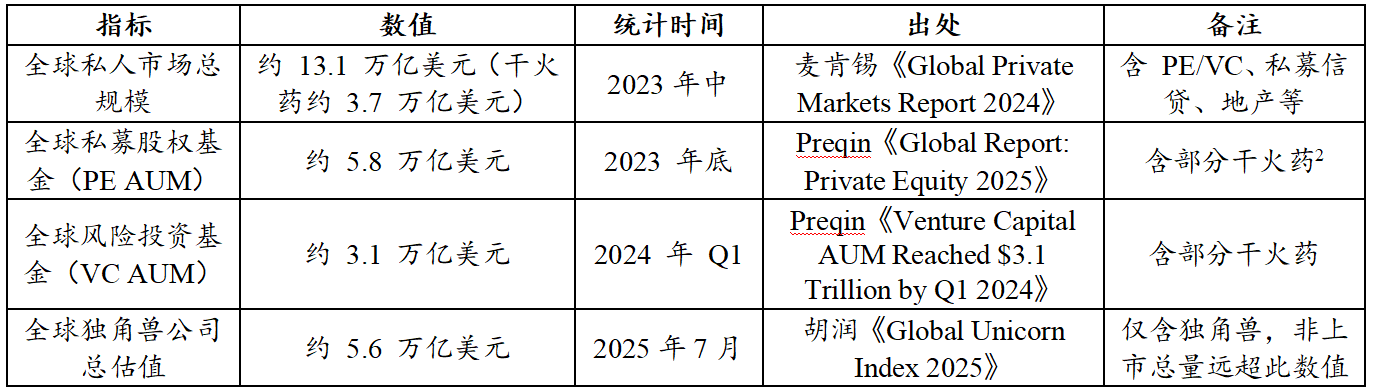
Source: Hurun, McKinsey, Preqin
According to Table 2 data, from a “capital allocation capacity” perspective, the combined assets under management of PE and VC amount to approximately $8.9 trillion ($5.8T + $3.1T), forming a significant capital base for private equity assets;
From an “asset valuation size” perspective, the unicorn group alone reaches a trillion-dollar valuation. According to Hurun Research Institute [3], this figure was $5.6 trillion as of mid-2025. Additionally, CB Insights statistics show that as of July 2025, the cumulative valuation of 1,289 global unicorns exceeded $4.8 trillion. [4] Details of the global Top 10 unicorn valuations and industry descriptions are shown in Table 3.
Table 3: Global Top 10 Unicorn Companies by Valuation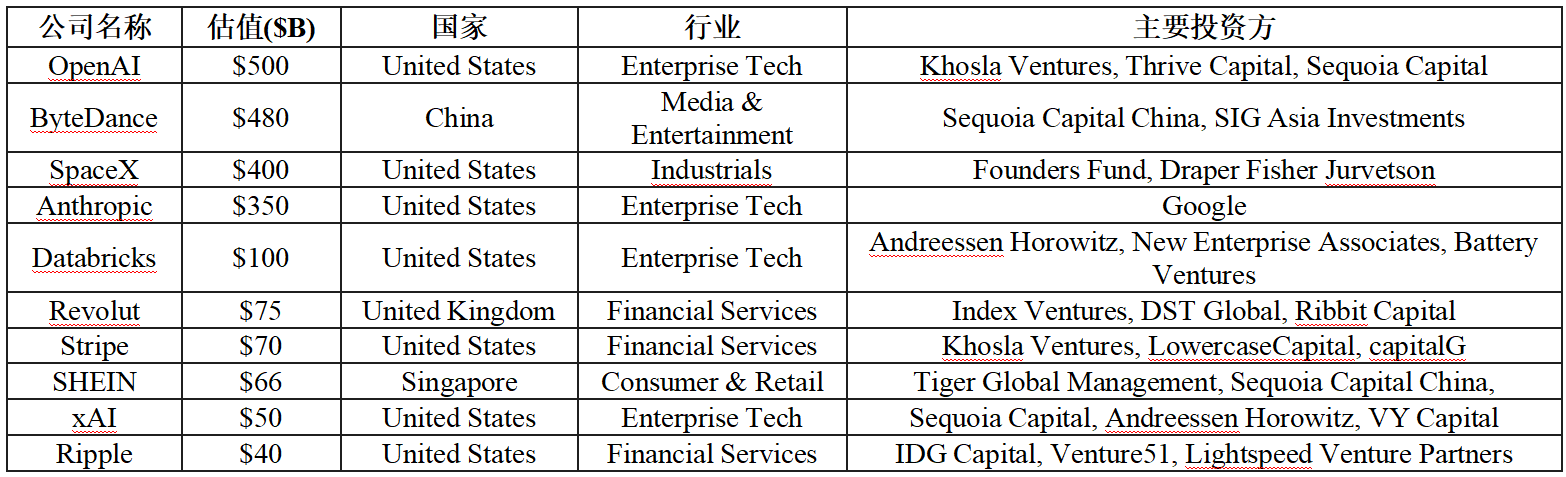
Source: CB Insights (as of December 2025)
It is important to emphasize that whether $4.8 trillion or $5.6 trillion, this only represents the top few thousand leading companies at the pyramid’s peak; the vast value of tens of thousands of mature private enterprises and growth-stage companies worldwide that have not reached unicorn status remains uncounted.
Overall, the actual total value of the global private equity market is a massive “siege” far exceeding several trillion dollars. This enormous yet illiquid asset blue ocean undoubtedly provides an imaginative application prospect for tokenization.
3. Core Contradictions and the Value Path of Tokenization
Private equity has long exhibited a state of high value coexisting with low liquidity, fundamentally due to dual constraints from both institutional and market structures on both the participation and exit sides. On this basis, the potential value of equity tokenization is primarily reflected in three aspects: transfer channels, price discovery, and financing channels.
3.1 Dual Bottlenecks: Restricted Participation and Hindered Exit
The long-standing structural characteristic of private equity—”high value coexisting with low liquidity supply”—stems from dual constraints from both institutional arrangements and market structures on both the participation and exit sides: on one hand, entry rules and capital thresholds limit investor coverage; on the other, exit channels rely on final events and inefficient secondary transfers, making assets difficult to trade.
• Participation Side: High barriers and small-circle compliance constraints. In most jurisdictions, private equity transactions are typically strictly limited to accredited or institutional investors; simultaneously, minimum investment amounts often range from hundreds of thousands to millions of dollars, coupled with net worth, income, and other qualification requirements, creating significant institutional and financial barriers. This leads to highly concentrated asset benefits and limited breadth of market capital supply.
• Exit Side: Scarce exits and prolonged cycles. Traditional exits heavily rely on final events like IPOs or M&A, but the trend of “unicorns delaying listings” significantly extends holding periods, making paper wealth difficult to realize promptly. Even through private secondary market transfers, transactions often rely on offline matching, commonly suffering from issues like information opacity, high due diligence and settlement friction, high costs, and slow settlement, resulting in inefficient and unstable liquidity supply.
3.2 Three Types of Gains: Transfer Channels, Price Discovery, and Financing Supplement
Compared to “listed stock tokenization,” which primarily improves trading time and channel convenience, private equity tokenization is more akin to a redesign of the private market structure, mainly reflected in three core gains:
First, regarding transfer channels: Tokenization reduces the “siege” dilemma through continuous secondary liquidity, constructing a two-way channel for both participation and exit.
For the participation-side dilemma, the potential gain of tokenization mainly lies in expanding access through divisibility: by splitting equity interests or economic beneficial rights into finer granularity, it lowers the single-entry threshold within a compliant framework, allowing more accredited investors access to growth-stage target exposure previously difficult to allocate, thereby alleviating the structural constraint of “difficulty participating” in private markets.
For the exit-side dilemma, the core gain of tokenization lies in supplementing liquidity exits: for employees, early investors, and institutional funds, it provides a more continuous transfer channel beyond IPO/M&A/repurchase, expanding liquidity options and reaching a broader pool of potential buyers
This article is sourced from the internet: “Trillion” Liquidity Release: Can Pre-IPO Equity Tokenization Reshape PE/VC Exit Models?
Related: 2025: The darkest year for the crypto market, but also the dawn of the institutional era.
This is a fundamental shift in market structure, yet most people are still viewing the new era through the lens of the old cycle. A 2025 recap of the crypto market reveals a paradigm shift from retail speculation to institutional allocation. Core data shows institutional holdings at 24%, while retail investors exited by 66%—the crypto market saw a complete turnover in 2025. Forget the four-year cycle; the institutional era brings new rules to the crypto market! Let me use data and logic to dissect the truth behind this “worst year.” 1/ Let’s look at the surface data first—asset performance in 2025: Traditional assets: Silver +130% Gold +66% – Copper +34% Nasdaq +20.7% – S&P 500 +16.2% Crypto assets: -BTC -5.4% – ETH -12% – Mainstream counterfeit products -35% to -60%…