
The Polygon (MATIC) price may be potentially ending its correction phase and may be poised for a new upward movement.
Currently, MATIC is encountering a significant Fibonacci resistance level. If Polygon manages to break through this resistance, it could signal the potential for further price gains.
Polygon Eyes Breakthrough: Can It Surpass $0.821, the 0.382 Fib Level?
The Polygon (MATIC) price has experienced a significant increase over the past five days, bringing it to the 0.382 Fibonacci resistance level at approximately $0.821.
If MATIC manages to break through this resistance, its next potential target could be the golden ratio level around $0.89. A successful break above this level could indicate the end of the corrective movement and open the path for MATIC to target or even surpass its previous high at approximately $0.98.
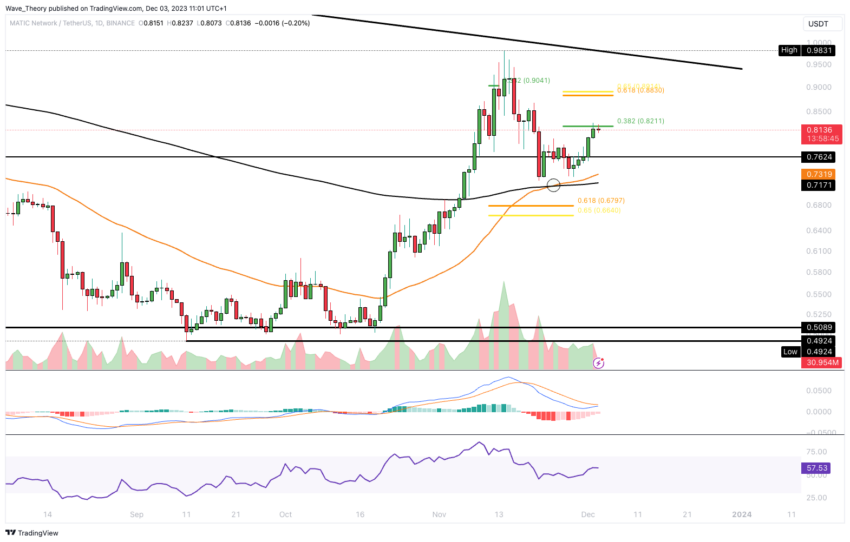
Furthermore, in the daily chart, the MACD (Moving Average Convergence Divergence) lines are on the verge of forming a bullish crossover. The MACD histogram has been trending higher in a bullish manner for several days, and the RSI (Relative Strength Index) is currently in neutral territory.
Additionally, the EMAs (Exponential Moving Averages) have formed a golden crossover, confirming the short to medium-term bullish trend.
4H Chart Analysis: Mixed Signals Emerge From Key Indicators
In the 4-hour chart, Polygon (MATIC) has also experienced a golden crossover of the Exponential Moving Averages (EMAs), confirming a bullish trend in the short term. However, it’s important to note that the Relative Strength Index (RSI) is approaching overbought regions, and the MACD histogram is showing signs of ticking lower in a bearish manner.
These indicators suggest that the MACD lines could potentially cross in a bearish manner, indicating the possibility of a bearish rejection at the 0.382 Fibonacci resistance level around $0.821.
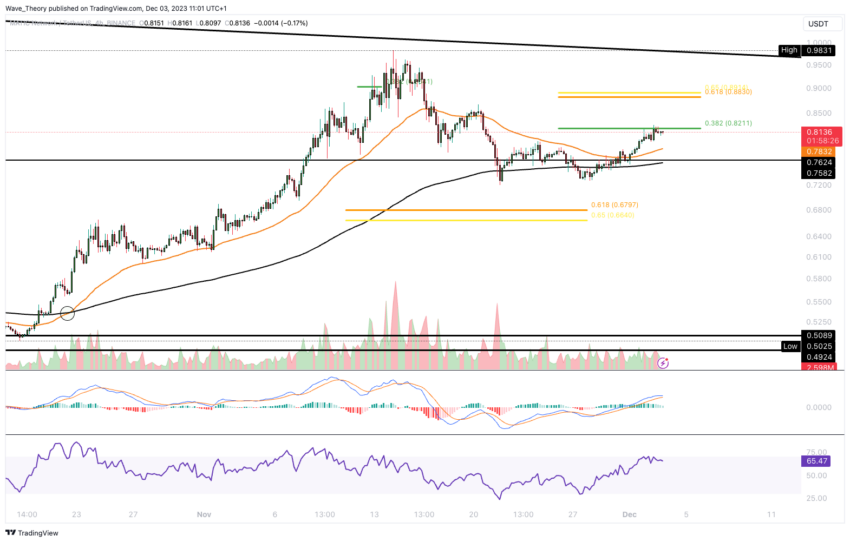
If such a rejection occurs, Polygon’s price could undergo a correction, finding support at the horizontal level around $0.7624, where a bullish rebound might be expected.
Weekly Chart Update: MACD Histogram Indicates Bearish Trend
In the weekly analysis, the indicators present a range of signals. The medium-term trend continues to be affirmed as bullish, evidenced by the ‘golden crossover’ of the Exponential Moving Averages (EMAs).
Additionally, the Moving Average Convergence Divergence (MACD) lines have crossed in a manner that supports a bullish outlook. However, the Relative Strength Index (RSI) is currently positioned in a neutral zone. It is noteworthy that the MACD histogram has shown a bearish decline since the previous week.
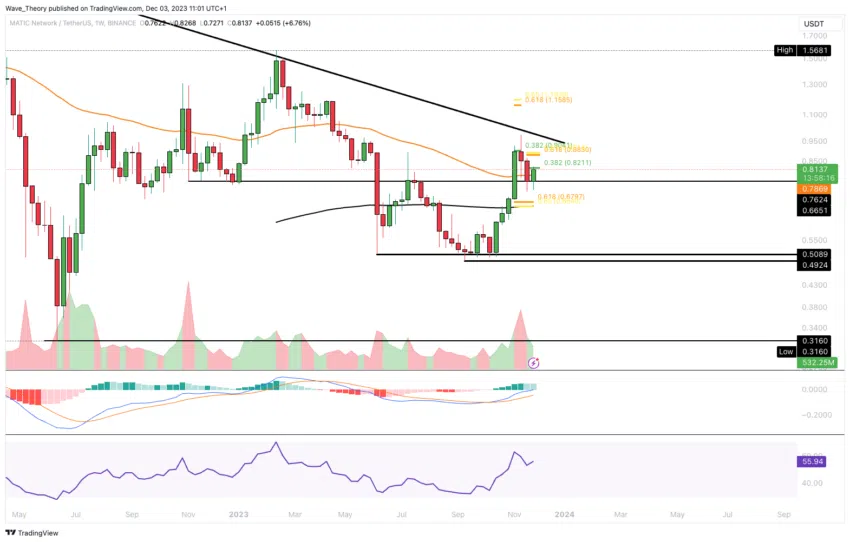
The bullish trajectory for MATIC’s price is considered secure if it remains above the critical ‘golden ratio’ level, approximately at $0.67. Consequently, MATIC maintains a bullish stance for the medium term.
Monthly Chart Insight: MACD Histogram Shows Bullish Uptick for Third Consecutive Month
From the monthly perspective, the Moving Average Convergence Divergence (MACD) histogram has been indicating a bullish trend, with a steady increase since October. However, the MACD lines continue to be crossed in a bearish pattern, and the Relative Strength Index (RSI) remains in a neutral zone.
Despite these mixed signals, Polygon (MATIC) has exhibited bullish movement for the third consecutive month. This consistent upward trajectory could potentially signal the beginning of a bullish trend reversal.
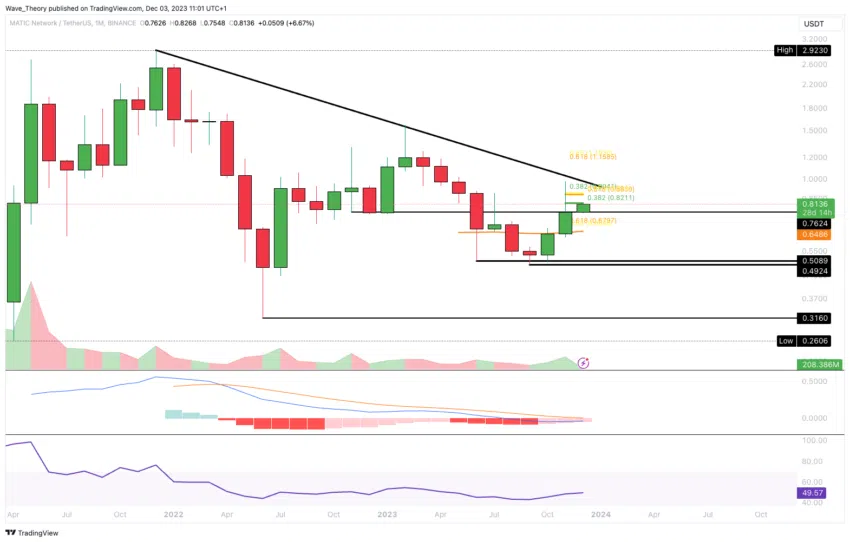
To solidify this trend reversal, Polygon must overcome two critical thresholds. Firstly, it must surpass the bearish trend line, which is currently situated at approximately $0.975.
Following this, Polygon must then breach the ‘golden ratio’ resistance level, which stands around $1.2. Achieving these milestones would further validate the emergence of a bullish trend.
Polygon’s Price Stability Against Bitcoin: Maintaining Support at 0.0000203 BTC
In its trading against Bitcoin (BTC), Polygon (MATIC) has recently breached the golden ratio support level, positioned at approximately 0.0000213 BTC, in a bearish movement. However, Polygon has since discovered notable support at around 0.0000203 BTC.
Currently, the price of Polygon appears to be experiencing a bullish rebound from this level of support. The next significant level of resistance lies at the 200-week Exponential Moving Average (EMA), which is located around 0.0000216 BTC.
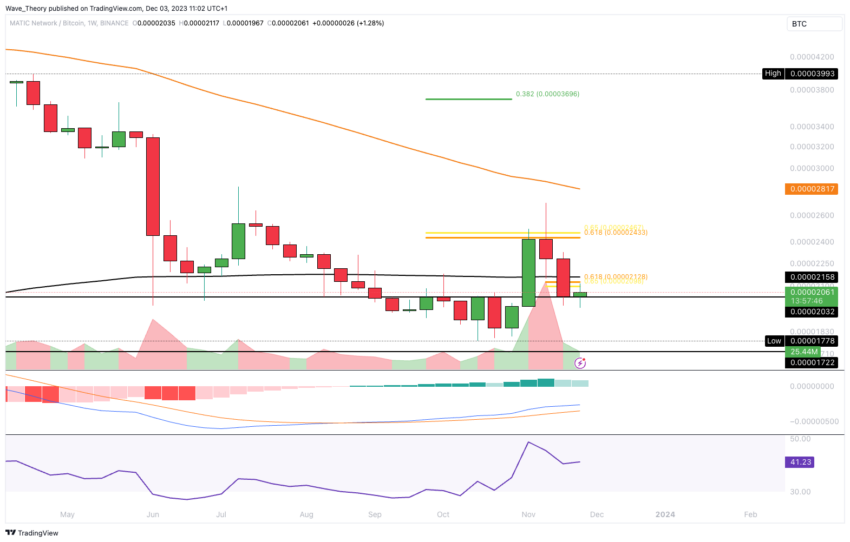
Additionally, the weekly chart reveals that the Moving Average Convergence Divergence (MACD) lines for Polygon remain crossed in a bullish pattern.
However, it is important to note that the MACD histogram has shown a bearish decline since last week. The Relative Strength Index (RSI) currently displays a neutral stance, providing neither bullish nor bearish indications at this juncture.