
The Ethereum price is currently undergoing a notable corrective movement, having corrected to approximately $2,845 in recent days
A month ago, BeInCrypto suggested that significant support levels were around $3,215 at the 50-day EMA and between $3,107 and $3,215 at key Fibonacci levels. This range presented a favorable opportunity for Ethereum to experience a bullish rebound.
ETH Finds Support: Price Stabilizes at 0.382 Fib Level, Around $3,107
In the monthly chart, Ethereum’s price remains positioned near the 0.382 Fibonacci support level. A potential bullish scenario entails a monthly close above this level, signaling positive momentum for the cryptocurrency. However, failure to maintain this support could lead to further downsides, with significant Fibonacci support of around $2,500.
Despite the ongoing corrective movement, the Moving Average Convergence Divergence (MACD) lines retain a bullish crossover while the Relative Strength Index (RSI) hovers in neutral territory.
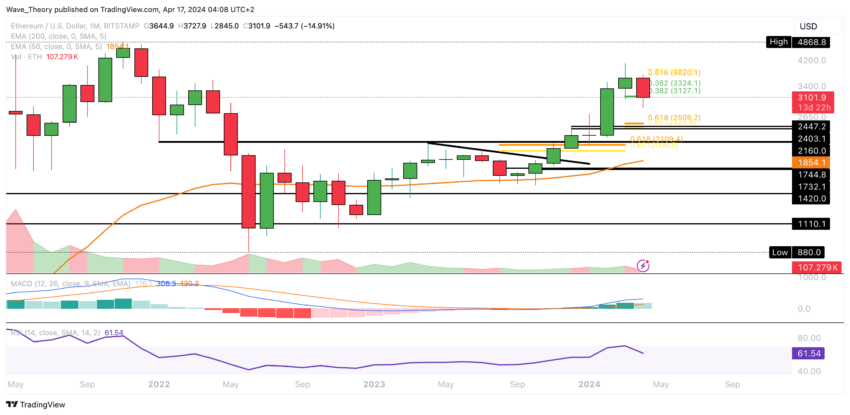
Nonetheless, the MACD histogram shows early signs of a bearish downturn. Amidst a monthly decline of approximately 24%, Ethereum has retraced nearly 31% from its recent peak of around $4,095.
Read More: How to Buy Ethereum (ETH) and Everything You Need to Know
Is a Bullish Rebound in Store for Ethereum?
Last week, Ethereum managed to maintain its position above the 0.382 Fibonacci support level, holding steady at around $3,107. This trend has persisted into the current week.
However, caution is warranted as the MACD lines on the weekly chart are on the verge of forming a bearish crossover. The MACD histogram has also exhibited a bearish trend over the past few weeks.
Meanwhile, the RSI remains neutral, offering no clear direction. If Ethereum breaks below the current support, the 50-week Exponential Moving Average (EMA) at around $2,442 is poised to provide additional support.
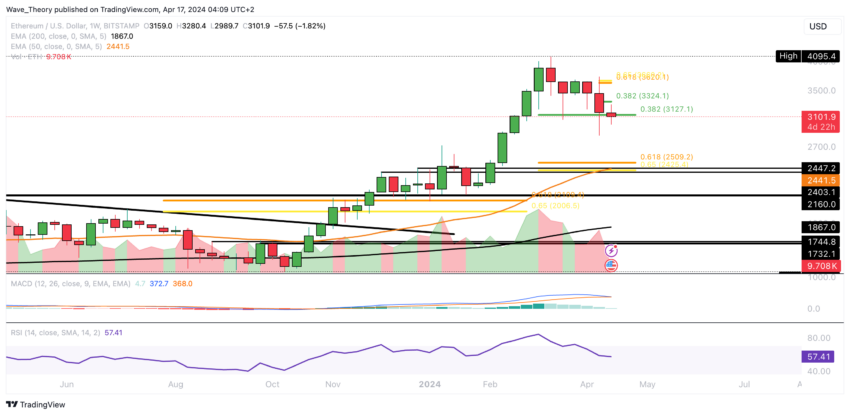
Furthermore, the 50-week EMA at the Golden Ratio is another layer of support. Despite these potential bearish signals, it’s worth noting that the EMAs still exhibit a golden crossover, indicating a bullish trend in the medium term.
Ethereum Remains in a Downward Channel
In the daily chart, Ethereum is currently within a parallel descending channel. If ETH decides to move upwards, it will encounter significant resistance at the 50-day EMA, which aligns with the 0.382 Fibonacci level around $3,324.
Alternatively, should ETH continue its upward momentum, it will face substantial resistance at the channel’s upper boundary, near $3,650, corresponding to the golden ratio.
The indicators present mixed signals on the daily chart. While the EMAs display a golden crossover, signaling a bullish trend in the short to medium term, the MACD lines have crossed bearishly.
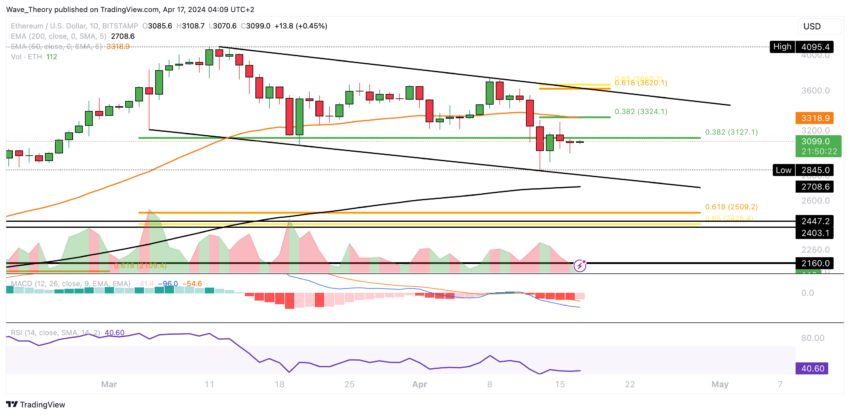
However, the MACD histogram has started to show bullish momentum today. The RSI remains indecisive, providing no clear signals at the moment.
Death Cross Signals Potential Downturn on 4H Chart
In the 4-hour chart, Ethereum exhibits a bullish sentiment as indicated by the MACD lines, which are crossed upwards, and the MACD histogram, which shows a bullish trend. Concurrently, the RSI is situated in neutral territory.
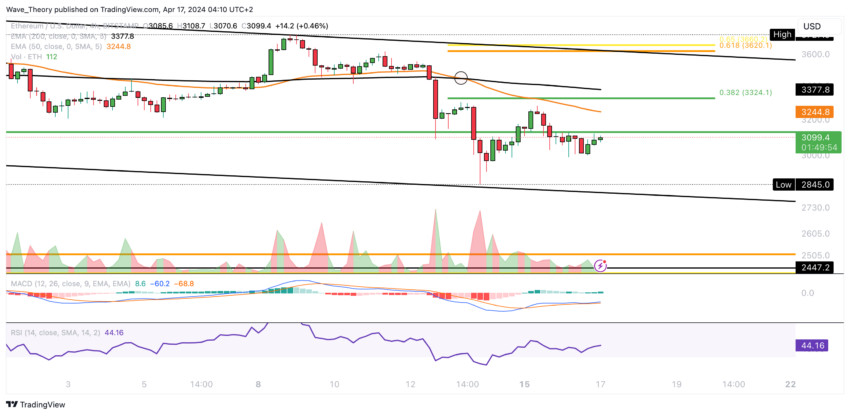
Nevertheless, the EMAs’ death cross formation suggests a short-term bearish trend.
ETH vs. BTC: Ethereum Tests Resistance at 50-4H EMA, Near 0.049 BTC
Compared to Bitcoin, Ethereum’s price is experiencing a downward trend, with significant support found near 0.043 BTC. Conversely, resistance is prominent at the 50-4H Exponential Moving Average, currently around 0.049 BTC, where the price faces rejection.
阅读更多:以太坊 (ETH) 价格预测 2024/2025/2030
The MACD histogram indicates a bearish trend with a downward tick, while the MACD lines are poised for a bearish crossover. Additionally, the Death Cross formed by the Exponential Moving Averages further confirms the short-term bearish trend.
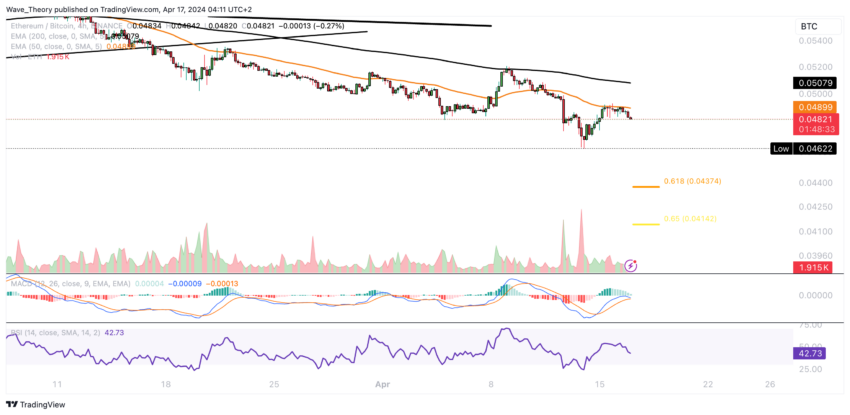
Given these indicators, Ethereum’s performance against Bitcoin suggests a potential return to the golden ratio support at approximately 0.043 BTC in the short to medium term.