Original compilation: Saoirse, Foresight News
Bitcoin trades 24/7, but CME Bitcoin futures close on weekends. This time mismatch creates the CME gap, which often appears during periods of significant market stress.
The CME gap refers to the blank interval on the CME futures chart formed between Friday’s closing price and the first transaction price when the market reopens on Sunday evening (US time). CME futures trade weekly and are closed on weekends, while Bitcoin spot prices continue to fluctuate. When the opening price differs significantly from Friday’s close, a gap appears on the chart, with the blank area in between being the gap.
Previous reports from CryptoSlate have clarified: the gap is not a mysterious force; it’s merely a record of time where one market is closed while another is still trading. It’s not a prophecy, just a trading time mismatch reflected on the chart.
The recent market volatility serves as a clear real-world example.
On the CME Bitcoin continuous futures chart, the closing price on January 30 (Friday) was approximately $84,105, while the Sunday opening was around $77,730, leaving a weekend gap of about $6,375. The decline subsequently accelerated.
Opening on February 5, Bitcoin fell from around $72,999, hitting a low of $62,181 on Coinbase. In early trading on February 6, it briefly approached $60,000 before rebounding to the mid-$60,000s. The 30-minute CME chart showed a similar pattern, dropping to a low near $60,005 before rebounding to around $66,900.
Despite such intense volatility, the previous Friday’s price above $80,000 remained far above. As of February 6, this gap remained open because the price never returned to that zone.
This is crucial because it answers the question most non-traders really want to ask when they hear “gap”: Why does the price of Bitcoin sometimes seem to exist in two completely different worlds, and why does this misalignment often disappear within a week?
How the Gap Forms When One Bitcoin 市場 Closes for the Weekend
CME’s cash-settled Bitcoin futures trade from Sunday evening to Friday afternoon, with brief daily pauses and a complete weekend closure. However, Bitcoin spot trading has no such pause mechanism. Therefore, if significant volatility occurs on Saturday, CME cannot record it in real-time, leaving a blank period on its chart.
When CME reopens, trading does not resume from Friday’s closing price but starts directly at the prevailing market price at the time of opening. If the spot price fell 8% or rose 6% during the closure, the first futures transaction will reflect this change, plus any futures premium or discount at the open. The final result is a noticeable gap on the chart; the blank space between Friday’s close and Sunday’s open is the gap.
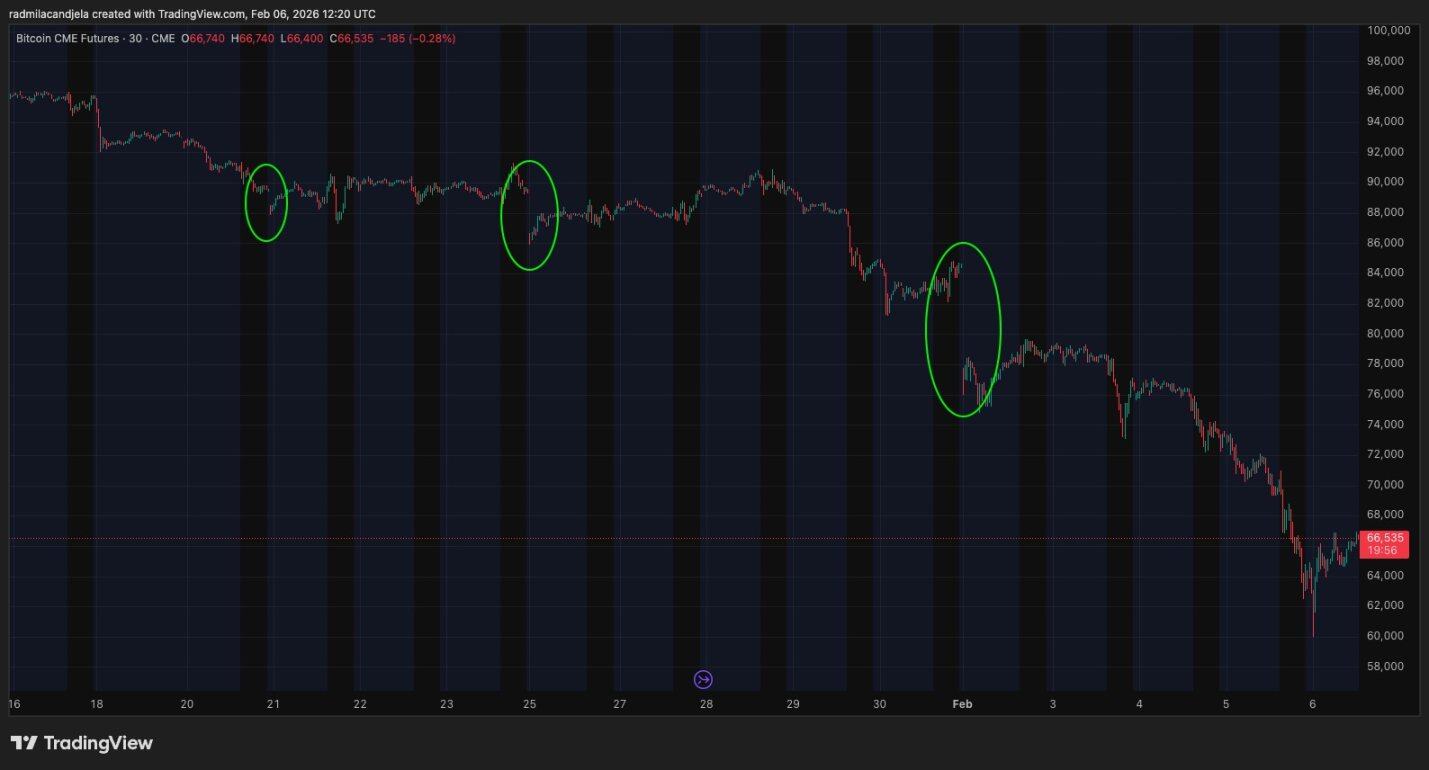
Chart of CME Bitcoin Futures from January 15 to February 6, 2026 (Source: TradingView)
What truly matters is the subsequent price action: the existence of a gap is merely a “calendar fact,” while the filling of the gap is a “market behavior.”
You can think of a gap as skipped pages in a book. Friday ends on a cliffhanger, three new chapters are written elsewhere over the weekend, and CME returns to a brand new chapter. The skipped pages are still missing from the CME chart, but the story in the spot market has already moved on.
This is also why the “gap meme” seems so persuasive during such market moves:
- When the market is calm, the opening price is close to Friday’s close, leaving no conspicuous gap.
- During volatile periods, the blank interval is large, and the human brain instinctively treats it as “unfinished business.”
Misconceptions vs. Reality:
- Misconception: CME gaps must be filled.
- Reality: Gaps are often filled because markets tend to converge after CME liquidity returns, but there is no rule that they *must* be filled. In trending markets, gaps can remain open for extended periods.
Why Gaps Are Often Filled, and How Last Week Revealed Their Limits
So-called “filling the gap” means the price later retraces that blank interval, often returning to the previous CME closing price.
As CryptoSlate previously explained: This happens frequently because, after CME trading resumes, there is a practical force driving futures and spot prices closer together.
This convergence stems from a series of simple, repeatable logics:
If the spread between futures and spot becomes too large, an arbitrage opportunity exists. Institutions with access to both markets can buy low and sell high, profiting from the narrowing spread.
This is a convergence process driven by arbitrage and relative value positions, not a belief that Bitcoin must rise or fall. Even non-traders can understand: two correlated markets, once liquidity returns and risk controls are active, rarely tolerate a large price discrepancy for long.
Additionally, there’s the attention effect. Gaps are now widely tracked and discussed, receiving extra focus during price swings. When many traders watch the same price level, liquidity congregates there, making it easier for the price to return to that zone, especially in choppy, mean-reverting markets.
Previous CryptoSlate research data also supports this: the gap fill rate is high, and many gaps are filled quickly after CME trading resumes. This explains why the myth of “gaps must be filled” persists — there are enough historical cases to make it seem like an ironclad rule, even though it isn’t.
The significance of the February 5-6 price action lies precisely in how it demonstrated the boundary of this “rule.”
Bitcoin plunged sharply, touched $60,000, and then rebounded quickly, triggering over $1 billion in liquidations within 24 hours.
In such an environment, the importance of the CME gap diminished significantly.
When the market is in a concentrated sell-off and forced deleveraging, the price doesn’t care about the missing candlesticks on last week’s CME chart; it only cares where the real buying interest is at the moment.
Coinbase and CME synchronized in dropping to just above $60,000 before rebounding to the mid-$60,000s. The previous Friday’s closing price near $84,105 was no longer a “gravitational point” for the price but more like a distant marker.
This also illustrates: an open gap is better suited for *explaining* price action than *predicting* it.
- When the market is calm, gaps are easily filled quickly because the price itself is oscillating, and liquidity is willing to return to previous price levels.
- When the market is under pressure, an open gap simply serves as a reminder: the price has moved too far to easily return to the previous closing level in the short term. This isn’t the theory failing; it’s the theory working normally — it shows the result of the weekend move that hasn’t been retraced.
Reports on February 6 regarding corporate Bitcoin holdings pushed this beyond mere chart culture.
CryptoSlate reported that Bitcoin’s drop to $60,000 further widened paper losses for corporate holders, putting significant pressure on companies whose stock price logic revolves around Bitcoin exposure.
This made this decline particularly distinct: it wasn’t confined within the 加密貨幣 market but spilled over into balance sheets and public narratives.
In such a market, the price won’t return to Friday’s closing level just because a gap exists.
Think of the CME gap as a price level traders will watch, not a target Bitcoin “should” reach.
Gaps are most effective when markets are mean-reverting and liquidity is willing to return to old prices.
During liquidation waves and trending markets, gaps can remain open for a long time because the market is dealing with matters more important than “chart symmetry.”
本文源自網路: CME Gaps: A Misunderstood Market “Clock,” Not a Prophecy
Related: Global Asset Rotation: Why Liquidity Drives Cryptocurrency Cycles (Part 1)
Introduction: Starting with Capital, Not Stories Whether it’s RWA, X402, or any other concept, these topics are usually just triggers, not the real driving force. They attract attention, but they don’t provide energy on their own. The real driving force comes from capital. When liquidity is abundant, even weak arguments can be amplified into market consensus. Conversely, when liquidity dries up, even the strongest arguments struggle to maintain momentum. The first part focuses on building the foundation: how to construct a global asset allocation and rotation framework that places cryptocurrencies within the appropriate macroeconomic context. The latter part of the framework will be elaborated in subsequent articles. Step 1: Step outside the cryptocurrency space and map the global asset landscape. The first step is to deliberately step outside the cryptocurrency…