Are prediction markets a cash cow? A deep dive into their profit models
In the past, discussions about prediction markets focused on accuracy, trading volume, and whether they could become a new information market. However, when a prediction market operates as a business, the core question changes: What is its profit model?
In the commercial world, high trading volume does not equate to a platform making money. A market can generate significant buzz, and users can trade frequently, but if the majority of transactions cannot be monetized through fees, or if activity relies purely on subsidies and points, then volume is just a vanity metric, not healthy revenue.
For prediction markets, the true test of business acumen is not “how many markets were opened” or “how popular a certain event is,” but whether the platform can seamlessly connect three things:
- Generating the impulse for real transactions;
- Maintaining sufficient order book liquidity;
- Converting Taker trading demand into fees.
This is why the business model of a prediction market is far from simply “taxing every market.” On the surface, it’s just a series of YES/NO betting games, but the real foundation of a platform’s revenue is its underlying trading structure, liquidity mechanisms, fee structures, and user behavior.
Especially after leading platforms like Polymarket systematically introduced Taker Fees, the narrative around prediction markets has shifted from “information tool” to “revenue validation.”
This article will deeply analyze the fundamentals of prediction markets from a commercial perspective:
- How do prediction market platforms make money?
- Why does the Maker/Taker fee structure determine a platform’s success or failure?
- What are the essential differences in fee designs among major platforms like @Polymarket, Kalshi, @opinionlabsxyz, and @predictdotfun?
- Why aren’t the highest-volume verticals the most profitable?
💡 Core Conclusion: Prediction markets don’t sell answers; they sell disagreement.
The closer a price is to 50/50, the greater the market disagreement, the stronger the trading impulse, and the easier it is for the platform to generate fee revenue from aggressive trades. The closer a price is to 0 or 100, the more certain the outcome, and although the informational value remains, the fee contribution decreases significantly.
Therefore, the real business moat of a prediction market is not turning “events” into markets, but turning “disagreement” into trading, and then robustly converting trading into revenue.
1. How Prediction سوقs Make Money: Not Opening سوقs, But Converting Disagreement into Fees
To understand a prediction market’s cash flow, we must first identify the four core drivers of its revenue, which are intertwined and form a closed loop from traffic to monetization.
1️⃣ Trading Fees – Direct Revenue Source
Most prediction markets charge fees on aggressive trades (Taker). This is because Takers consume liquidity, while Makers provide it.
This means not all trades generate revenue for the platform. The trades that contribute to fees are typically those where users are willing to pay for speed and certainty.
2️⃣ Liquidity – The Foundation for Sustainable Trading
The hardest part for a prediction market isn’t opening a market; it’s ensuring the market has depth.
If a market has no orders on the book, users can’t buy or sell effectively, preventing effective price discovery even if the topic is popular.
Therefore, many platforms reduce costs for Makers or even provide Maker incentives.
This isn’t a direct “revenue source,” but it determines whether trading fees can exist long-term. Without liquidity, there is no sustainable trading, and fee revenue naturally becomes unstable.
3️⃣ Informational Value – Capturing Mindshare
Prediction markets differ from regular trading platforms because they are not just trading tools; they also generate information.
When a market has sufficient volume and liquidity, its price becomes a probabilistic signal. Media outlets cite it, KOLs interpret it, traders observe it, and average users use it to gauge market sentiment.
This may not directly translate into fees, but it brings attention, mindshare, and external virality to the platform. Long-term, this informational value will, in turn, enhance trading demand.
4️⃣ User Operations and Discount Systems – Converting Activity into Revenue
Beyond basic trading fees, platforms use discounts, referral programs, events, points, and rebates to increase trading frequency. These measures don’t directly generate revenue but affect the platform’s long-term monetization potential. For example, Opinion offers user discounts, transaction discounts, and referral discounts; Predict.fun uses simpler base fees and discount mechanisms; Polymarket focuses on differentiated fees by vertical and Maker rebates. The core of discounts and incentives is not mere subsidy, but exchanging some profit for user retention and gradually converting activity into revenue.
2. Cross-Platform Fee Structure Comparison for Leading Prediction Markets
Looking at the fee designs of several leading prediction markets, the industry’s strategic direction is highly aligned: encourage limit orders to provide liquidity and convert aggressive trading into revenue. However, execution strategies diverge significantly based on each platform’s positioning.
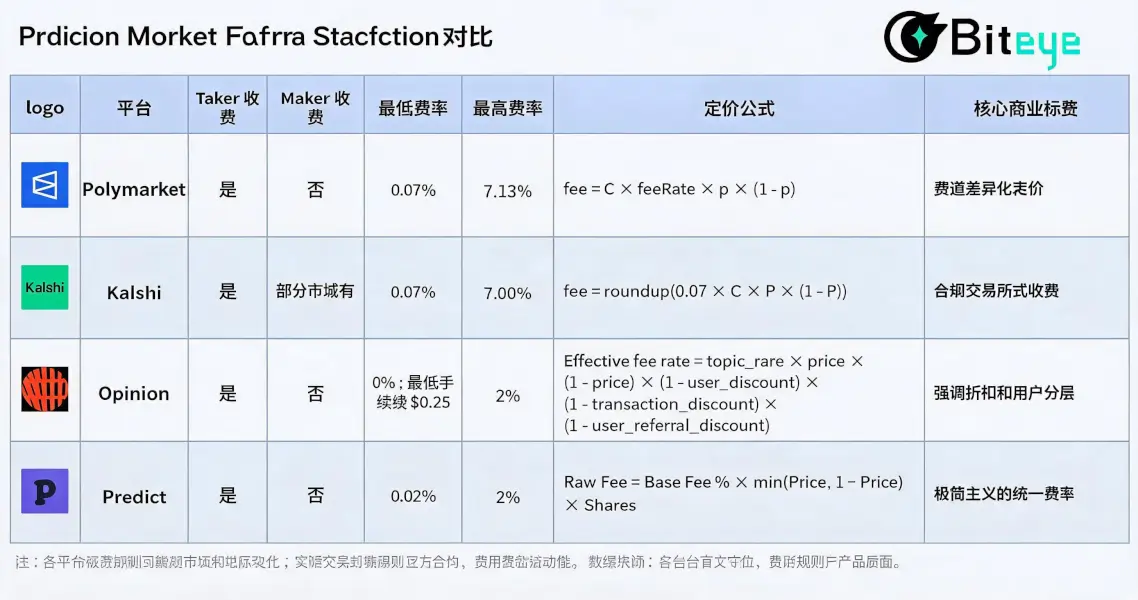
1️⃣ Polymarket: Precision Pricing by Vertical
Polymarket’s Taker fee logic combines “vertical differentiation” and “disagreement-based pricing” to an extreme. Its official core formula is:
fee = C × feeRate × p × (1 – p)
Where C is the number of shares traded, p is the transaction price, and feeRate is determined by the market’s vertical.
This mechanism includes two core variables:
- Vertical Precision: Based on current validated fee rates, the feeRate for the Crypto vertical is 0.07, Sports is 0.03, Politics/Finance/Tech is 0.04, Culture/Weather is 0.05, and some Geopolitics markets are 0. This means Polymarket does not charge uniformly across all markets but uses differentiated rates based on trading frequency, sensitivity, and user willingness to pay in each vertical.
- Disagreement-Based Pricing: This perfectly fits the mathematical curve p × (1 – p). The closer the price is to 50/50 (maximum disagreement), the higher the fee; the more certain the outcome (close to 0 or 1), the lower the fee.
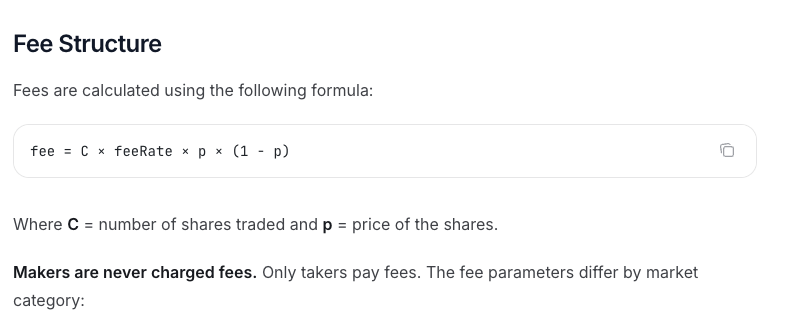
https://docs.polymarket.com/trading/fees
2️⃣ Kalshi: Closer to a Regulated تبادل Model
Kalshi’s fee design, under a compliance framework, is closer to traditional financial derivatives exchanges. Its standard Taker fee formula is also linked to price disagreement:
fee = round up(0.07 × C × P × (1 – P))
Where C is the number of contracts and P is the contract price. The fee is rounded up to the nearest cent. This structure is similar to Polymarket’s C × feeRate × p × (1-p).
Kalshi’s fee structure shares similarities with Polymarket: the trading fee depends on the contract price. The closer it is to 50¢, the higher the fee; the closer to 1¢/99¢, the lower. Kalshi’s fee schedule shows that a taker fee for 100 contracts varies roughly between $0.07 and $1.75.
However, a key difference is that some Kalshi markets also have Maker fees, charged only when these limit orders are ultimately filled (cancellations are free). This suggests Kalshi’s fee structure aligns more with regulated exchanges, featuring more complex bilateral fee rules across different markets, rather than a simple permanent Maker free policy.
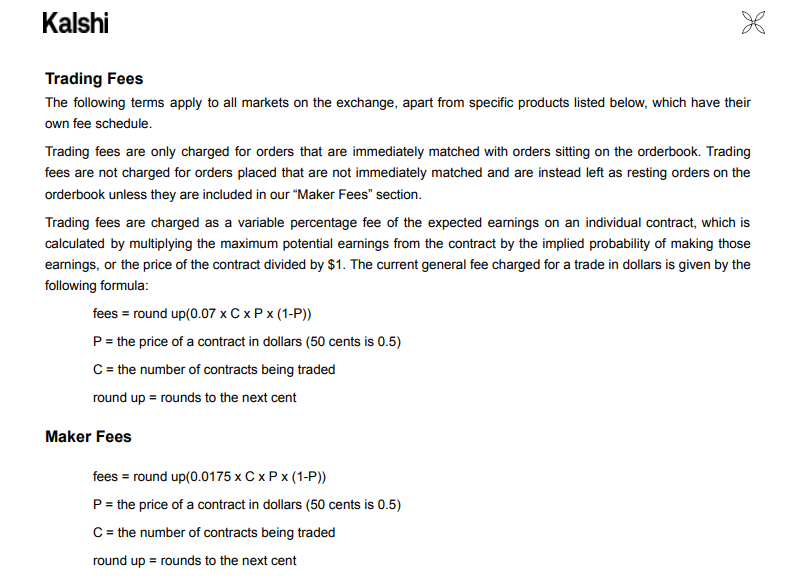
https://kalshi.com/docs/kalshi-fee-schedule.pdf
3️⃣ Opinion: Emphasizing Discounts and User Tiers
Opinion introduces a highly complex “multi-dimensional discount system.” Its effective fee rate formula is:
Effective fee rate = topic_rate × price × (1 − price)× (1 − user_discount)× (1 − transaction_discount)× (1 − user_referral_discount)
This means Opinion’s fee depends not only on market price and topic_rate but is also influenced by user discounts, transaction discounts, referral discounts, etc.
Opinion also sets a $5 minimum order and a $0.25 minimum fee to prevent negligible fees from small transactions.
This shows Opinion’s fee design leans more towards user operations:
- topic_rate differentiates markets
- user_discount creates user tiers
Therefore, compared to Polymarket’s “vertical differentiation pricing,” Opinion treats the fee structure more like an operational tool: on one hand, using a discount system to مرشد trading, retention, and user acquisition; on the other, keeping Maker free to lower the barrier for limit orders and maintain market liquidity.
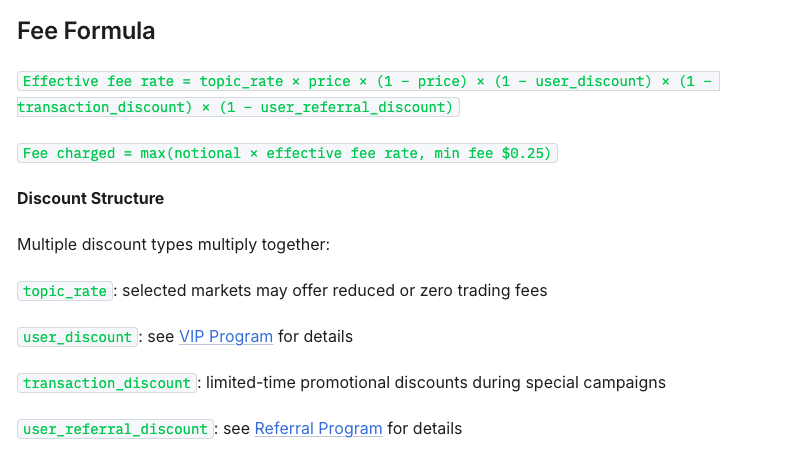
https://docs.opinion.trade/trade-on-opinion.trade/fees
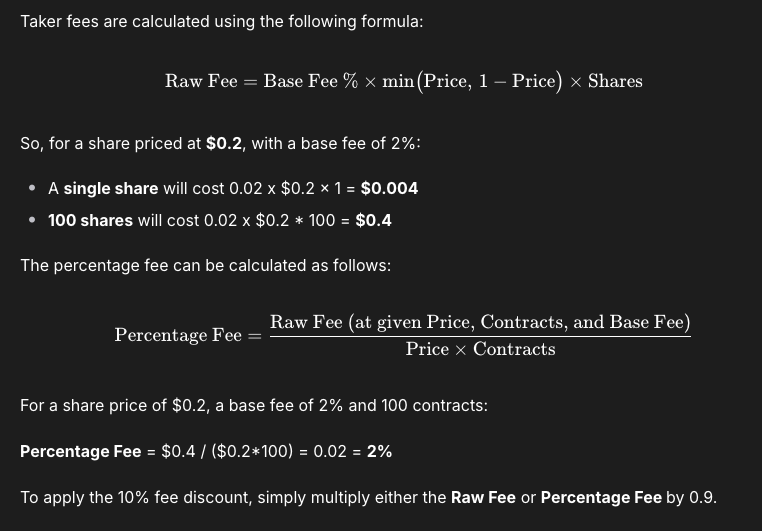
4️⃣ Predict.fun: Minimalist Unified Fee Rate
Predict.fun’s fee structure is relatively simpler, suitable for reducing user understanding costs.
According to its current public documentation, its fee formula is:
Raw Fee = Base Fee % × min(Price, 1 − Price) × Shares
The Base Fee is currently 2%. The effective rate changes with the transaction price: below 50%, the rate is essentially fixed at 2%; above 50%, as the price approaches 1, the effective rate decreases.
Additionally, Predict.fun supports fee discounts, which further lower fees after application.
This design’s characteristic is intuitiveness: users don’t need to determine which side of the market they are on; they just need to look at the transaction price itself to understand the fee change.
https://docs.predict.fun/the-basics/predict-fees-and-limits#limits
It’s clear that the common goal of prediction market platforms is to convert aggressive trading behavior into revenue.
This also shows that there isn’t just one path to monetization for prediction markets. Ultimately, they all answer the same question: Are users willing to pay for trading?
3. Deep Dive into Polymarket: Trading Volume ≠ Real Revenue
While various platforms have their own approaches, Polymarket remains the most suitable case for validating the true monetization efficiency of prediction markets.
There are two main reasons:
- Its monetization path is clearest: from Crypto pilot to Sports expansion, and now to comprehensive fee collection across most categories.
- Its data is more complete: official feeRate, 7D/30D Fees can be used for further income structure decomposition.
So next, using Polymarket as an example, let’s answer a more specific question: Are the highest-volume verticals truly the most profitable?
3.1 From Free to Paid: Polymarket’s Commercialization Timeline
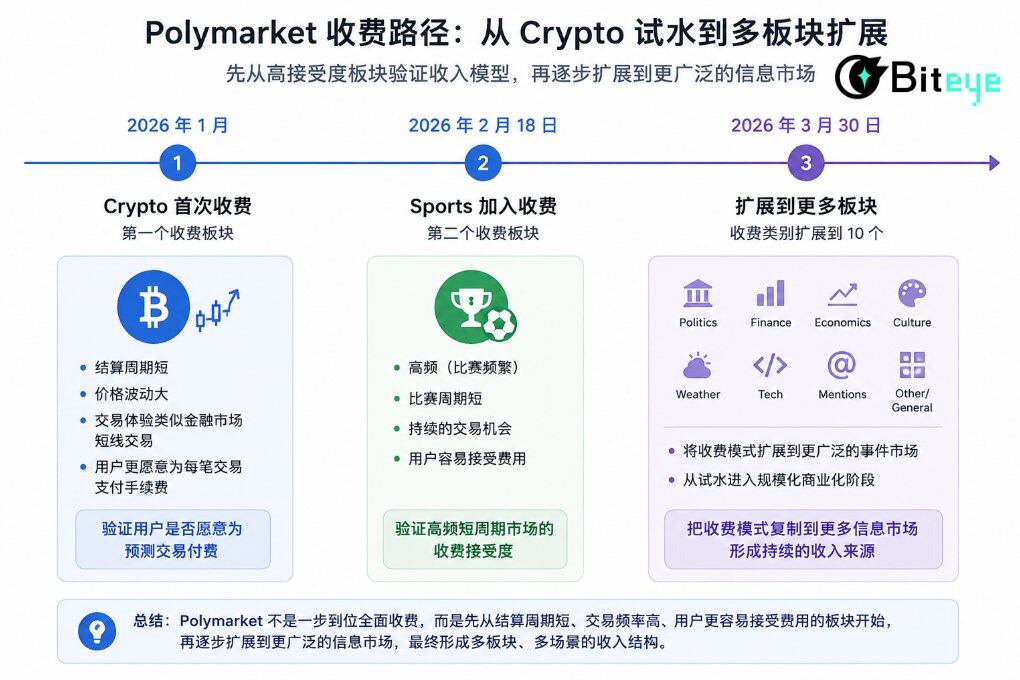
January 2026: Crypto Becomes the First Paid Vertical
Upon returning to US users, Polymarket pioneered the introduction of Taker Fees in the Crypto vertical. Crypto markets have short settlement cycles, high price volatility, and trading behavior akin to secondary short-term trading. Users’ pursuit of execution speed far outweighs their sensitivity to friction costs, making it an ideal testing ground for fees.
February 18, 2026: Sports Becomes the Second Paid Vertical
Shortly after, on February 18, 2026, the Sports vertical became the second paid vertical. Sports markets inherently have high frequency and short cycles, providing continuous trading scenarios. Therefore, Sports was a natural extension for fee implementation.
Polymarket’s initial focus on charging Crypto and Sports was essentially validating the revenue model on two verticals with higher user acceptance.
March 30, 2026: Fee Collection Expanded to More Verticals
On March 30, 2026, Polymarket extended taker fees to Politics, Finance, Economics, Culture, Weather, Tech, Mentions, Other/General, and more, expanding the paid categories to 10.
After going fully paid, Polymarket didn’t apply a uniform fee across all verticals but adopted a more granular fee structure. This step can be considered a key milestone in Polymarket’s commercialization, extending the fee model to a broader range of markets.
The results of full monetization have been remarkably impressive. According to recent data, Polymarket has demonstrated immense revenue-generating power: 7D Fees of $9.27M and 30D Fees of $36.3M. Its 7-day revenue has entered the top six among all Crypto projects, officially crossing into the revenue-generating project tier.
3.2 Core Vertical Order Type and Price Distribution Analysis
To estimate the real revenue for each Polymarket vertical as accurately as possible, we estimated fees for five main verticals based on Polymarket trading data from 2021 to February 2026.
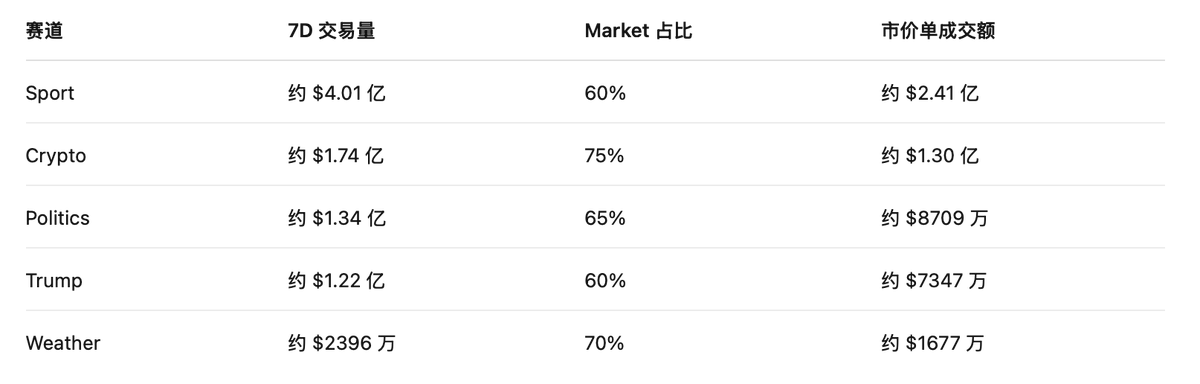
Looking at the proportion of market orders, significant differences exist among the five verticals:
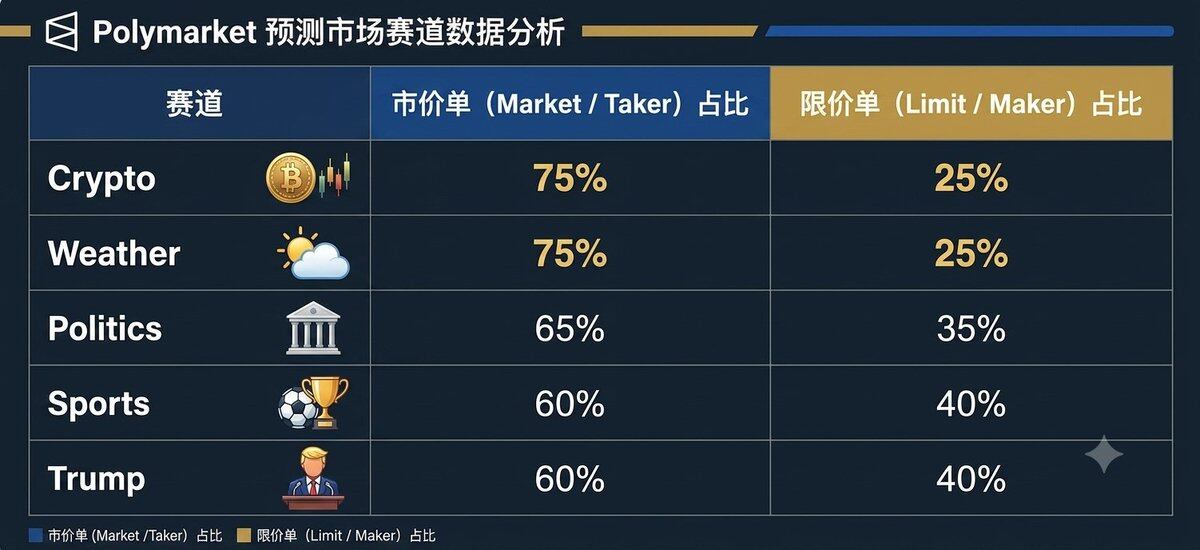
Crypto has the highest Market order share at 75%, which aligns perfectly with the “rapidly changing” nature of تشفير assets, where users prefer to lock in gains or losses directly with market orders. The Weather vertical, driven by real-time sudden meteorological data, also sees users highly valuing reaction speed.
Secondly, the amount of fees heavily depends on the transaction price range of the market.
The reason is that transactions entering the fee pool do not generate the same fee. Polymarket’s fee is related to p × (1 – p). The closer the price is to 50/50, the greater the market disagreement, and the higher the fee weight; the closer the price is to 0% or 100%, the more certain the outcome, and the lower the fee weight.
Data from the five main verticals shows that most trades are concentrated in the 30-50 range, especially the 40-50 range:
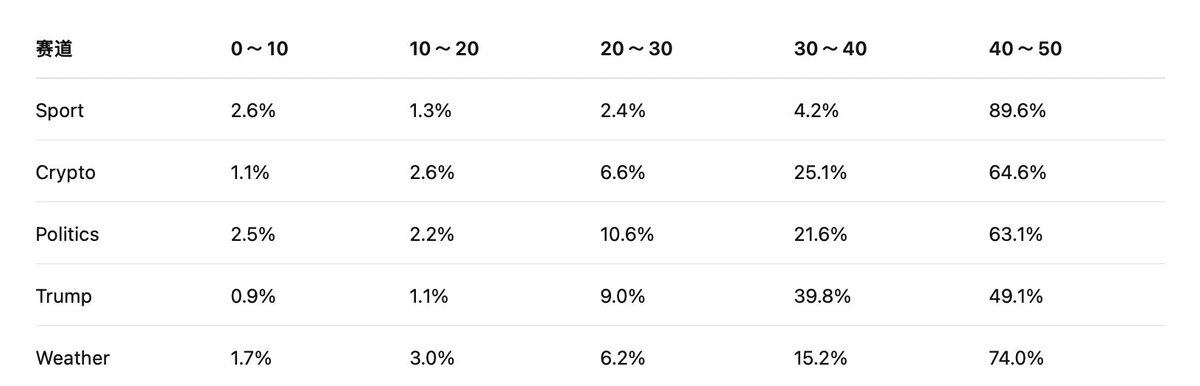
This data indicates that Polymarket’s primary trades do not occur when outcomes are nearly certain, but rather when significant market disagreement still exists.
### 3.3 Revenue Estimation: Who is the Cash Cow?
We use each vertical’s Market order volume, combined with its corresponding feeRate and the p × (1-p) weight across different price ranges, to roughly estimate Polymarket’s fee revenue across the five verticals. Considering that after implementing fees, some fee-sensitive users may switch from Taker to Limit orders, especially those trading late-stage, low-odds arbitrage, or high-frequency trades, we also make a more conservative assumption: a 20% decrease in market order volume for each vertical after fees.
The adjusted formula becomes:
Adjusted Estimated Fee ≈ Market Order Volume × 80% × feeRate × p × (1-p)
Based on the 7D total trading volume and each vertical’s volume share, we estimate the 7D market order volume for the five main verticals.
Having calculated each vertical’s market order volume, we then combine it with each vertical’s feeRate and price range weights to estimate fees. To make the calculation more robust, we use the median of each range as the approximate price:
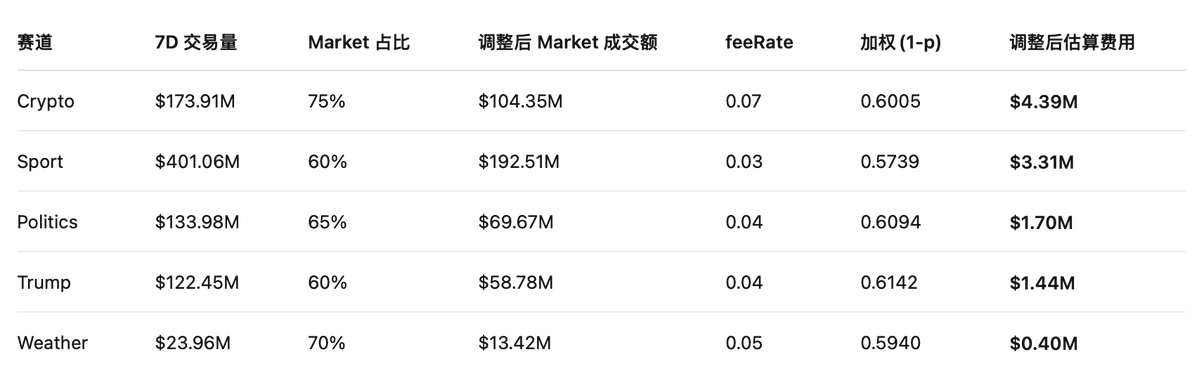
(Note: Due to statistical differences, lag in historical order type proportions, and dynamic vertical changes, this estimation model aims to replicate the contribution ratio of each vertical. The sum may have a reasonable variance compared to the system’s actual settled total fees.)
What does the data tell us?
1️⃣ Crypto is currently the highest
هذا المقال مصدره من الانترنت: Are prediction markets a cash cow? A deep dive into their profit models
1. Popular Tokens on CEX Top 10 CEX Trading Volume & 24h Change: BTC: -1.16% ETH: -2.64% SOL: -1.13% XRP: -1.11% ZEC: +4.91% DOGE: -1.63% BNB: -0.99% SUI: -1.02% EDEN: +30.51% TON: +4.12% 24h Gainers (Data Source: OKX): SPACE: +16.58% VINE: +15.7% ROBO: +12.89% HYPE: +10.53% KAITO: +9.21% KAIA: +7.62% ZEC: +5.2% TON: +3.9% LIT: +3.44% BANAN: +2.44% 24h Crypto Equity Gainers (Data Source: msx.com): ZSL: 18.84% CONI: 16.75% SOXS: 13.3% AFIG: 11.51% TSLQ: 11.36% SATL: 11.11% MSTZ: 10.6% NVDQ: 8.86% ETHD: 8.22% SIDU: 8.2% 2. Trending Meme Tokens On-Chain (Data Source: GMGN): ETH: AWF, sato Solana: SPCTROLL, memecoins BNB: He Zhao, 14 Top News Sources: US and Israel May Resume Military Operations Against Iran as Early as Next Week Odaily sources say US sources say the Pentagon is preparing…