Bitcoin Encounters Resistance at $79,000, $65,000-$70,000 May Become Key Support
Original Translation: AididiaoJP, Foresight News
Bitcoin remains suppressed below the Real سوق Price, with support located in the $65k to $70k range. Spot selling pressure is easing, capital flows are stabilizing, but demand remains weak. Heavy short positioning leaves room for a squeeze in a ranging market.
ملخص
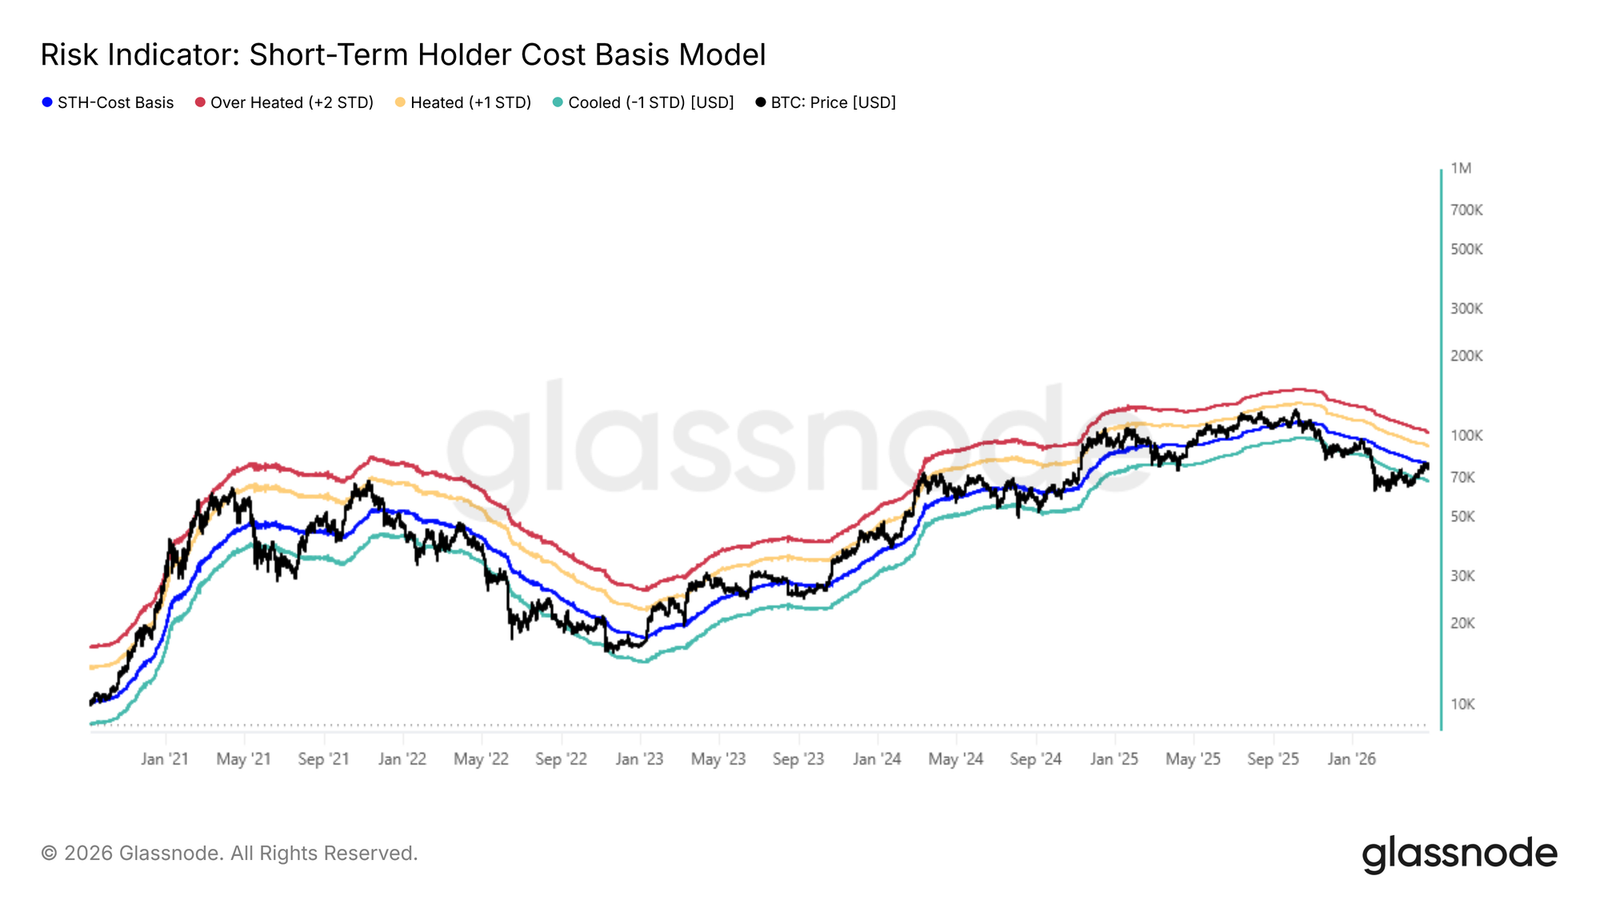
- Price breakouts faced resistance at the Real Market Price (~$79k) and the Short-Term Holder Cost Basis, reinforcing a medium-term bearish bias.
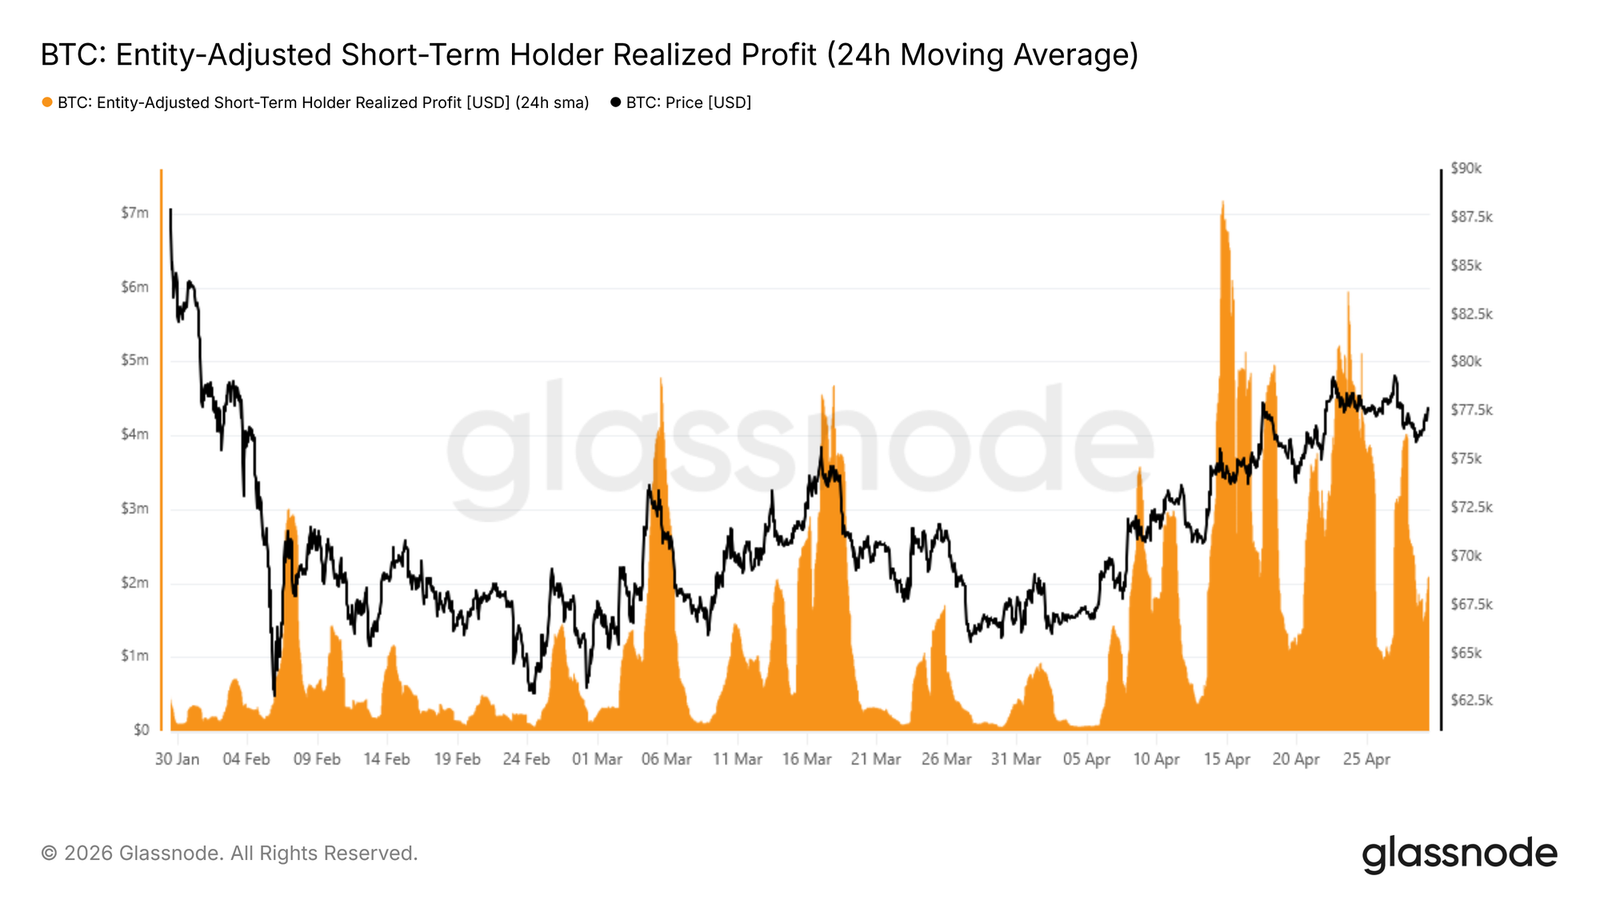
- Short-term holder realized profits surged to $4 billion per hour, reflecting significant profit-taking pressure that limited the sustainability of bounces.
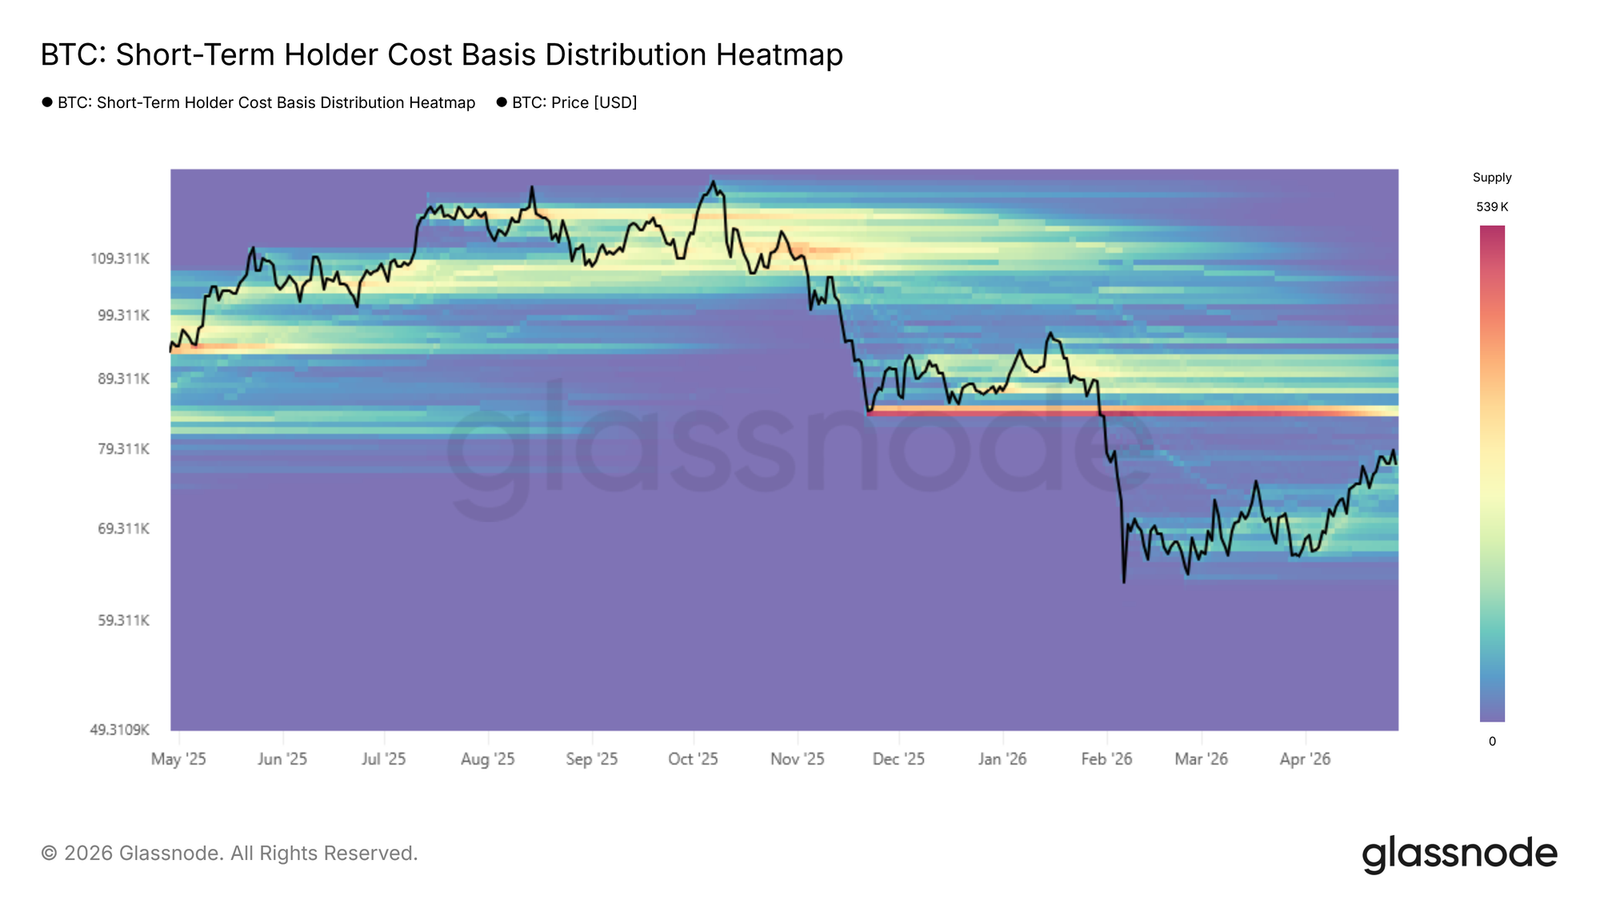
- A dense accumulation cluster between $65k and $70k forms short-term support, but a breakdown would weaken the short-term structure.
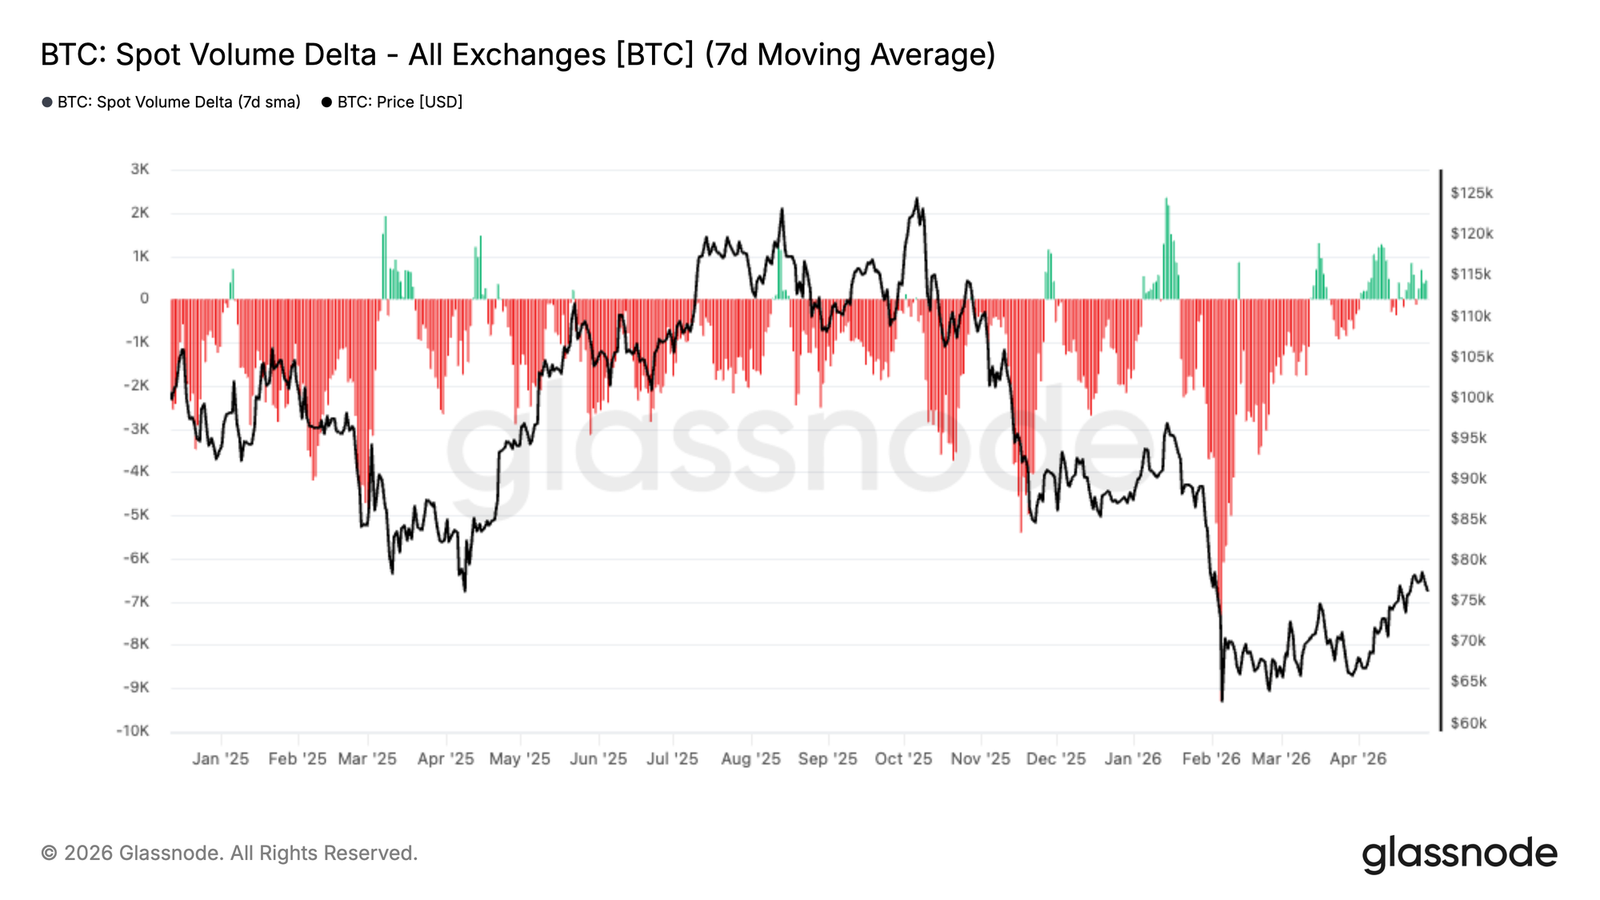
- Spot selling pressure is easing, with volume delta recovering towards neutral and early signs of buyer re-engagement.
- Institutional capital flows are stabilizing, with ETF AUM bouncing back and CME open interest starting to bottom after sustained outflows.
- Perpetual contract positioning has shifted to a record net short bias, highlighting increased hedging activity and potential for a squeeze.
- Volatility continues to compress, with protection demand rising but conviction weak, reinforcing a cautious, range-bound pattern.
- Realized and implied volatility are highly aligned, confirming a calmer market backdrop with limited directional conviction.
On-Chain Insights
Breakout Meets Resistance, Focus Shifts to Support
Last week, this report identified the Short-Term Holder Cost Basis and the Real Market Price as the most likely resistance zones for the current bear market rally, with profit-taking by recent buyers surging to levels historically associated with local top formations. Price was subsequently rejected precisely at this zone, failing to sustain above the Real Market Price of $78k and the Short-Term Holder Cost Basis of $79k. This behavior is textbook in a bear market: price approaches the breakeven point of the most price-sensitive cohort, where the incentive to exit overpowers the demand for growth, exhausting upward momentum.
With this rejection confirming overhead resistance, the medium-term bias has tilted towards further downside pressure. Attention now turns to the -1 standard deviation level near $68k as the most immediate structural support level to monitor.
Analyzing the Decline
The decline at the Short-Term Holder Cost Basis is not just a price observation; on-chain spending data captures precisely how it unfolded. The 24-hour simple moving average of short-term holder realized profit volume is a real-time measure of how aggressively recent buyers are converting unrealized gains into exits.
As price approached $80k, this metric spiked to approximately $4 million per hour, roughly four times the baseline level established since mid-April, confirming that short-term holders were using the bounce as a distribution opportunity. Buyer liquidity was completely insufficient to absorb this wave of profit-taking, limiting momentum and triggering the subsequent rejection.
This metric is most useful when analyzing two dimensions simultaneously: the baseline (as a proxy for the broader trajectory of buyer liquidity) and the peaks (which have served as reliable local top indicators throughout the current bear market cycle).
Two Scenarios, One Cluster
Resistance at the Real Market Price and Short-Term Holder Cost Basis reinforces the broader structural weakness characteristic of this bear market. However, the picture is not entirely bearish.
The dense accumulation cluster built between $65k and $70k over the past two months reflects significant buyer conviction at these levels, providing a foundation for a short-term bounce towards $84k, near the lower edge of the overhead supply cluster.
Conversely, if the market fails to absorb sustained selling pressure from the Real Market Price zone, then that same $65k–$70k accumulation cluster, more specifically the Short-Term Holder Cost Basis -1 standard deviation level near $68k, will become the primary support reference for the short to medium term. Thus, the path forward depends on whether buyers within this range can maintain enough conviction to overcome the overhead distribution pressure.
Off-Chain Insights
Selling Pressure Eases, Buyers Re-emerge
Spot volume delta has spent most of the past few months in deeply negative territory, reflecting sustained net selling pressure on exchanges. This persistent seller dominance aligns with the broader correction, particularly during the sharp pullback into the ~$60k–$70k range.
Recently, however, data shows a clear shift. The 7-day average has recovered to near-neutral and is beginning to show intermittent positive delta bursts. This indicates that selling pressure is easing while buyers are starting to re-engage at current levels.
From a market structure perspective, this shift is significant. While it does not yet indicate strong accumulation, the move towards balance suggests improving spot demand and reduced seller urgency. A sustained extension into positive territory is needed to confirm buyers are regaining control, paving the way for a more durable recovery.
Institutional Liquidity Rebuilding
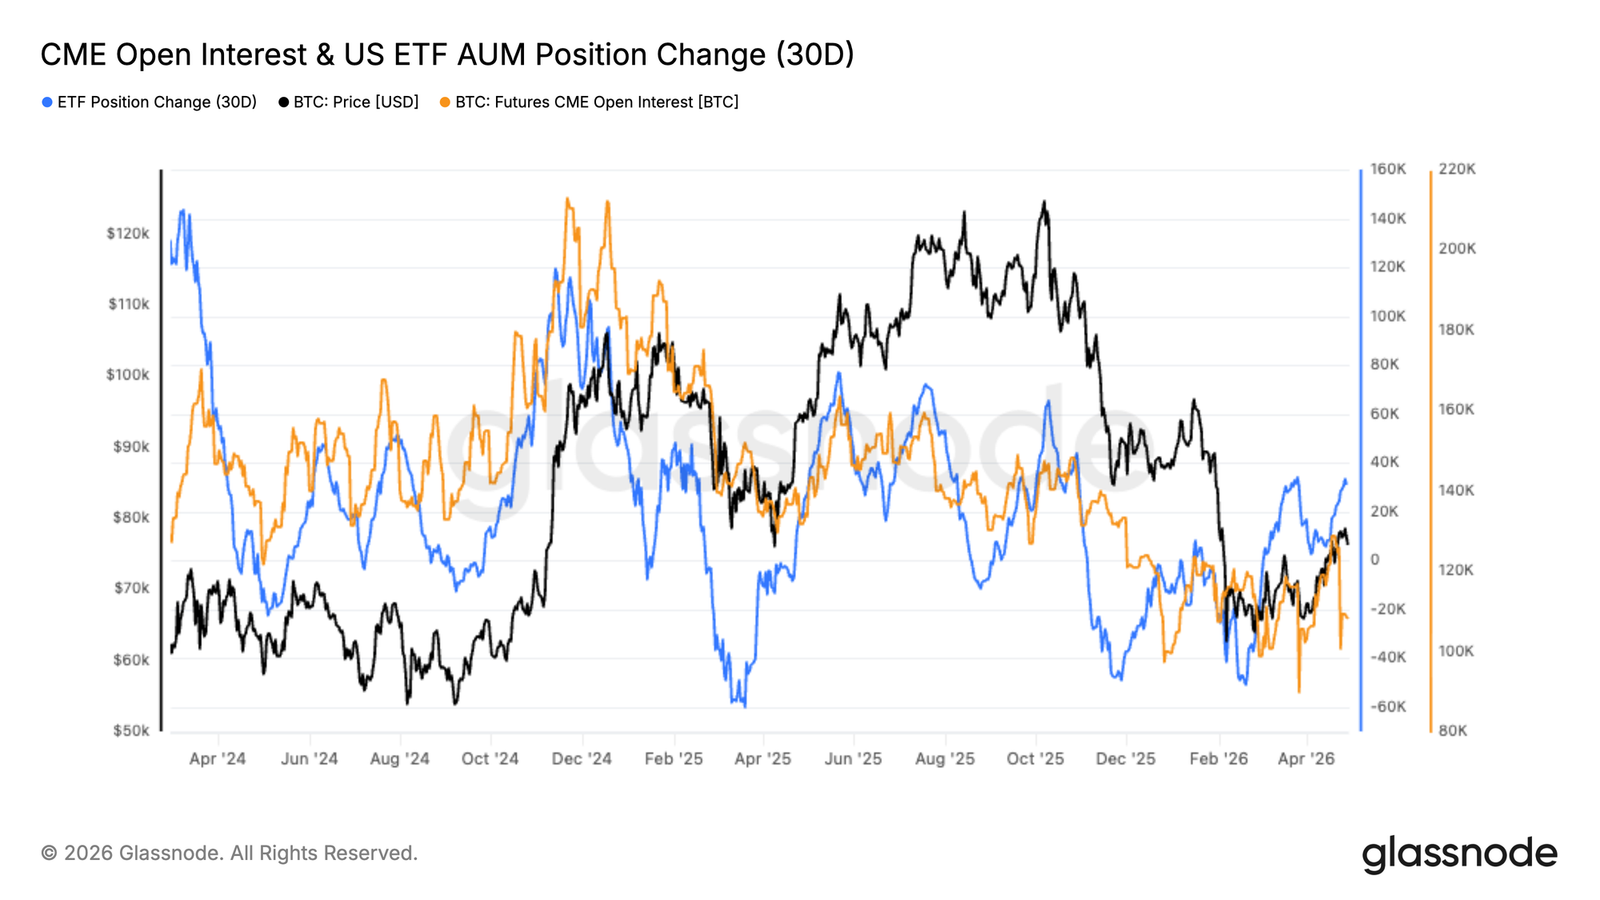
Institutional positioning is beginning to stabilize, with both CME open interest and US spot ETF AUM showing early signs of recovery following a period of outflows. ETF position changes have bounced back from deeply negative levels, while CME open interest appears to be bottoming out, suggesting early re-engagement.
The earlier decline reflected broad risk aversion, with capital exiting both futures and ETF channels during the correction. The recent uptick points to cautious re-accumulation rather than aggressive positioning.
Sustained inflows will be necessary to support a stronger trend. For now, the data indicates early institutional re-entry, but not yet full conviction.
Record Short Bias
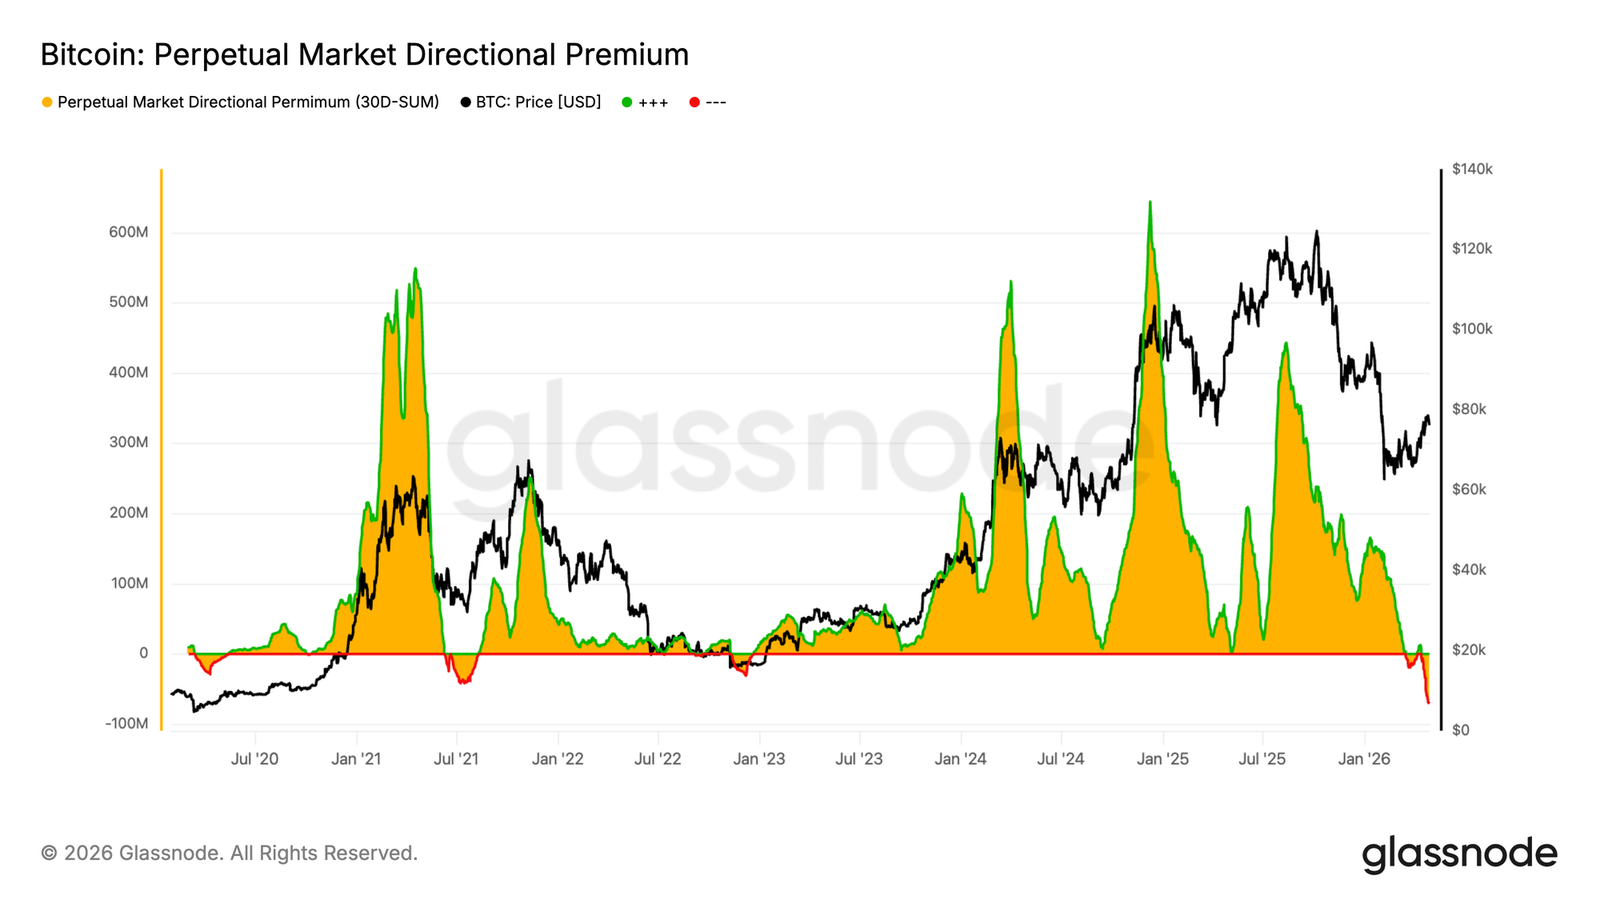
The perpetual market’s directional premium has fallen to its most negative level on record, marking the deepest sustained short bias in this dataset. Unlike short-lived negative readings in previous cycles, this move reflects a more persistent defensive posture.
This extreme discount is driven by several factors. Recent price weakness has spurred increased hedging and outright shorting in the perpetual market, while the unwinding of previously crowded long positions accelerated the move through liquidations. Concurrently, subdued spot demand and soft ETF flows reduced natural buying pressure, allowing derivatives to dominate short-term price action.
Historically, such extremes occur during periods of high uncertainty and often precede turning points. While short-term uncertainty persists, the market is increasingly positioned for a potential squeeze if sentiment or spot demand improves.
Implied Volatility Declines Across the Term Structure
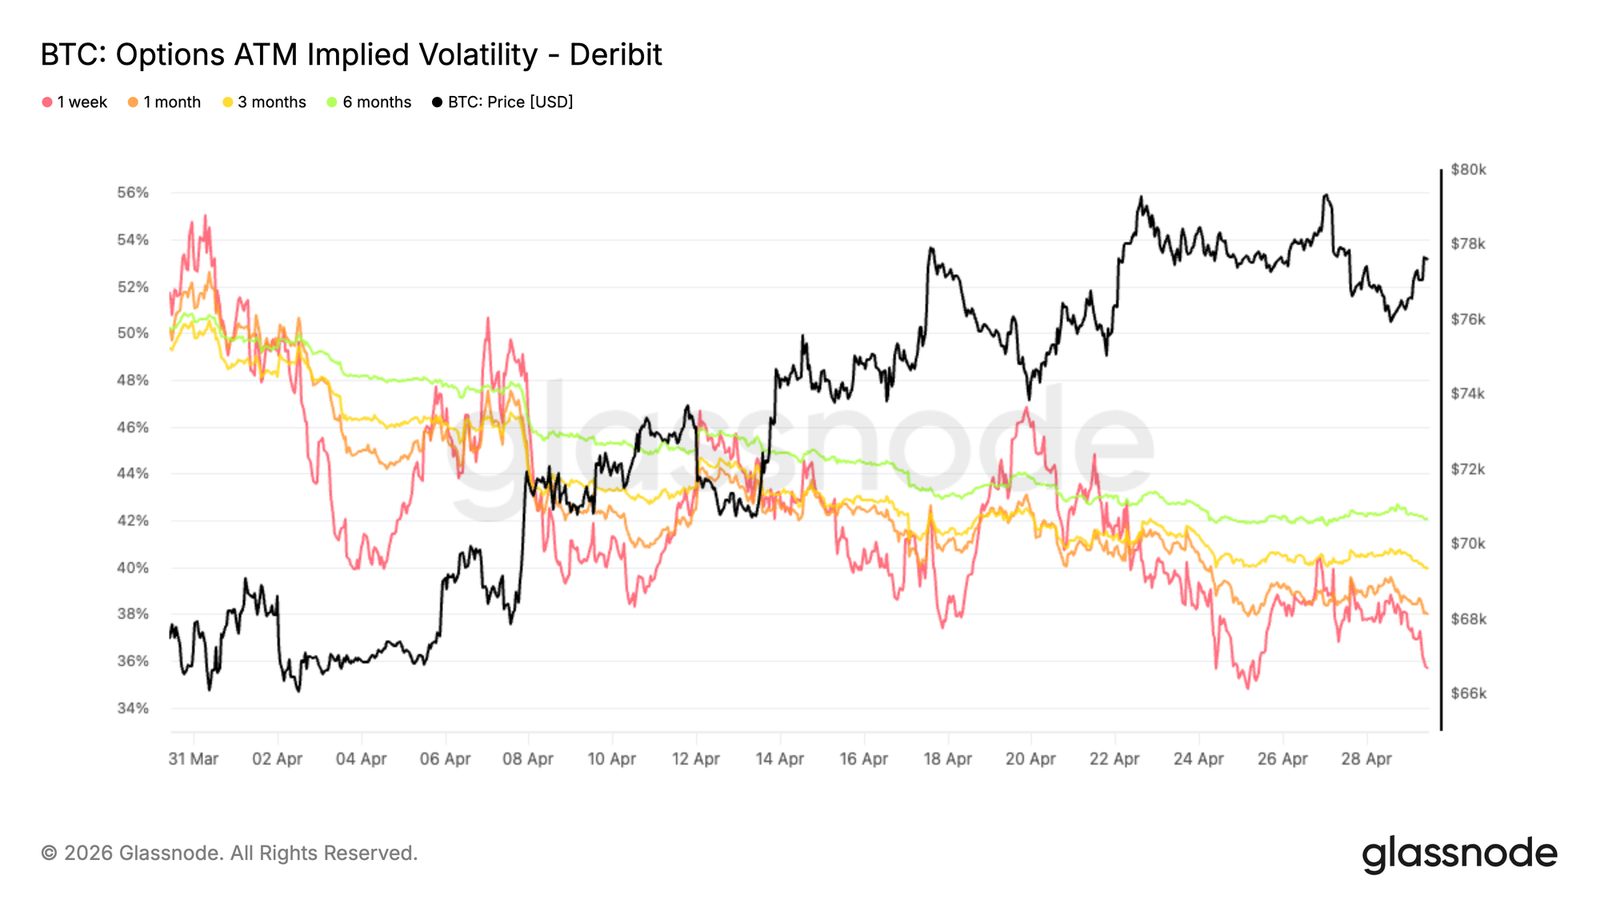
Looking back at April, starting with implied volatility, the dominant theme was broad compression across all tenors.
The 1-week at-the-money volatility dropped by approximately 16 percentage points, while the 6-month tenor fell by about 8 points. Other tenors fell within this range, averaging a decline of around 10 volatility points.
The curve remains in contango, meaning longer-dated options still trade at a premium to shorter-dated ones, but at lower levels. This reflects the market pricing in a more stable future environment.
Lower implied volatility reduces the cost of options, especially upside calls. Meanwhile, protection demand appears to have eased. Traders are less willing to pay high premiums for volatility exposure, consistent with the recent price recovery and pointing towards an expectation of normalization rather than conviction building.
25-Delta Skew Trends Lower, but Protection Remains
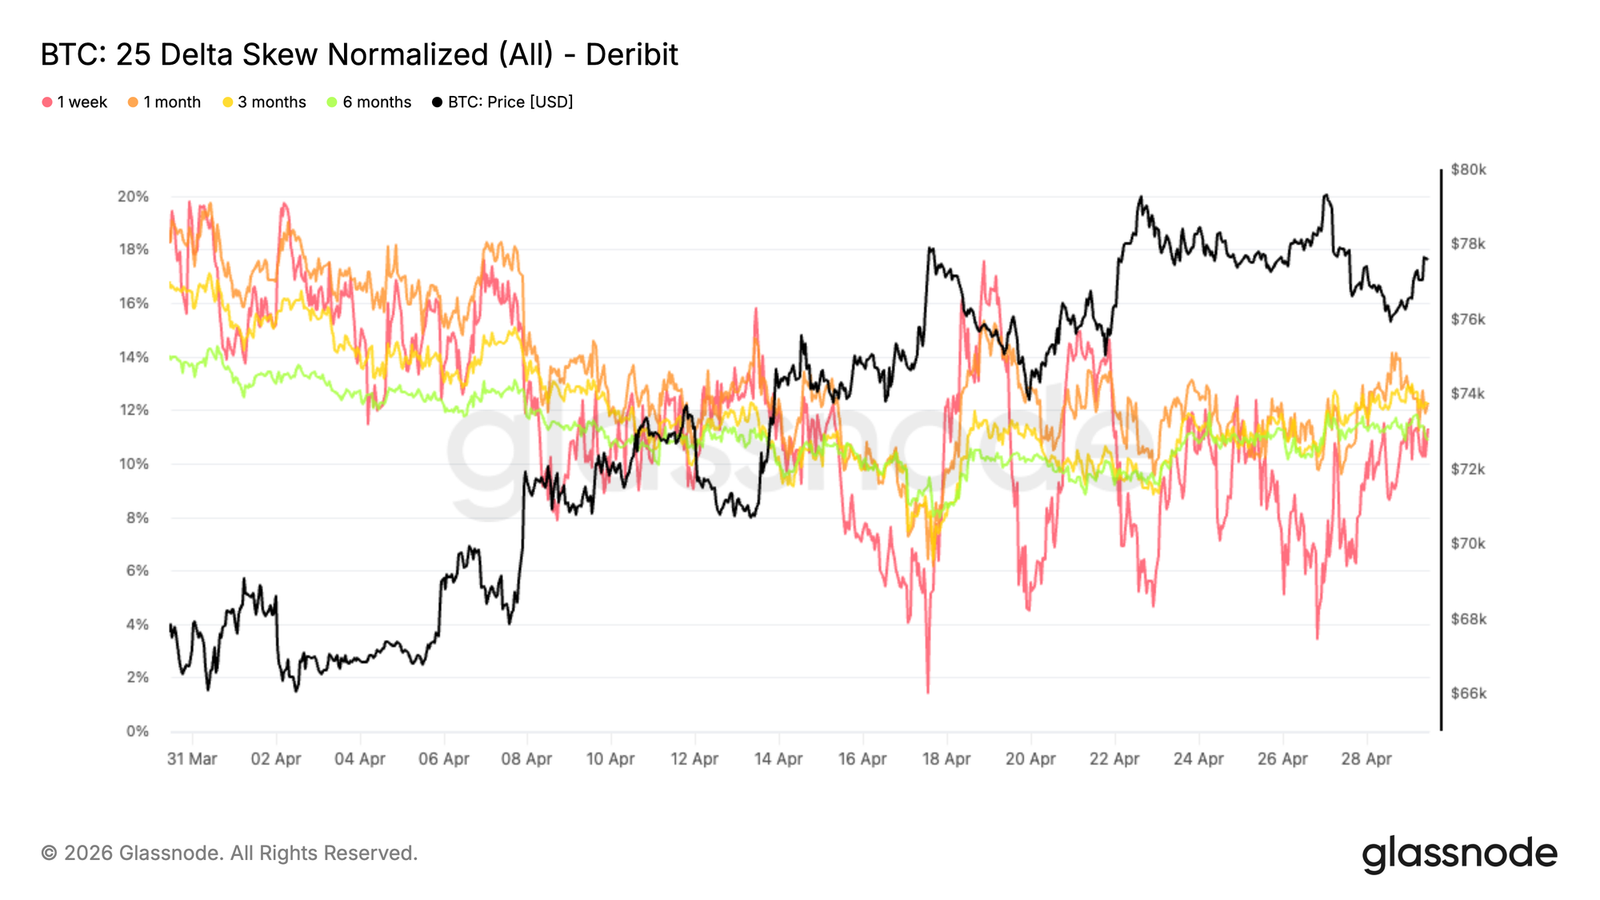
As implied volatility compressed, the skew reveals how protection demand evolved in April. The broader trend is a steady decline in put premiums, with the 1-month skew falling from around 18% to 12%. This reflects a notable decrease in demand for downside hedging as conditions stabilized.
At the short end, the 1-week skew was more reactive, spiking several times towards neutral (2%–4%) at multiple points in April. These moves were primarily tactical, as pullbacks were used to buy calls and sell downside, temporarily flattening the skew.
More recently, as price approached the $80k resistance, put demand picked up again, pushing skews across tenors back into the 11%–12% range. Protection persists, with the market making tactical adjustments at the short end while maintaining a cautious stance further out the curve.
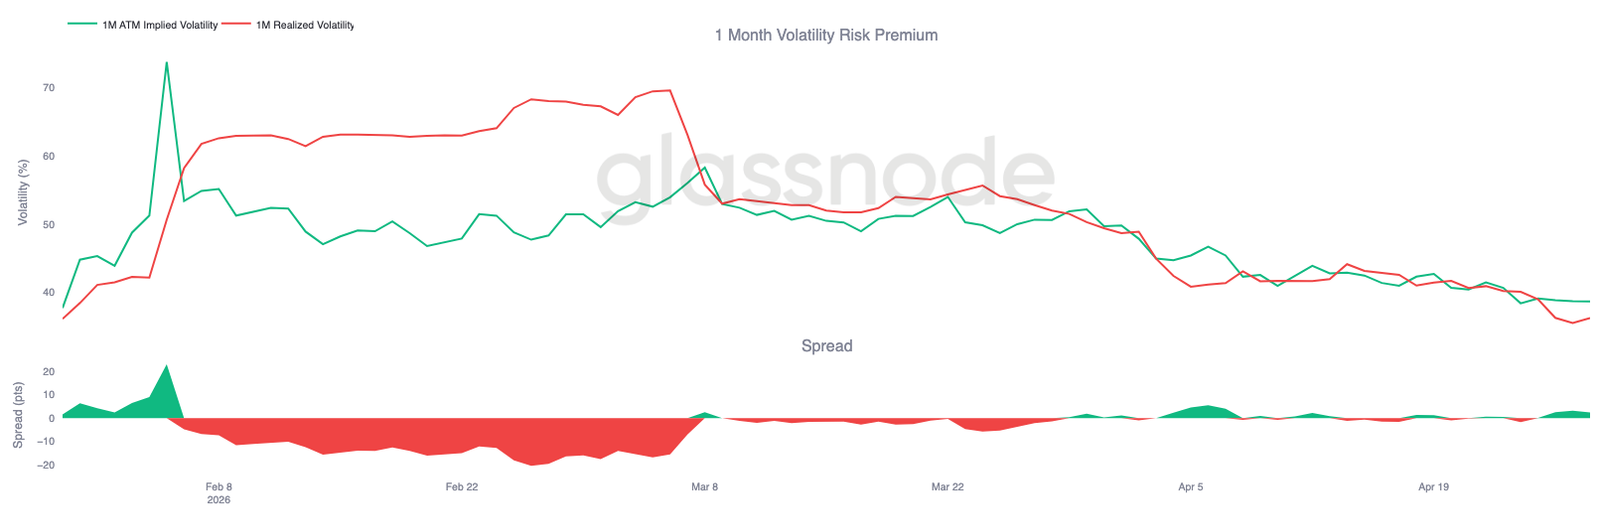
Realized Volatility Confirms Downward Shift
As implied volatility continued to compress, realized volatility moved in the same direction and reinforced the trend. Bitcoin’s realized volatility has steadily declined. This is significant because realized volatility anchors how options should be priced. When realized volatility falls, it naturally pulls down implied volatility, as the necessity to price large price swings diminishes.
This creates a feedback loop: cheaper options reduce the urgency for hedging, leading to fewer hedge-driven price moves.
1-month realized volatility is around 36, while implied volatility is near 38, leaving minimal premium for volatility sellers to assume risk.
The current environment reflects a shift from stress towards greater balance. Volatility is no longer being bought aggressively, and the market appears comfortable with a narrower expected price range.
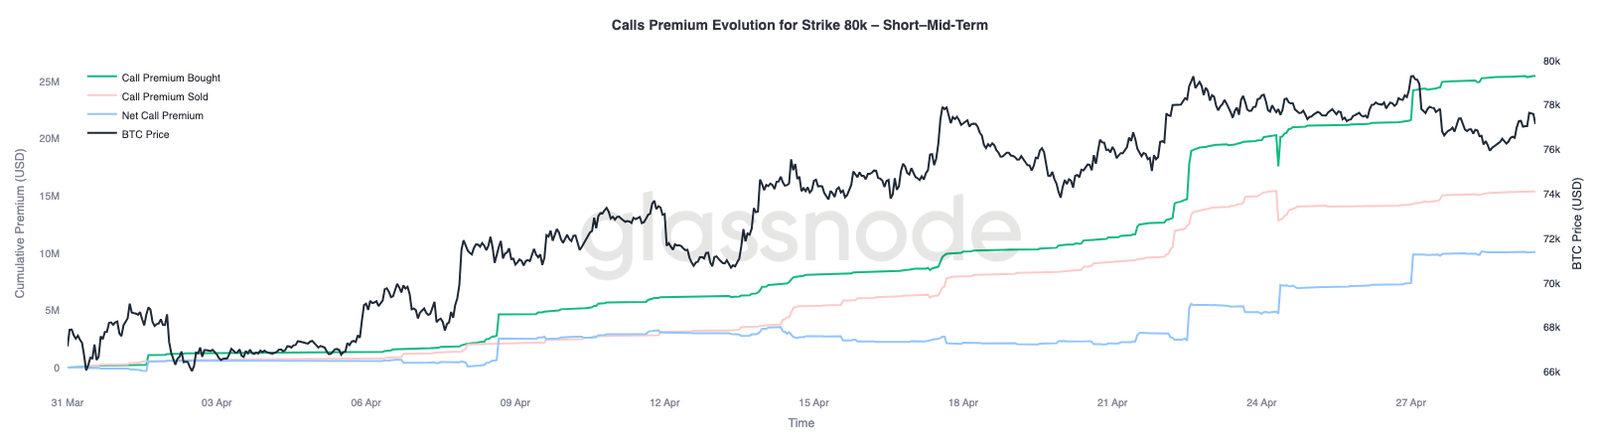
$80k Strike Premium Accumulation Becomes Key Pivot
With both volatility and skew easing, positioning becomes the next layer to monitor, with the $80k level emerging as the next critical focal point.
Short and medium-term tenors show sustained buying at the $80k strike, indicating growing interest in exposure above this level. This suggests traders are positioning for a test of resistance rather than betting on a decline.
Meanwhile, two key negative gamma zones stand out: $76k on the downside and $82k on the upside. These levels could become areas where hedging flows amplify price action, especially in low-liquidity environments.
A breakout above $80k would bring spot closer to the $82k area, where negative gamma could force market makers to buy into strength, reinforcing the move. Positioning remains cautious, but it is increasingly vulnerable to a sharper upside reaction if resistance is cleared.
خاتمة
In summary, the market remains trapped below key resistance, with the Real Market Price continuing to cap upside attempts while the support cluster near $65k–$70k provides a floor. Spot selling pressure is beginning to ease, and early signs of institutional re-engagement are present, but demand has not yet shown the strength necessary for a sustained breakout.
Meanwhile, derivatives positioning has turned decisively bearish, with record net short exposure and elevated protection demand reflecting a defensive mindset. This leaves the market in a fine balance. While positioning weights are tilted towards caution, it also leaves room for a sharp upside dislocation if capital flows turn.
Without a clear expansion in spot demand or institutional inflows, the most likely outcome remains a choppy, range-bound environment. The next directional move will likely be driven not by positioning alone, but by whether real capital steps in to absorb supply and reclaim higher levels.
هذا المقال مصدره من الانترنت: Bitcoin Encounters Resistance at $79,000, $65,000-$70,000 May Become Key Support
Related: Institutional Adoption of Prediction Markets Stuck at the Third Stage
Compiled by | Odaily (@OdailyChina); Translator | Asher (@Asher_ 0210) Editor’s Note: At the end of March this year, the prediction market, once considered a niche field, reached a critical juncture. Kalshi Research, the research arm of Kalshi, hosted its inaugural research conference in New York, bringing together academics, Wall Street executives, former politicians, and frontline traders. The composition of the attendees sent a clear signal—prediction markets are moving from the fringe to the mainstream. The conference opened with a conversation between Kalshi co-founders Tarek Mansour and Luana Lopes Lara, moderated by Bloomberg journalist Katherine Doherty. This article excerpts and summarizes the key insights from the conference. Prediction Markets Are More Than Just Elections and Sports For a long time, prediction markets have been defined by certain “highlight moments”—U.S. elections,…