1. Summary and Key Findings
In Q1 2026, the overall تشفيرcurrency market remained highly active, but trading volume gradually declined from its January peak. Total spot trading volume for the quarter was approximately $1.94 trillion, while derivatives trading volume reached about $18.63 trillion, summing to a total of roughly $20.57 trillion. The ratio of derivatives to spot trading volume was about 9.6x. Structurally, market activity remained concentrated in the derivatives market, with spot trading experiencing a relatively larger contraction.
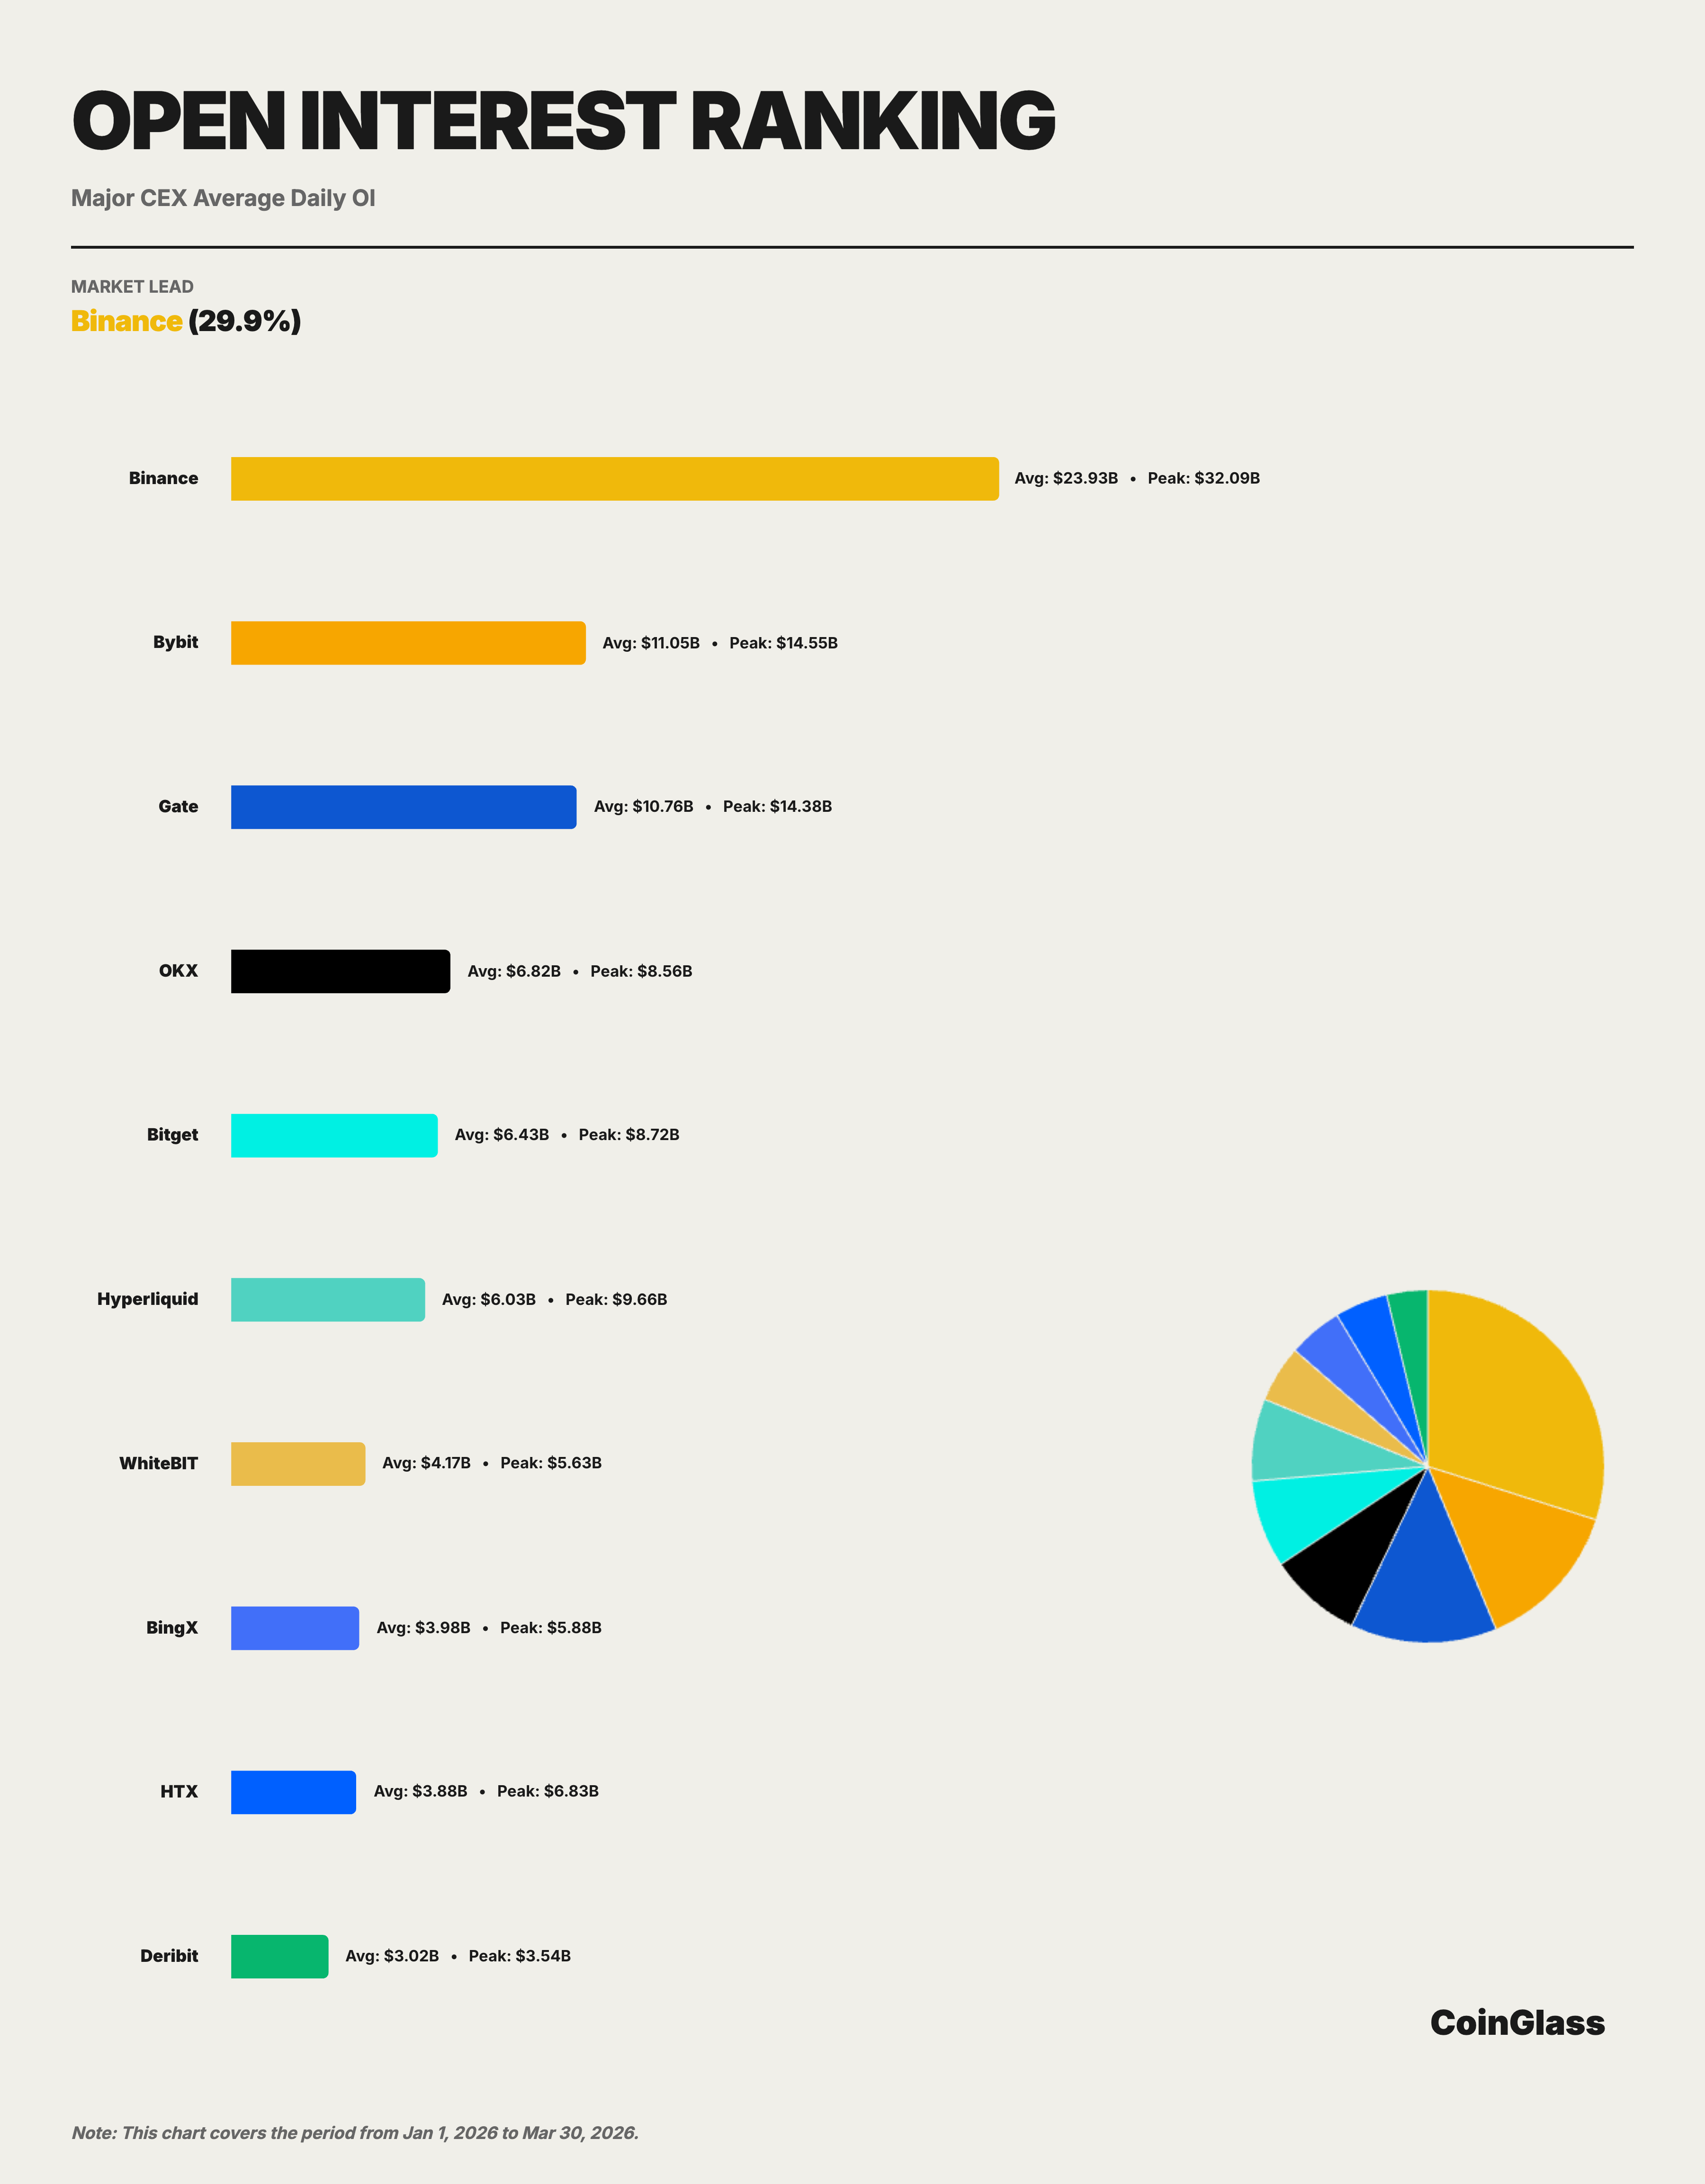
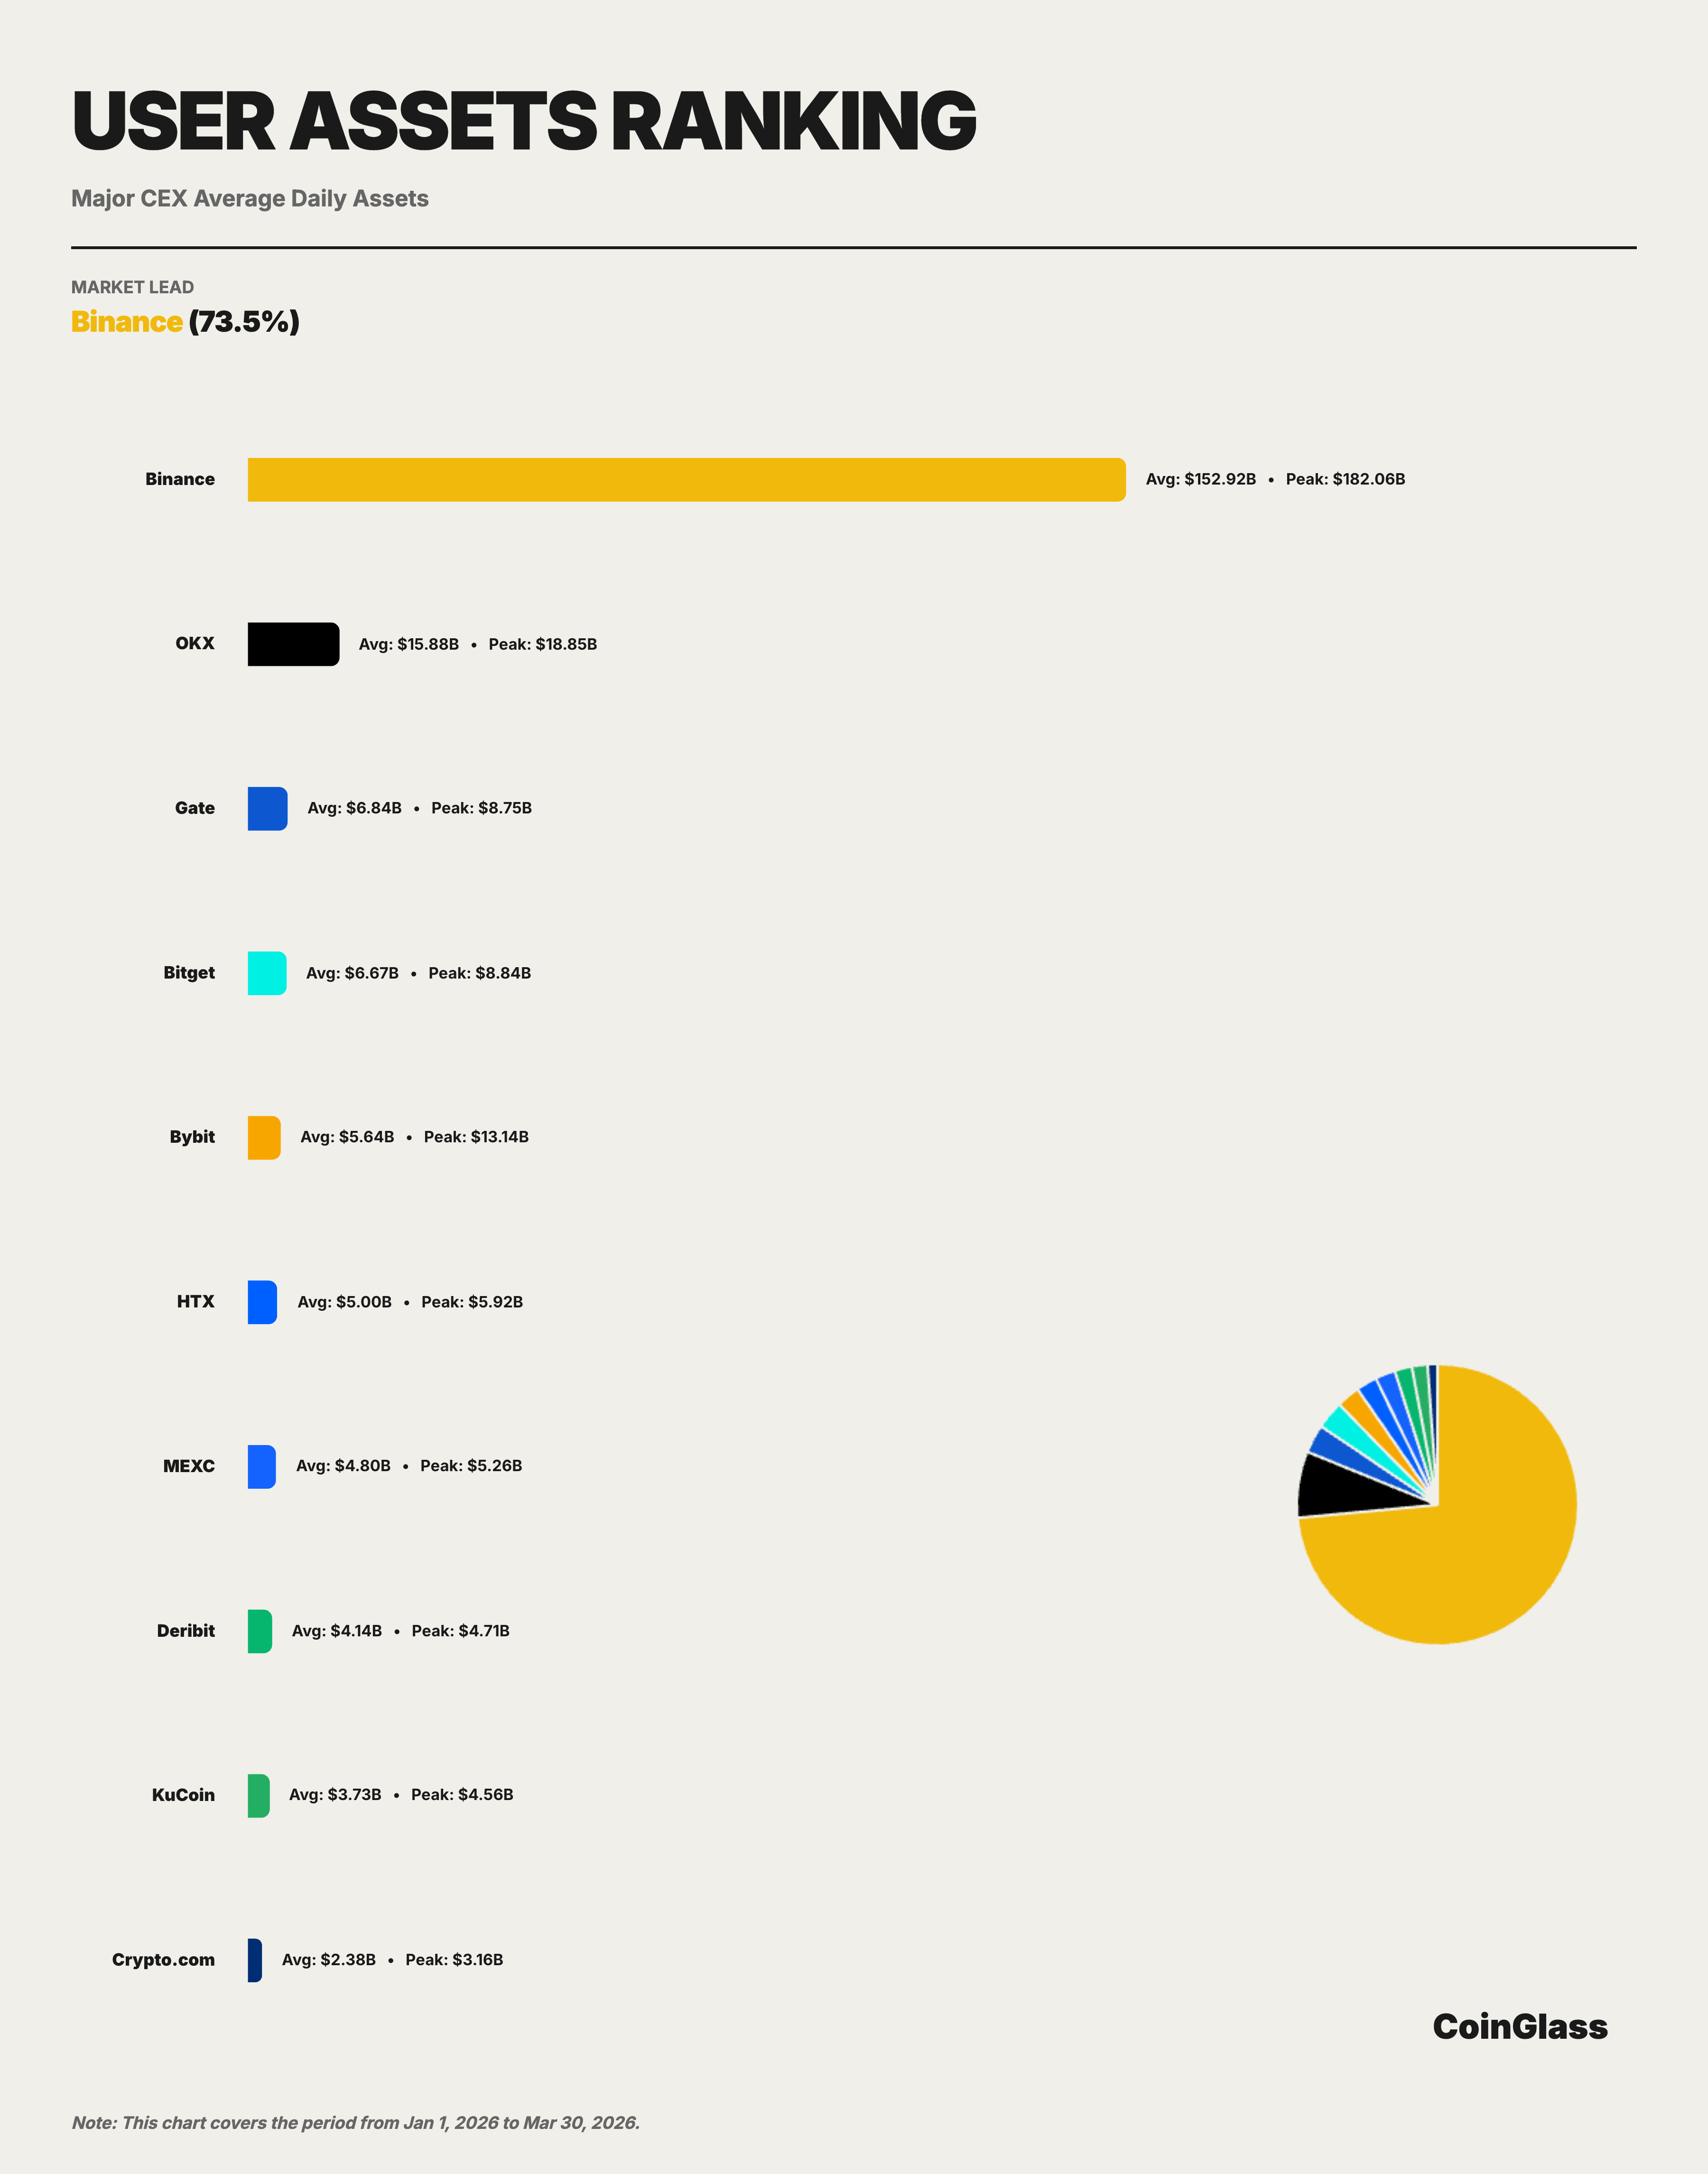
In terms of core metrics, Binance continued to maintain its industry leadership. Its derivatives trading volume was approximately $4.90 trillion, accounting for about 34.9% of the Top 10 exchanges’ market share. Its average daily open interest was around $23.9 billion, representing a 29.9% share. User assets held on the platform totaled about $152.9 billion, constituting roughly 73.5% among major CEXs. Compared to the second-place exchange, Binance’s derivatives volume was about 2.2 times that of OKX, its average OI was about 2.2 times that of Bybit, and its user asset scale was approximately 9.6 times that of OKX. This data reflects that Binance’s leadership is not concentrated in a single dimension but is evident simultaneously across trading volume, open interest, liquidity, and capital retention.
Looking at the Top 5 competitive landscape, the market has formed a relatively clear hierarchical structure. In terms of derivatives trading volume, Binance, OKX, Bybit, Gate, and Bitget rank in the top five, with Bybit and Gate being close in size, and OKX remaining the centralized platform closest to Binance. In terms of open interest, the order in the second tier changes to Bybit, Gate, OKX, and Bitget. Regarding user asset holdings, only OKX maintains a level above $10 billion after Binance, while Gate, Bitget, and Bybit are all in the $5-7 billion range. Overall, competition within the Top 5 is relatively robust, but there remains a significant gap between the leading platform and subsequent tiers.
2. Spot and Derivatives Trading Volume
2.1 Overview of Monthly سوق-wide Trading Volume
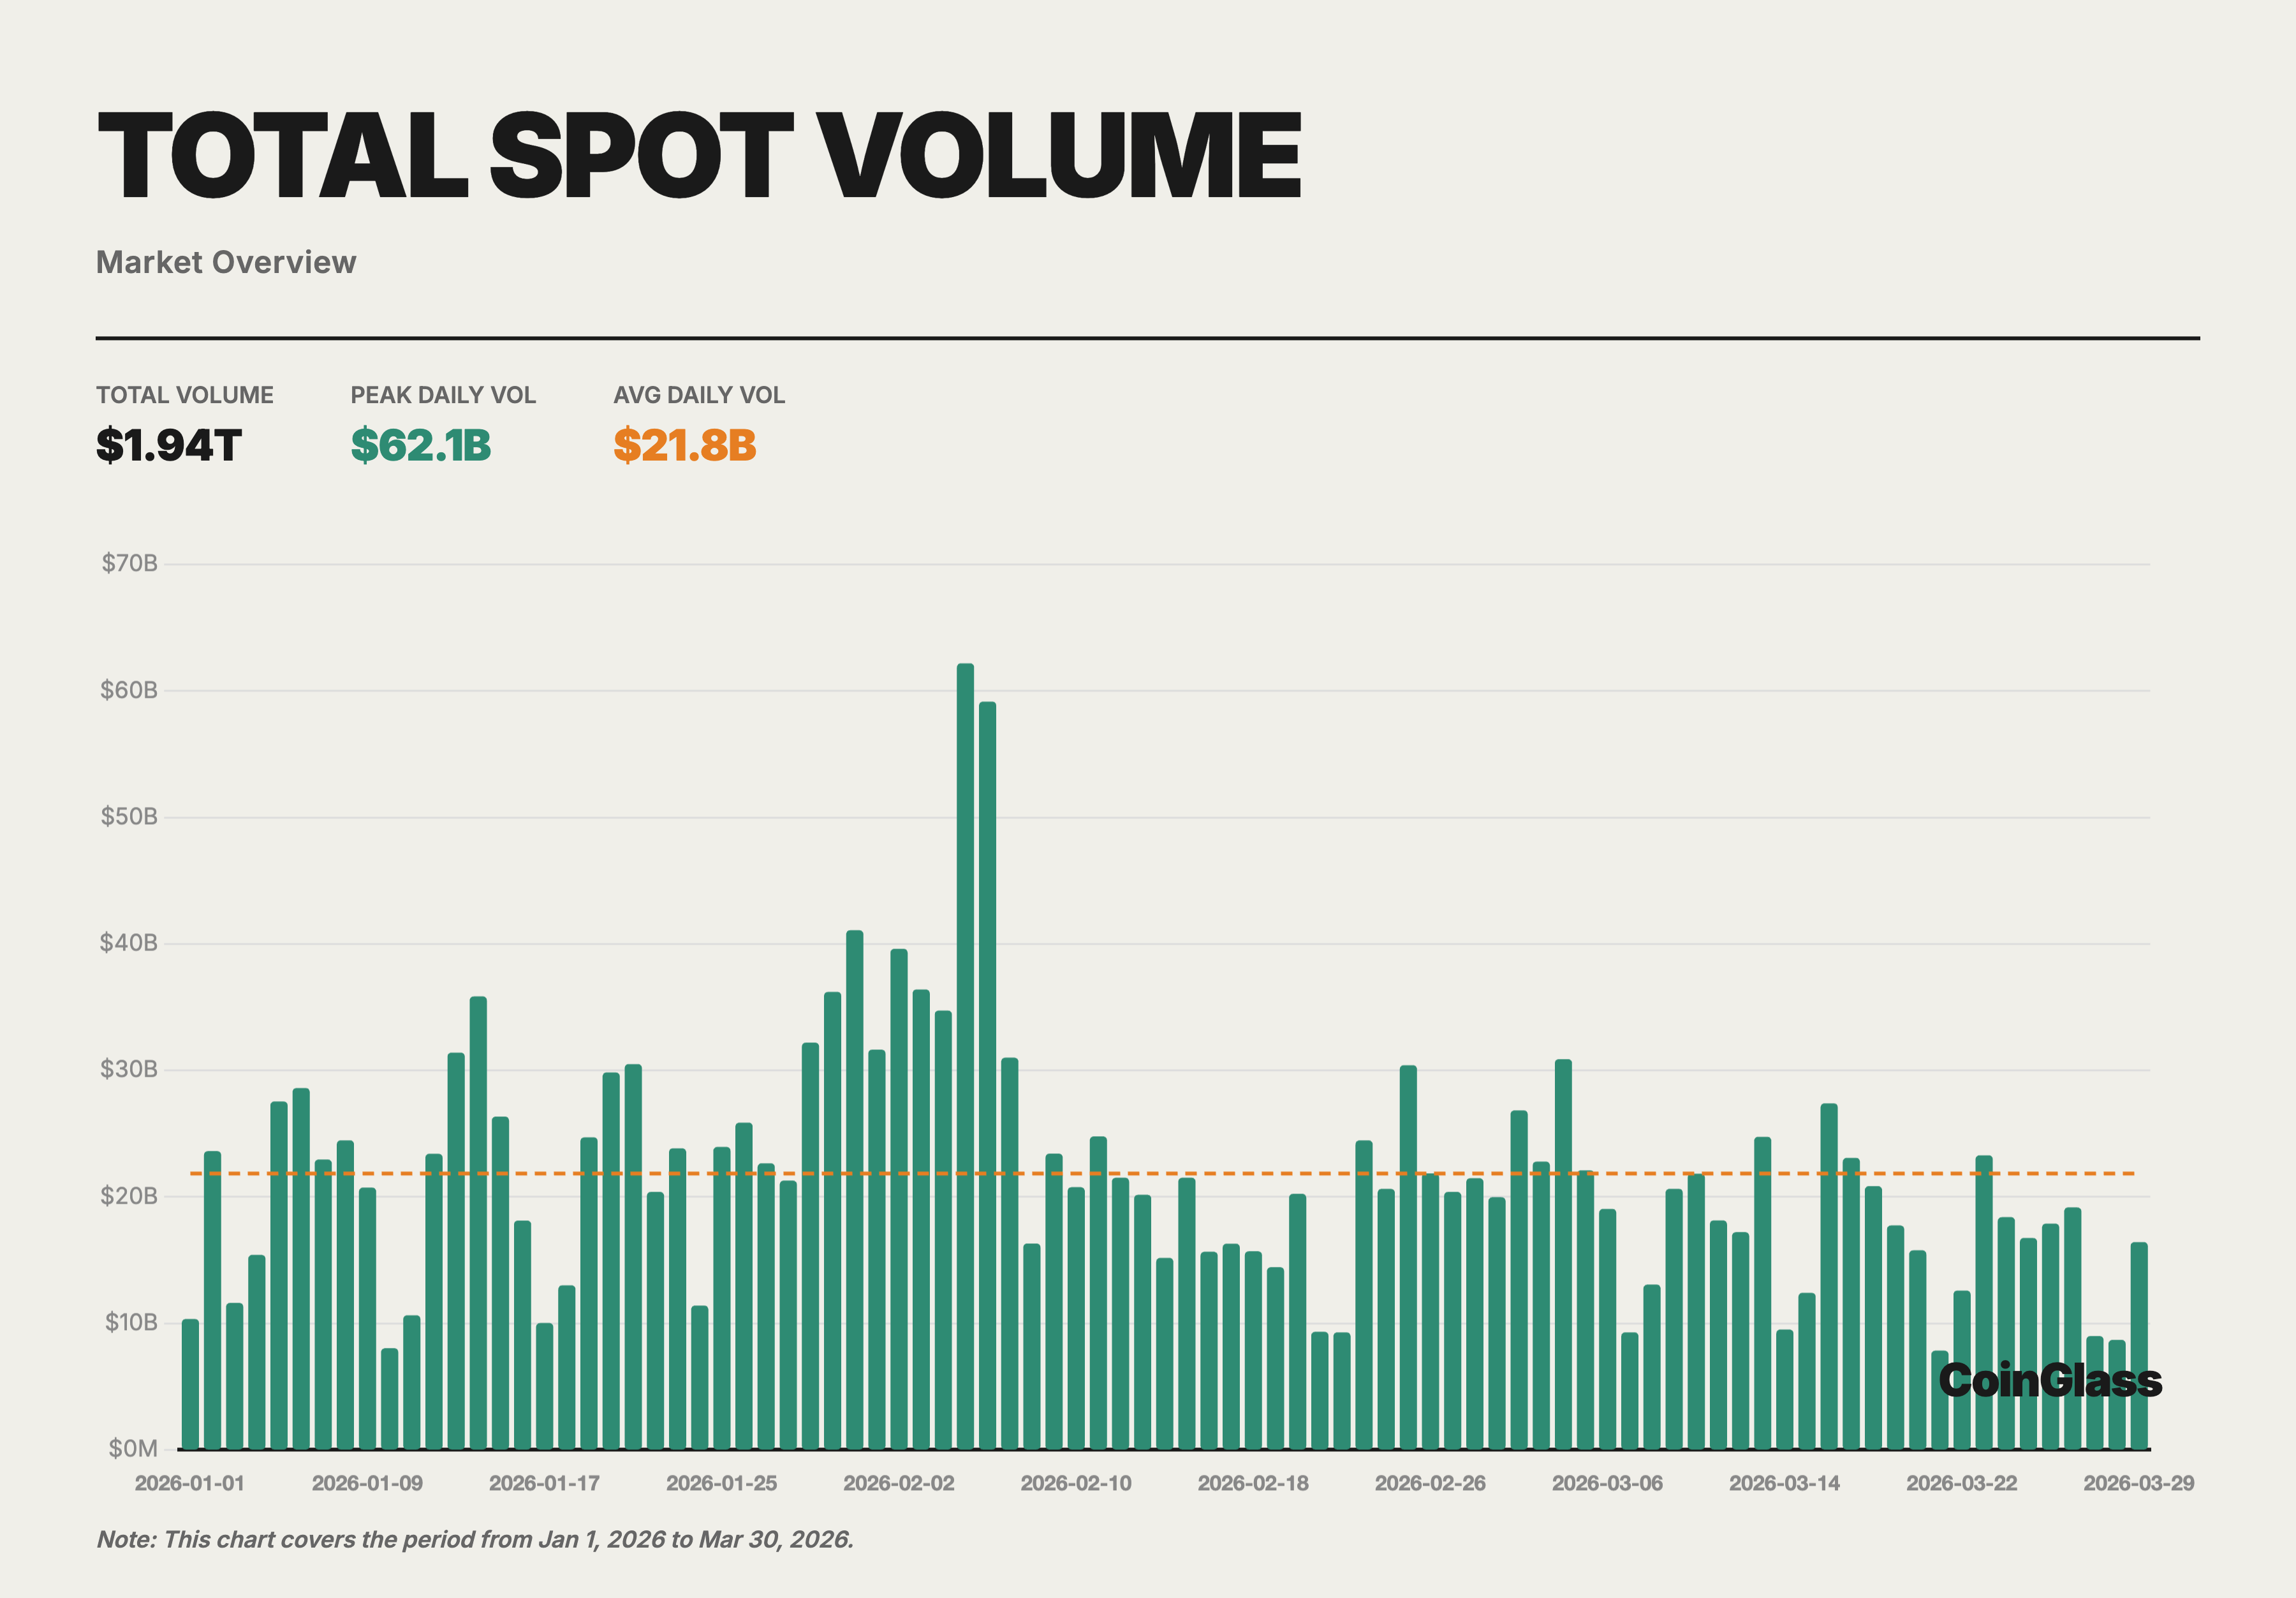
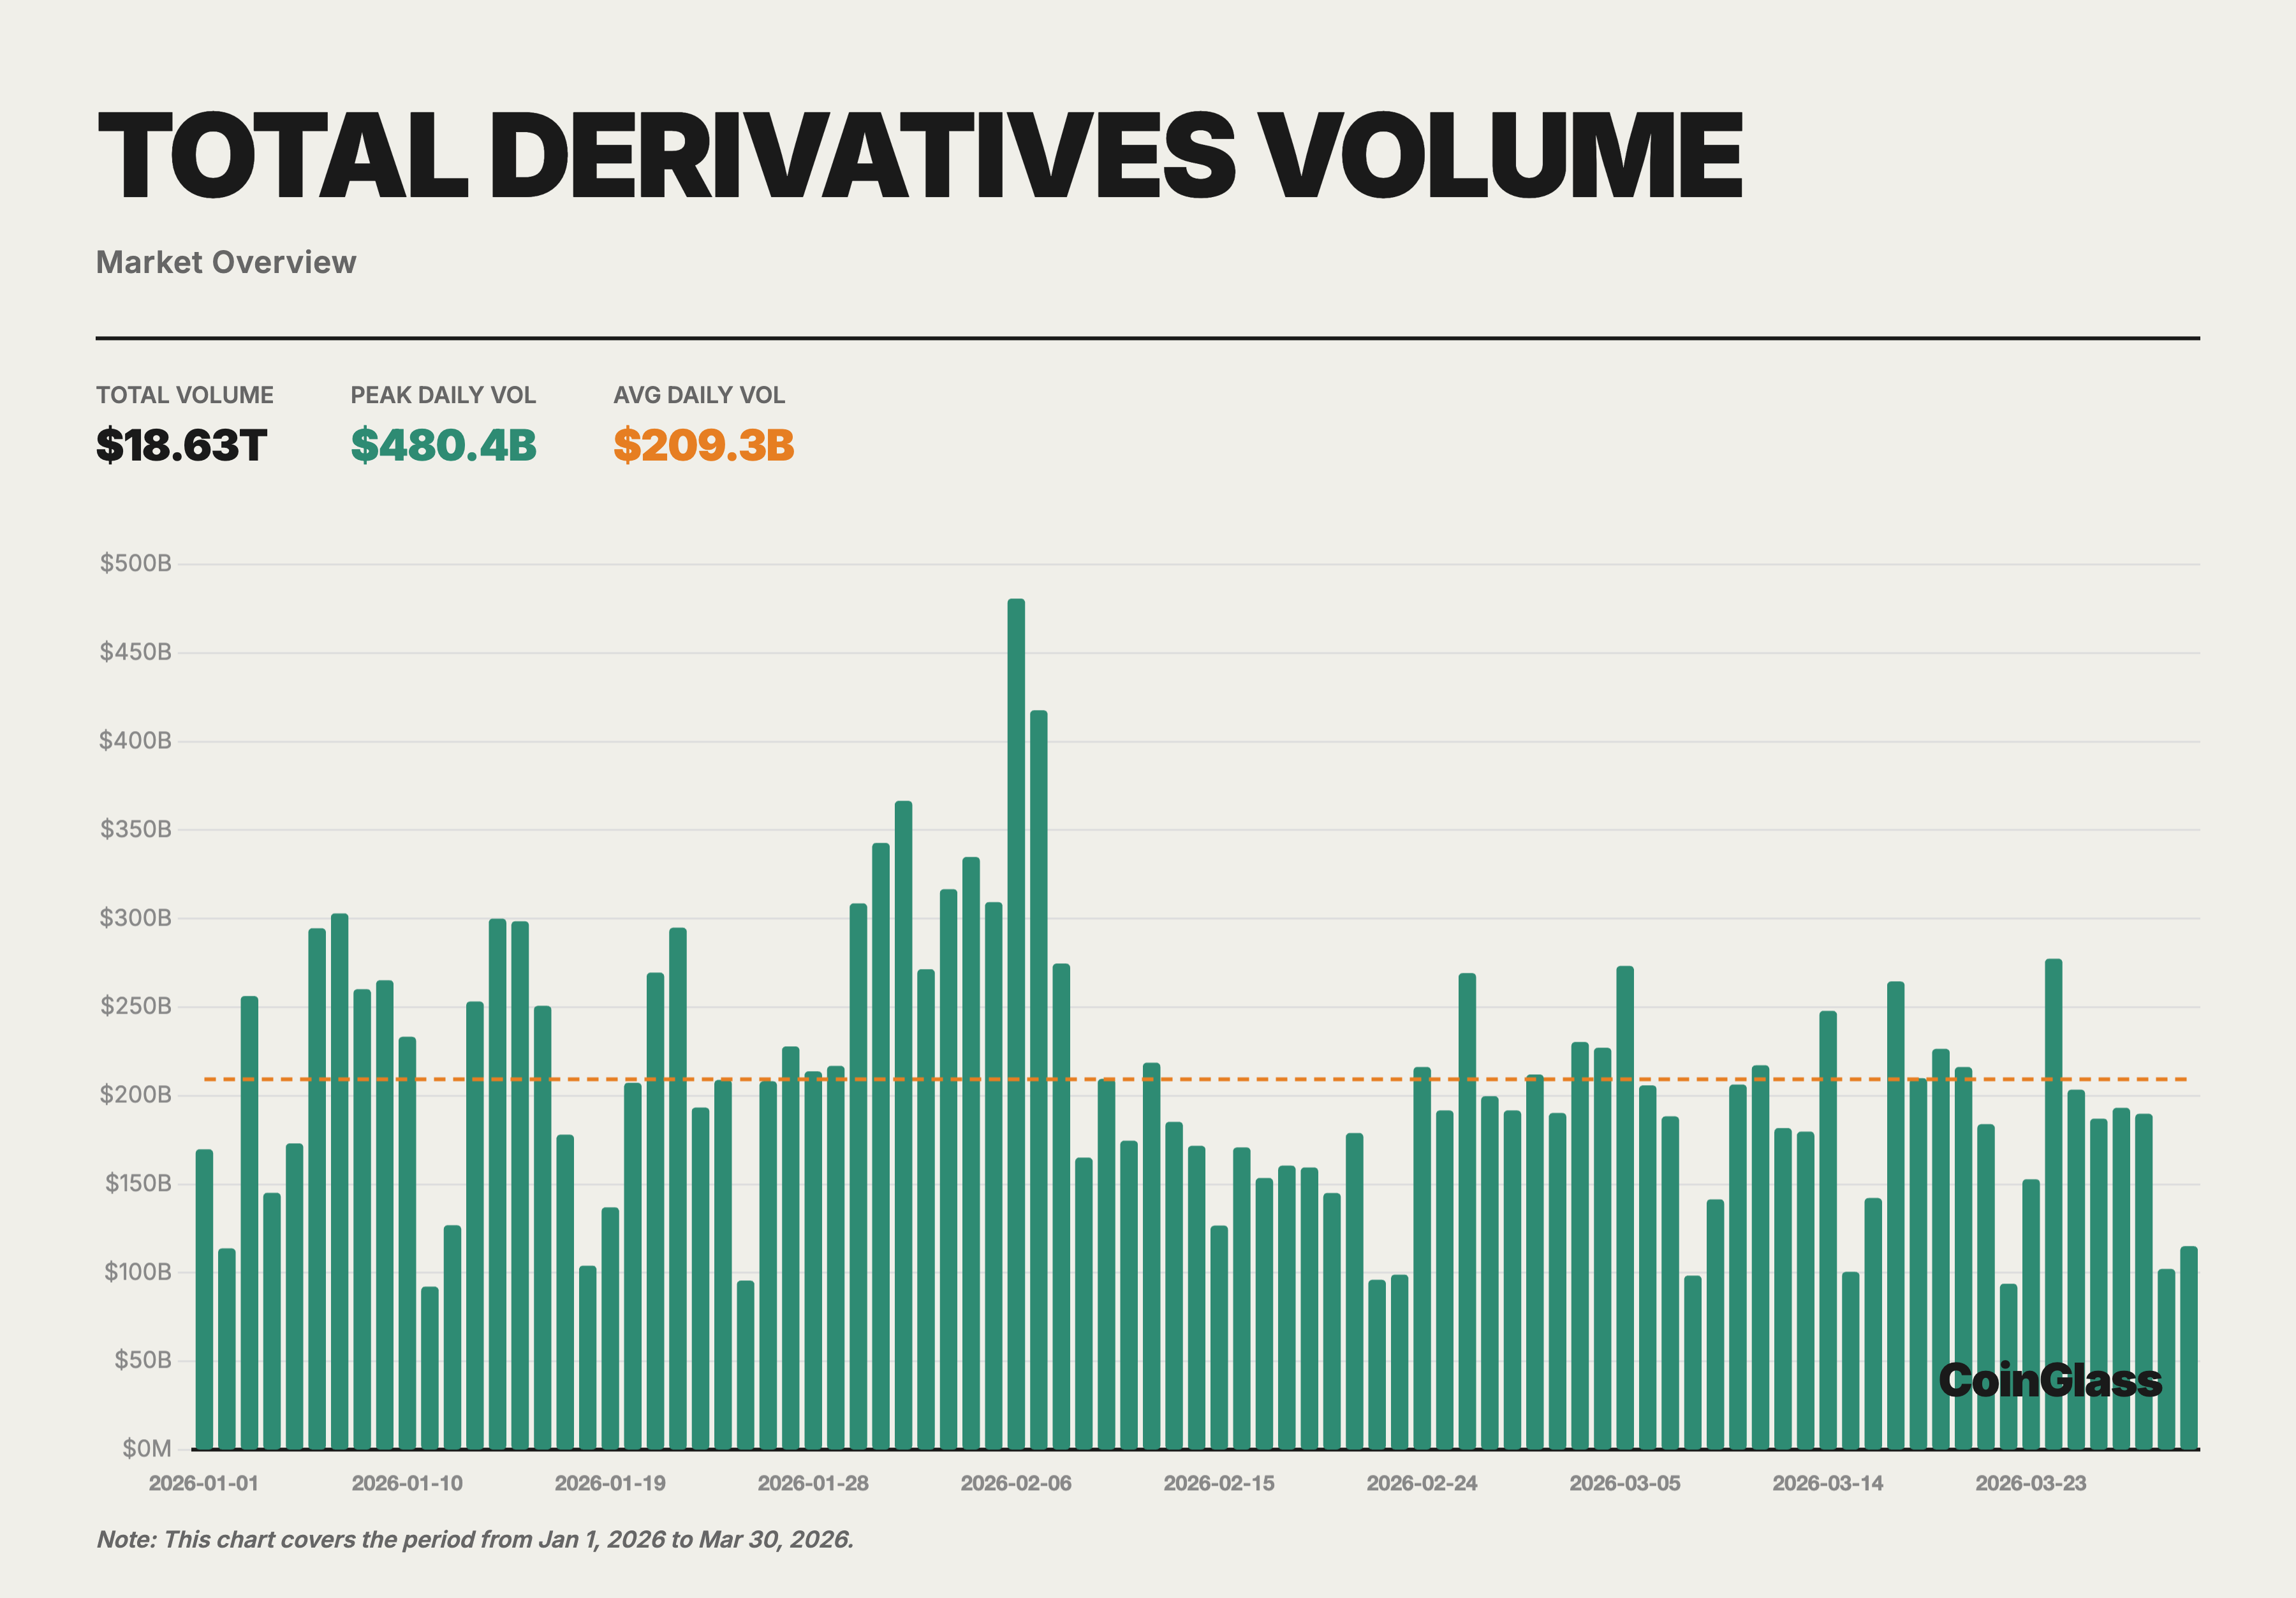
In Q1 2026, the total cryptocurrency trading volume (spot + derivatives) across the market was approximately $20.57 trillion, with spot trading at about $1.94 trillion and derivatives trading at around $18.63 trillion. Looking at the monthly distribution, total trading volume was highest in January (spot $704.7B + derivatives $6.73T), slightly declined in February, and further contracted to the quarterly low in March. This trend aligns with the cautious sentiment in the global macro environment during the same period, as market risk appetite had not fully recovered following the severe deleveraging in Q4 2025.
The average daily spot trading volume was about $21.8 billion, while the average daily derivatives volume was about $209.3 billion. The ratio of derivatives to spot volume remained stable at around 9.6x in Q1, slightly above the average level for the full year 2025. This indicates that during market adjustment phases, traders are more inclined to use derivatives for hedging and short-term speculation rather than making directional allocations in the spot market.
2.2 Spot Trading Volume and Market Share
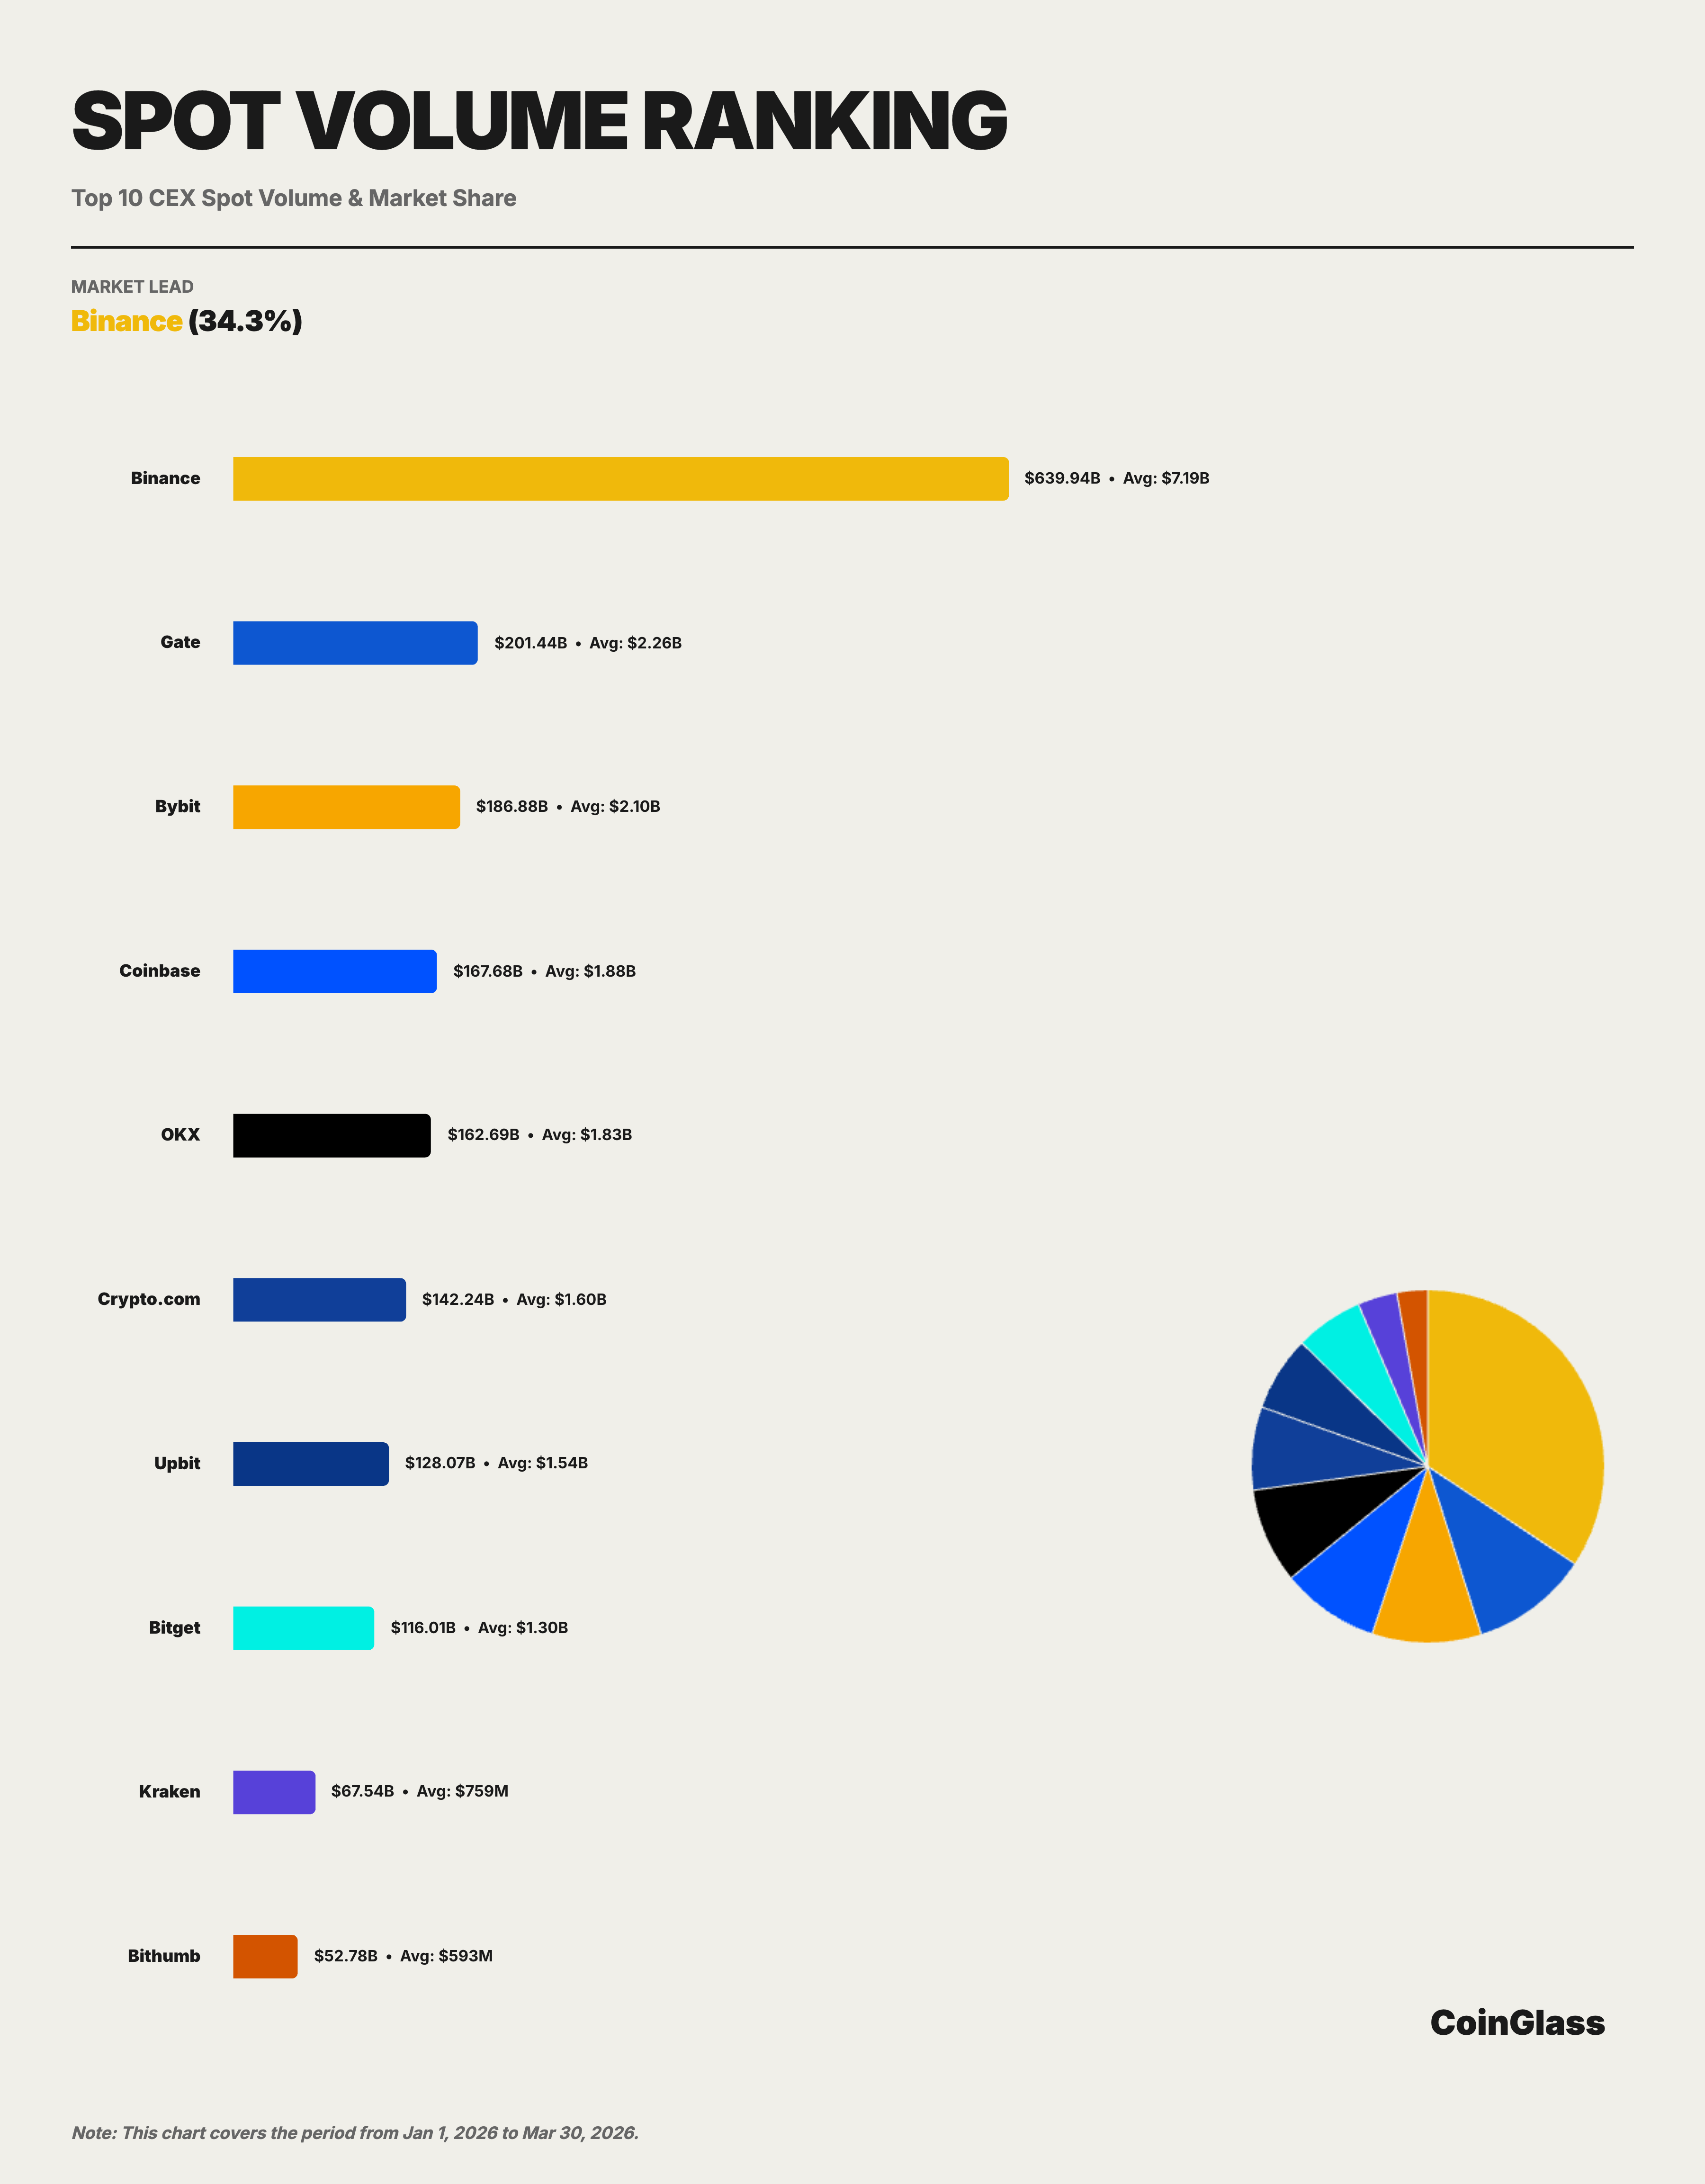
Binance’s cumulative spot trading volume in Q1 was approximately $639.9 billion, corresponding to an average daily volume of about $7.19 billion, with a market share of about 34.3% under the Top 10 exchange metric. Looking at the monthly trend, Binance’s share among the Top 10 spot exchanges remained generally stable: 34.0% in January 2026, 33.7% in February, and rebounding to 35.4% in March. Although the total market volume contracted from $704.7 billion in January to $542.0 billion in March, a 23% decline, Binance’s share actually increased slightly. This indicates that while the spot market as a whole retreated, top-tier liquidity continued to concentrate towards a few platforms.
Expanding the competitive landscape to the Top 5, the distribution in the spot market is noticeably more dispersed than in the derivatives market. The top five platforms by cumulative spot volume in Q1 were Binance, Gate, Bybit, Coinbase, and OKX, with volumes of approximately $639.9B, $201.4B, $186.9B, $167.7B, and $162.7B, respectively. Measured against the total market, aside from Binance, the other four platforms’ shares roughly fall within the 8% to 10% range. In other words, Binance’s leadership in the spot market is clear, but compared to the derivatives market, the distribution within the second tier of the spot market is more balanced and competition is more fragmented.
2.3 Derivatives Trading Volume and Market Share
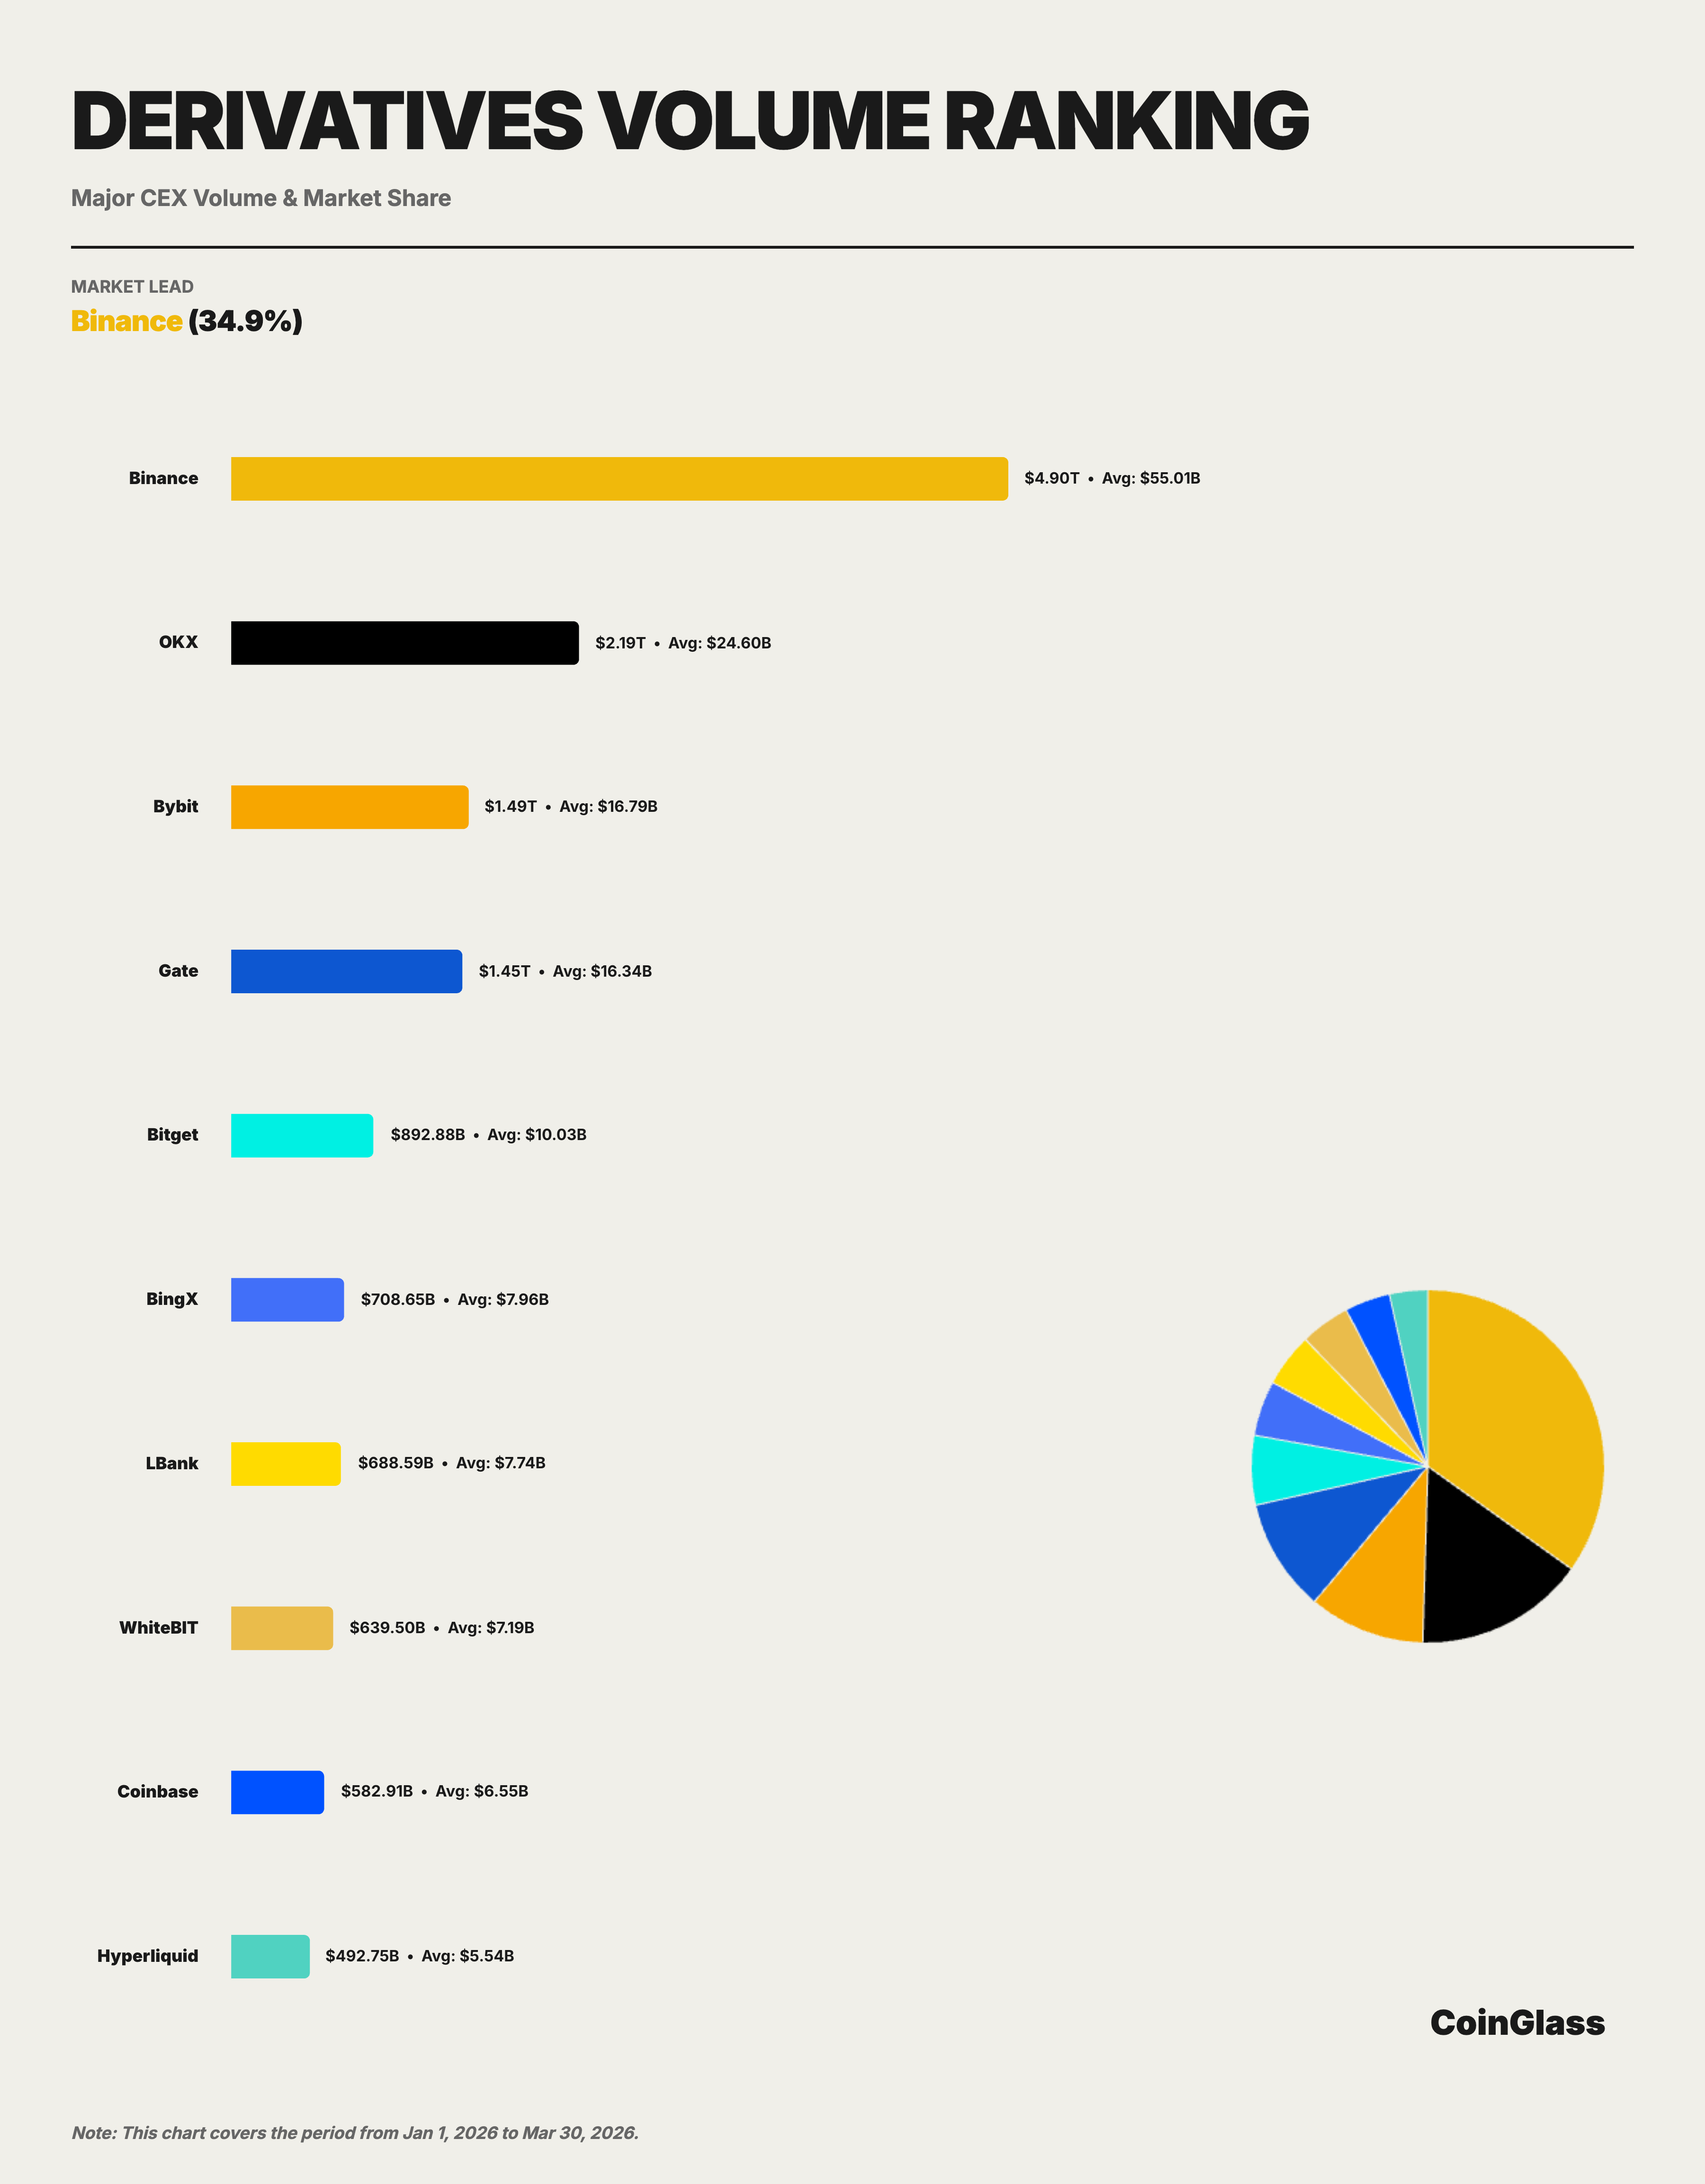
Binance’s cumulative derivatives trading volume in Q1 was approximately $4.90 trillion, with an average daily volume of about $55.0 billion. Under the Top 10 exchange metric, Binance firmly held the top position with a 34.9% share, and its trading volume exceeded the combined total of the second-place OKX ($2.19T) and third-place Bybit ($1.49T).
Looking at the monthly trend, Binance’s trading share among the Top 10 derivatives exchanges remained relatively solid: 33.2% in January 2026, rising to 35.8% in February, and maintaining 35.7% in March. This trajectory of decline followed by recovery aligns with the process of market liquidity returning to leading platforms after the deleveraging shock in Q4 2025. In other words, trading volume was briefly dispersed among platforms at the start of the quarter, but as the market stabilized, liquidity flowed back to platforms with greater depth and execution efficiency, with Binance demonstrating stronger absorption capacity during this recovery phase.
OKX is currently the centralized platform closest to Binance, but its trading scale is still only about 45% of Binance’s. Bybit and Gate are close in size, forming the middle of the second tier. While Bitget consistently ranks in the top five, a noticeable gap has emerged between it and the top four. In relative terms, Binance’s derivatives volume is about 3.3 times that of Bybit, 3.4 times that of Gate, and 5.5 times that of Bitget.
2.4 Competitive Landscape Comparison
Observing spot and derivatives markets within the same framework reveals clear differences in their competitive structures. In the spot market, Binance maintains the top position, but the second tier consists of Gate, Bybit, Coinbase, and OKX, with relatively close shares. In the derivatives market, Binance’s lead is larger, and a distinct hierarchy has also formed between the second-place OKX and the third and fourth places. This shows that Binance’s leadership in the derivatives market is more concentrated, while the spot market exhibits a structure of “a dominant leader with a fragmented second tier.”
From a platform positioning perspective, OKX firmly holds the second spot in derivatives trading volume, making it the closest challenger to Binance. Bybit and Gate are more closely competitive within the same tier; the former has strong participation among active global traders, while the latter maintains a high presence in terms of trading volume and open interest. Platforms like BingX, لبنك, WhiteBIT, Coinbase, and Hyperliquid, which rank after the Top 5, still maintain considerable trading activity, but their overall scale remains distinct from the top five.
Notably, decentralized derivatives platforms have entered the mainstream comparison. Hyperliquid’s Q1 derivatives trading volume was approximately $492.7 billion, placing it within the top ten, and its average open interest reached about $6.0 billion. This means on-chain derivatives are no longer just a marginal supplement but are beginning to form actual competition in specific market segments. However, based on current scale, their overall volume remains significantly lower than leading centralized platforms like Binance, OKX, Bybit, and Gate.
3. Derivatives Open Interest
3.1 Market-wide Total Open Interest Trend
In Q1 2026, the average daily open interest (OI) for derivatives across the market was approximately $117.2 billion, with the quarterly peak occurring on January 15th, reaching about $152.5 billion. Looking at the monthly trend, the average daily OI was about $141.1 billion in January, dropped significantly to $102.6 billion in February (a ~27% decline), and slightly recovered to $106.0 billion in March.
3.2 OI Share and Ranking Changes
Binance’s average OI in Q1 was approximately $23.9 billion, corresponding to a 29.9% share among Top 10 exchanges, ranking first. Positions two to five were Bybit, Gate, OKX, and Bitget, with average OIs of about $11.0B, $10.8B, $6.8B, and $6.4B, respectively. Binance’s average OI was about 2.2 times that of Bybit, 2.2 times that of Gate, 3.5 times that of OKX, and 3.7 times that of Bitget, indicating a clear lead.
Binance’s OI share remained within the 20%–21% range (market-wide) throughout the quarter, with limited fluctuation, showing its market position in terms of open interest is fundamentally stable. More notably, Binance’s peak OI was about $32.1 billion, approximately 2.2 times that of the second-place Bybit’s peak ($14.5 billion), demonstrating Binance’s ability to absorb more positions during periods of heightened market volatility.
3.3 Market Structure Analysis
The structure of the open interest market exhibits characteristics different from trading volume. In terms of trading volume, Binance leads the second place by over 19 percentage points. However, in the open interest dimension, the gaps between Binance (29.9%), Bybit (13.8%), Gate (13.4%), and OKX (8.5%) have narrowed. This reflects that different platforms have their own competitive advantages in attracting long-term positions.
Hyperliquid’s open interest scale deserves special attention. Its average daily OI is about $6.0 billion, with a peak nearing $9.7 billion, which is close to Bitget’s and higher than platforms like WhiteBIT and BingX. The growth of on-chain platforms in the open interest dimension indicates their increasing appeal for high-leverage and strategic trading. In the short term, this trend is not enough to challenge Binance’s leading position, but for second-tier platforms, the entry of on-chain competitors is increasing the complexity of future share competition. As an on-chain derivatives protocol, its rapid growth in open interest further validates the assessment from the 2025 annual report regarding “decentralized derivatives transitioning from proof-of-concept to actual market share competition.”
4. Liquidity Depth
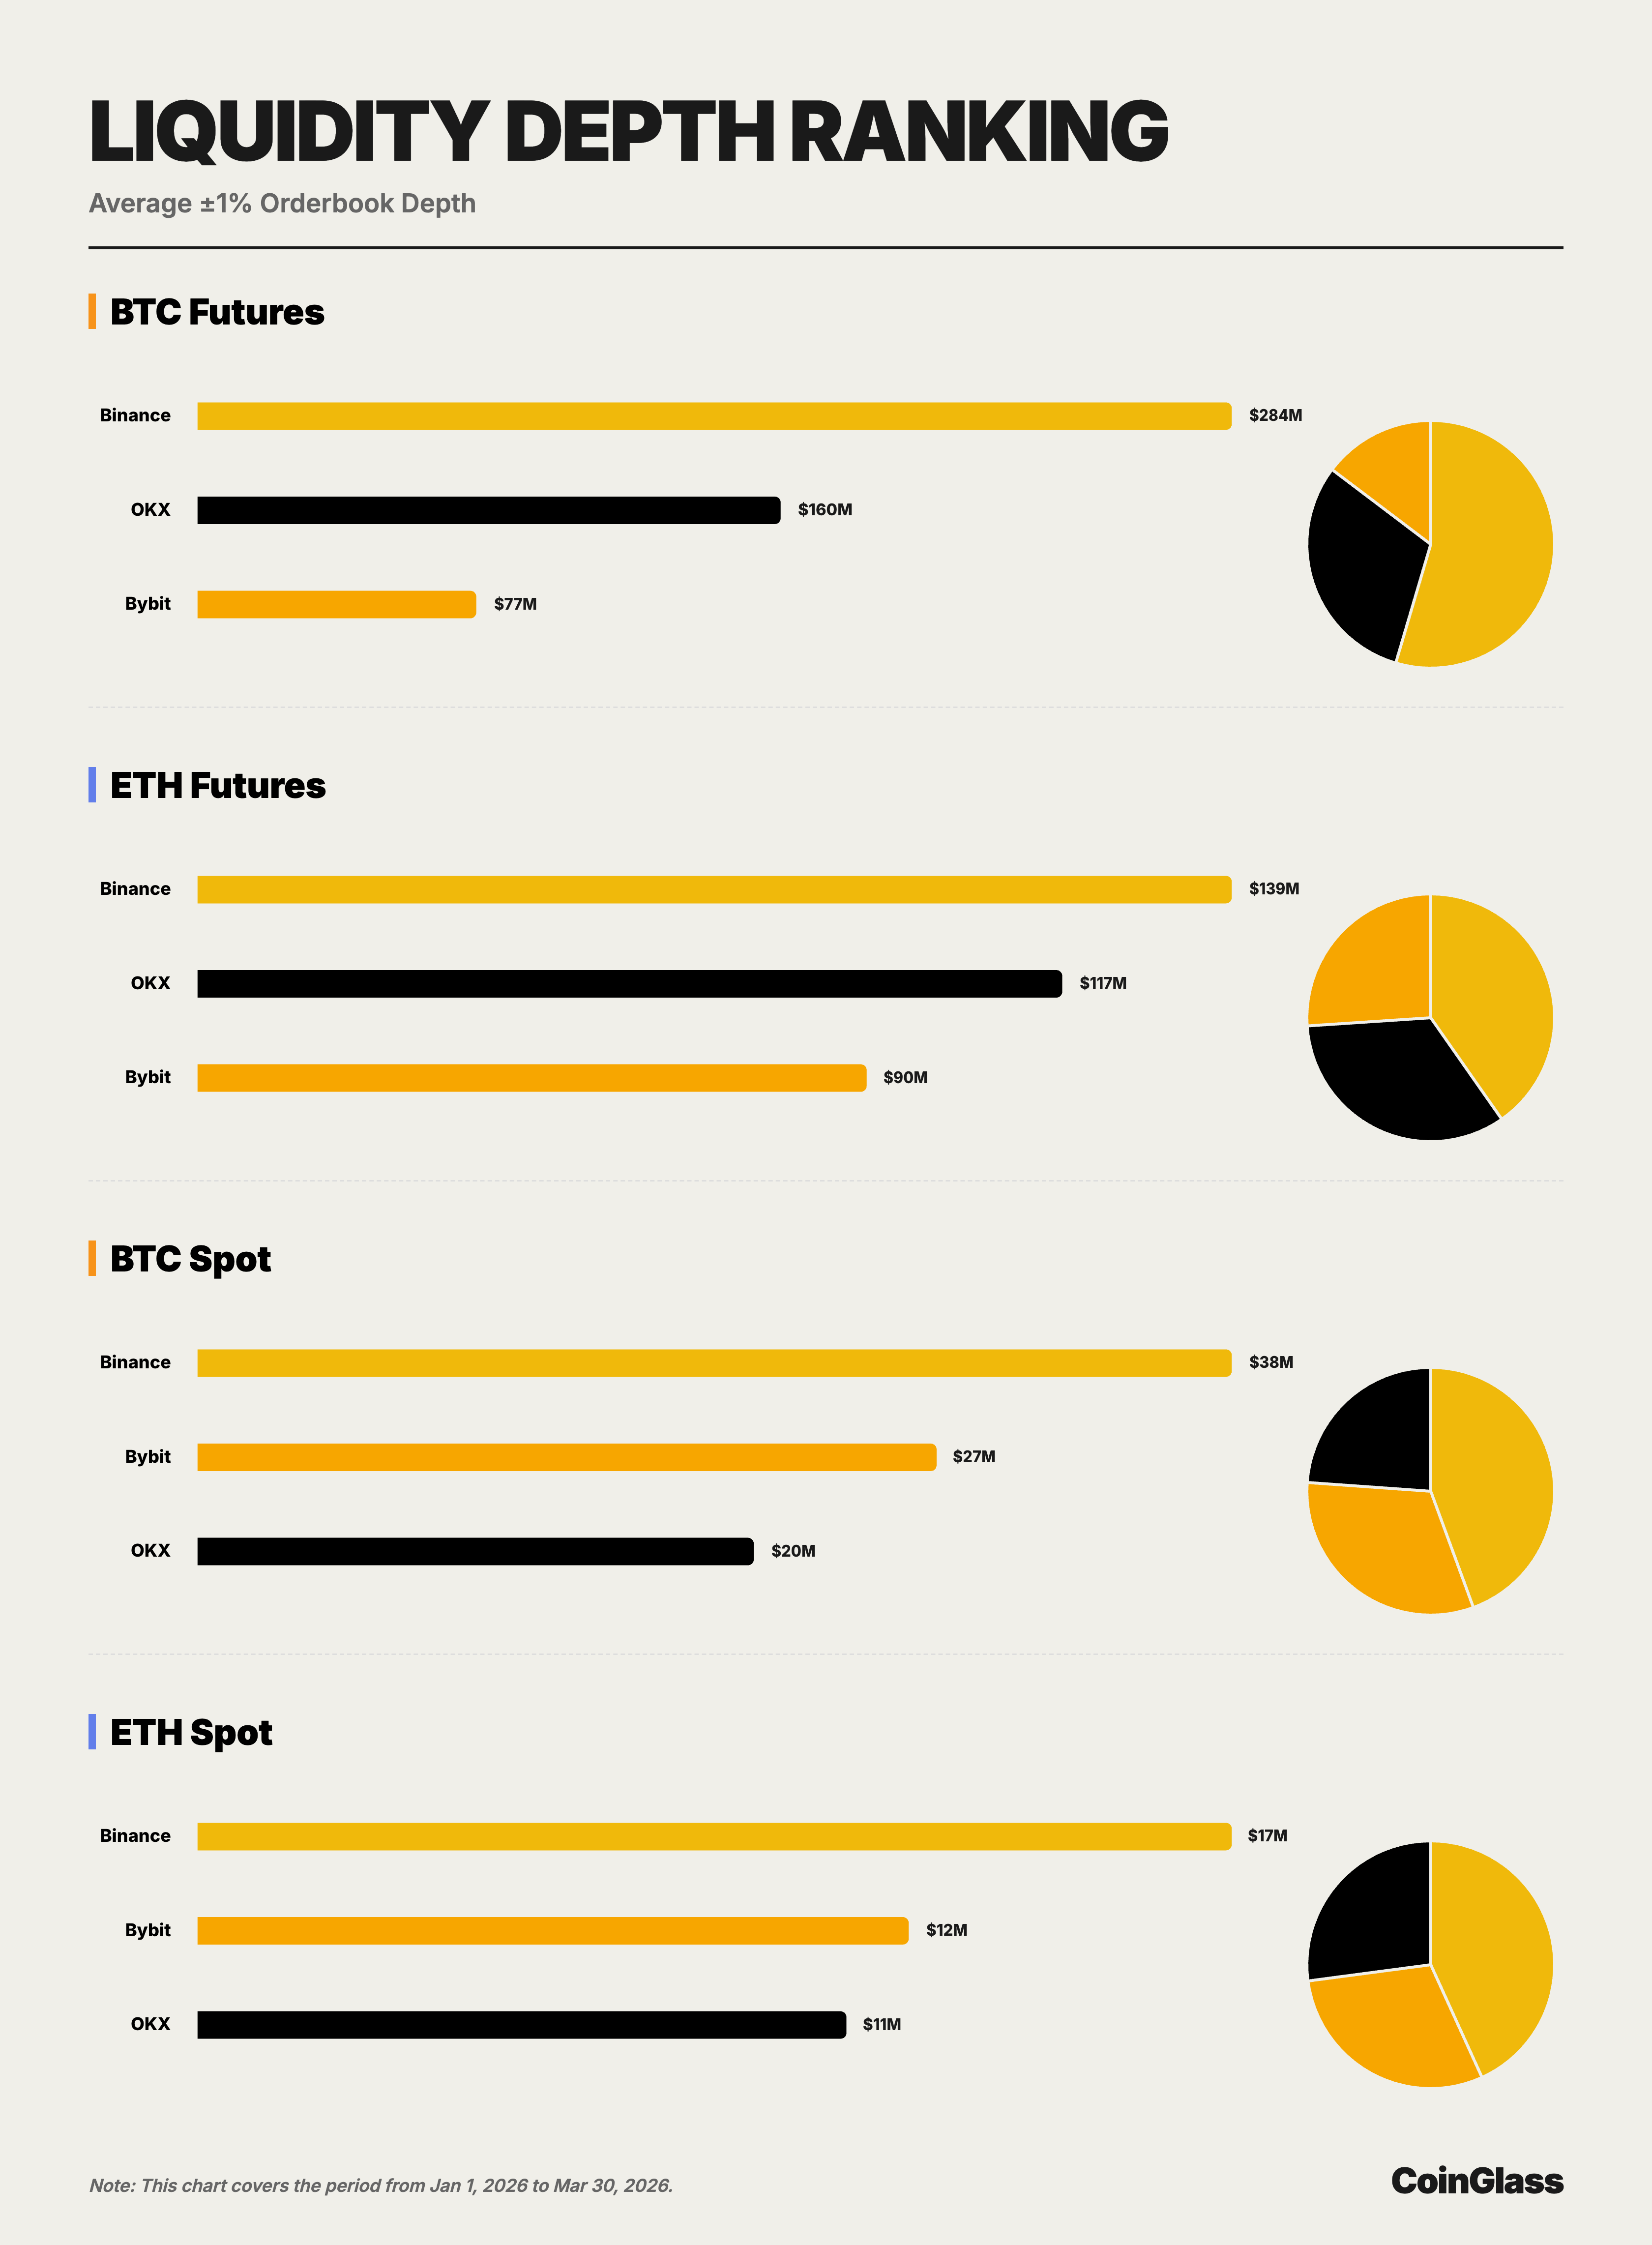
This chapter’s data is based on order book snapshot data, comparing the ±1% bilateral depth for BTC and ETH in spot and perpetual markets across major platforms. Compared to trading volume and OI, depth more directly reflects a platform’s actual capacity to execute large trades, making it a key basis for judging whether a leading platform’s “qualitative leadership” holds true.
4.1 BTC Market Depth
In the BTC perpetual market, the average ±1% bilateral depth for Binance, OKX, and Bybit is approximately $284 million, $160 million, and $76.55 million, respectively. Binance’s depth is about 1.8 times that of OKX and 3.7 times that of Bybit, maintaining a significant lead. From an institutional trading perspective, this means Binance can accommodate larger order sizes in the BTC perpetual market without excessively amplifying impact costs, giving its liquidity advantage direct execution value.
In the BTC spot market, the average ±1% bilateral depth for Binance, Bybit, and OKX is approximately $37.54 million, $26.82 million, and $20.18 million, respectively. Unlike the perpetual market, the second place in BTC spot is held by Bybit, not OKX, but Binance still leads Bybit by about 40% and OKX by about 86%. This indicates that Binance holds the top position in both the BTC spot and perpetual markets, the two most critical liquidity pools, while the second-place platform varies across different sub-markets.
4.2 ETH Market Depth
In the ETH perpetual market, the average ±1% bilateral depth for Binance, OKX, and Bybit is approximately $139 million, $117 million, and $90.15 million, respectively. Compared to the BTC perpetual market, the competition at the top of the ETH perpetual market is closer, with OKX trailing Binance by only about 16% and Bybit trailing by about 35%. Even so, Binance maintains the top spot, indicating its leadership extends beyond the single asset of BTC and continues into the ETH perpetual market.
In the ETH spot market, the average ±1% bilateral depth for Binance, Bybit, and OKX is approximately $16.84 million, $11.58 million, and $10.57 million, respectively. Similar to the BTC spot market, the second place is held by Bybit, but Binance leads Bybit by about 45% and OKX by about 59%. The result shows that Binance ranks first in all four core sub-markets, while the second place alternates between OKX and Bybit, further illustrating that Binance’s advantage is broader and not concentrated in any specific asset or market.
4.3 Relationship Between Depth and Trading Volume
From an execution capability perspective, depth is often a better measure of a platform’s true liquidity quality than trading volume. Q1 data shows that Binance not only leads in spot and derivatives trading volume but also possesses the best depth in the primary trading scenarios for both BTC and ETH. OKX is more competitive in perpetual depth, and Bybit’s spot depth performance is closer to the top tier. However, no platform currently exerts comprehensive pressure on Binance across all four core sub-markets simultaneously, indicating that Binance’s leadership has strong structural stability.
5. User Asset Holdings
5.1 Asset Reserve Scale and Trend
In Q1 2026, Binance’s average daily custodial assets were approximately $152.9 billion, accounting for about 73.5% of the share among Top 10 exchanges. This proportion is significantly higher than Binance’s market share in trading volume (~34.9%) and open interest (~29.9%), indicating that concentration at the capital custody layer is markedly higher than at the trading activity layer. For exchanges, user asset holdings are typically related to brand trust, product ecosystem, on/off-ramp convenience, and cross-business usage scenarios, making this metric a better reflection of a platform’s comprehensive competitive position over the medium to long term.
Looking at the monthly trend, Binance’s custodial assets experienced a decline followed by stabilization in Q1. The average daily amount in January was about $172.7 billion, the quarterly high, reflecting capital inflows amid optimistic market sentiment at the start of the year. It fell to about $136.4 billion in February, a decline of approximately 21%, consistent with the downward trend in OI during the same period. It slightly recovered to about $147.8 billion in March, indicating the capital outflow trend had largely stabilized. The quarterly peak occurred on January 15th, at approximately $182.1 billion.
The Top 5 platforms are Binance, OKX, Gate, Bitget, and Bybit, with corresponding average user assets of about $152.9B, $15.9B, $6.8B, $6.7B, and $5.6B. In other words, among major CEXs, only OKX maintains a level above $10 billion, while platforms ranked third to fifth are concentrated in the $5-7 billion range, overall presenting a pattern of “the first place significantly leads, the second place follows, and the remaining platforms are relatively close.”
5.2 Comparison of Asset Holdings Among Mainstream CEXs
Market concentration in the user asset holdings dimension is far higher than in trading volume and open interest. Among Top 10 exchanges, Binance dominates with $152.9 billion, while the second-place OKX’s average daily $15.9 billion is only one-t
هذا المقال مصدره من الانترنت: CoinGlass: Q1 2026 Cryptocurrency Market Share Research Report
On-chain treasuries have surpassed $4B+, growing more than threefold in a year. BlackRock’s BUIDL fund attracted hundreds of millions of dollars in a single quarter. Franklin Templeton and HSBC are entering the space. RWA TVL is one of the few metrics still rising in this bear market. But then you look at the tokens of these projects—almost all in the red, and deep red at that. Some have fallen over 90% from their highs. Why? Some would say: retail can’t get in. This answer is half right, but it’s outdated. There are already projects in the market solving this—just register, and retail users can also participate in RWA yields. The gate for user access has been opened. But the token price is still falling. I believe many RWA projects have…