








Bitcoin bulls and bears are fighting over a key level, HYPE rebound signal emerges | Analyst Special
Summary of key trading views for this week:
- BTC multi-timeframe trend structure analysis (see Part 1 for details)
- BTC price forecast for this week and medium/short-term trading strategies (see Part 2 for details)
- HYPE daily-level trend structure analysis (see Part 3 for details)
- HYPE price forecast for this week and short-term trading strategies (see Part 4 for details)
市场 validation of last week’s trading strategies and core views:
- BTC market assessment validation: Last week’s article emphasized that the probability of the daily short-term (wave b) correction concluding above the $60,900–$61,500 zone was significant. As things stand, the actual market movement has been highly consistent with our forecast.
- BTC short-term trade results: Last week, Bitcoin completed one short-term long trade (1x leverage), successfully realizing a gain of approximately 2.28%. (See Part 5 for details)
- HYPE market assessment validation: Last week we judged that the probability of the price stabilizing in the $50–$52 zone was relatively high, and current live market movement has effectively validated this view.
1. Bitcoin Multi-Timeframe Trend Structure Analysis
1. Bitcoin daily-level trend structure analysis: (based on price action after May 6)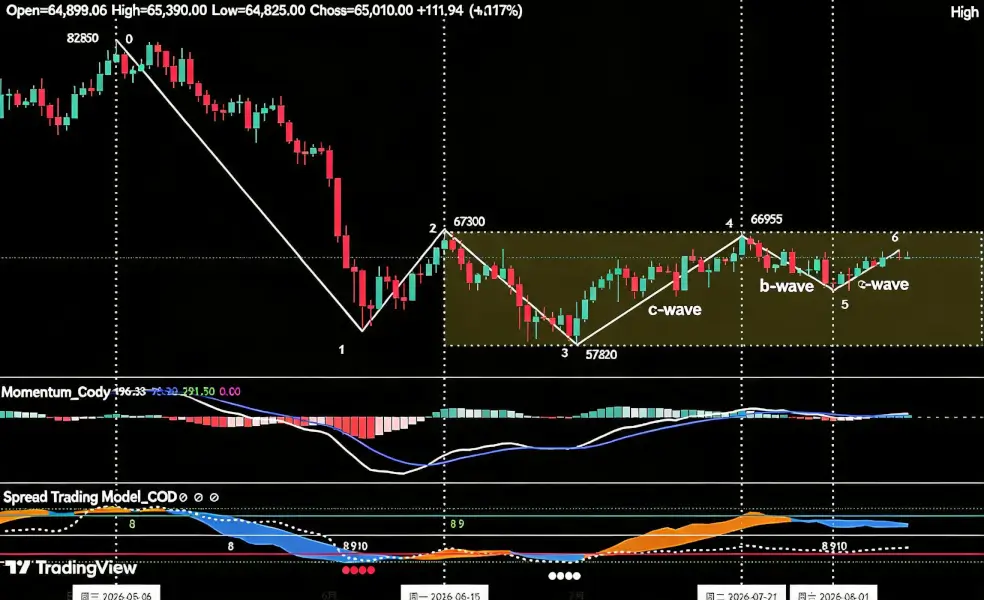
Figure 1: Bitcoin daily K-line chart
① As shown in (Figure 1): Since the correction that began at the May 6 high of $82,850, the daily chart has displayed a six-segment correction structure: (0-1), (1-2), (2-3), (3-4), (4-5), and (5-6).
② Analysis from the daily structure: (from the July 1 low rebound to date)
- Wave a rebound: (July 1 – July 21) Started from $57,820, lasting 21 trading days, reaching a high of $66,955, with a range gain of 15.8%.
- Wave b correction: (July 21 – August 1) Pulled back from $66,955 to $62,268, lasting 11 trading days, with a maximum drawdown of 7%.
- Wave c rebound: (August 1 – present) Started from $62,268 and has been running for 8 trading days as of now.
③ Based on our proprietary quantitative model analysis: the daily wave b correction has concluded at $62,268, and the wave c rebound has officially begun. The primary target for this leg is the $67,300 resistance zone. If an effective breakout occurs, the next target would be the $69,500–$71,000 zone.
2. In-depth analysis of Bitcoin’s hourly-level trend structure: (using the 4-hour chart as the analysis timeframe)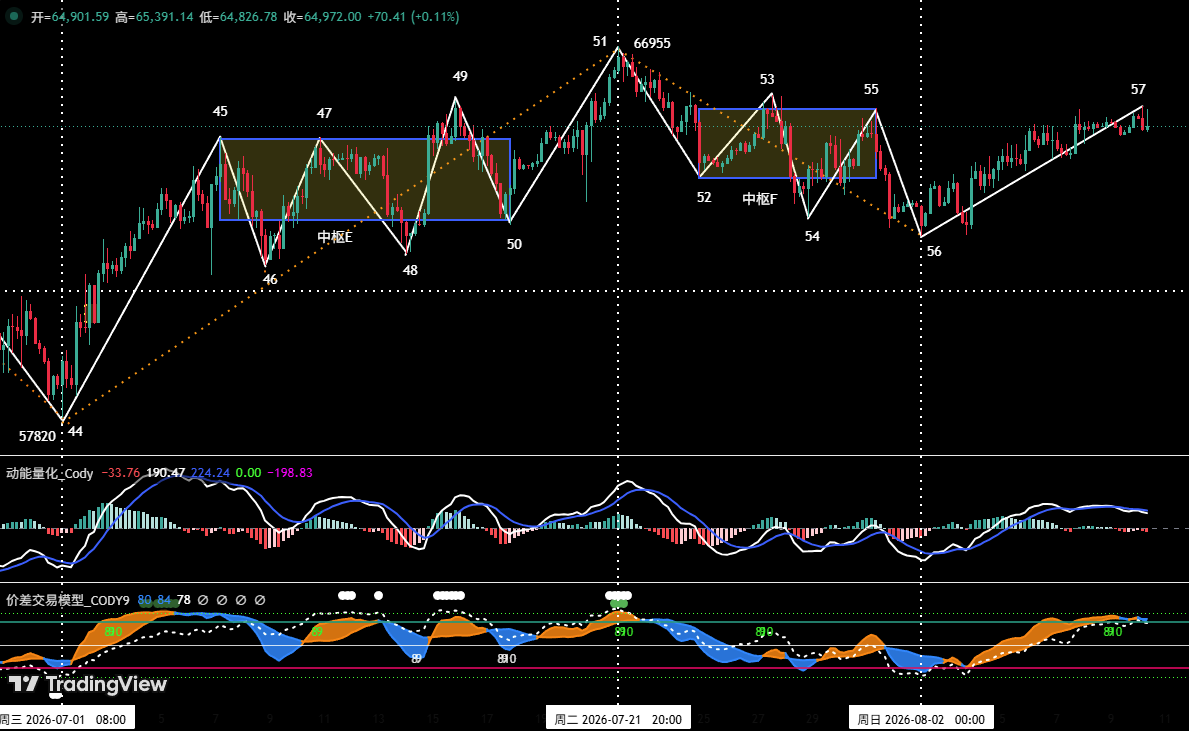
Figure 2: Bitcoin 4-hour K-line chart
① The daily wave b correction from $66,955 to $62,268 can be clearly broken down into five segments on the 4-hour chart, from (51-52) to (55-56). Among these, segments (52-53), (53-54), and (54-55) overlap, forming pivot F.
② The daily wave c rebound that started from $62,268 maps to the 4-hour (56-57) upward segment. It has run for 49 (4-hour) periods so far, with the rebound high reaching around $65,474. Measured from the dimensions of time and space, the structure remains intact and the rebound momentum is relatively strong.
2. Bitcoin Price Forecast and Trading Strategy for This Week
1. BTC price forecast for this week: Core view for this week: closely monitor the long-short battle as the daily wave c rebound approaches the $65,700–$67,300 zone.
2. Key resistance levels:
- First resistance zone: $67,300 area (former key resistance zone)
- Second resistance zone: $69,500–$71,000 area (former key resistance zone)
3. Key support levels:
- First support level: $63,600–$64,000 zone (former key support level)
- Second support level: $60,950–$61,500 zone (former key support level)
- Third support level: near $57,820 (former key support level)
4. Trading strategy for this week (excluding unexpected news impacts)
① Medium-term strategy: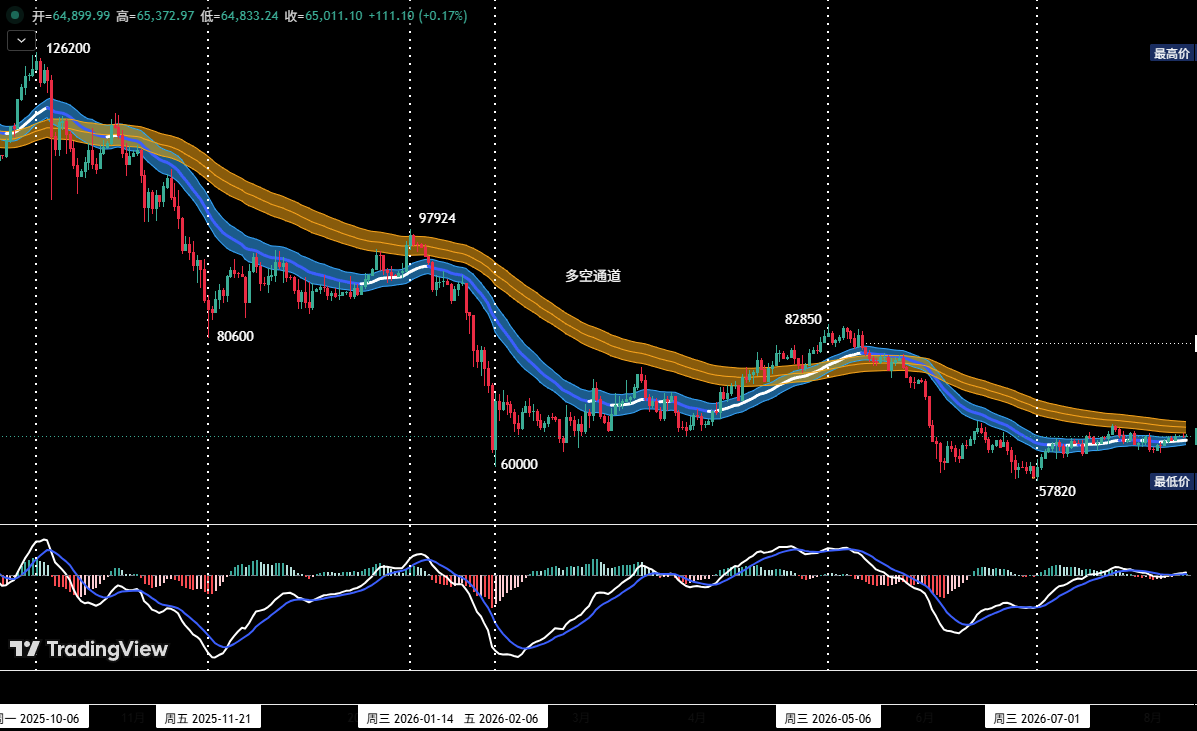
Figure 3: Bitcoin daily K-line chart: (position monitoring model)
Position monitoring model: As shown in (Figure 3), the current price has effectively broken below the “long-short channel,” confirming a shift in market structure to a bearish-dominated regime.
- Per last week’s trading plan: “If the price effectively holds above $63,600 and launches a sustained rebound, the medium-term short position will be reduced to below 20%.” Accordingly, positions have already been reduced to below 20% as required by the plan.
- If the price effectively breaks through the $67,300 resistance this week and shows clear signs of stalling in the $69,500–$71,000 zone, combined with signals from the quantitative model, the medium-term short position will be increased to around 50%.
② Short-term strategy: Use 30% of position, set stop-loss levels, and look for “spread trading” opportunities based on support and resistance levels. (Use 30-minute/60-minute charts as the operating timeframe.)
③ For short-term operations, to dynamically respond to complex market developments, we have prepared two specific action plans, A and B, in advance.
Plan A: Tentative short at strong resistance zone
- Entry: If the price effectively breaks above the $67,300 resistance this week and shows clear stalling signals in the $69,500–$71,000 zone, combined with quantitative model signals, a short position of approximately 30% can be established.
- Risk management: Set an initial stop-loss.
- Exit: When the price pulls back near key support levels, combined with quantitative model signals, positions can be gradually closed to lock in profits.
Plan B: Light long position at strong support zone
- Entry: If the price spikes higher and then pulls back, and shows signs of stabilization in the $63,600–$64,000 zone, combined with bottom signals from the quantitative model, a long position of approximately 15% can be established.
- Risk management: Set an initial stop-loss.
- Exit: When the price rebounds near key resistance levels, combined with model signals, positions can be gradually closed to lock in profits.
3. HYPE Daily-Level Trend Structure Analysis
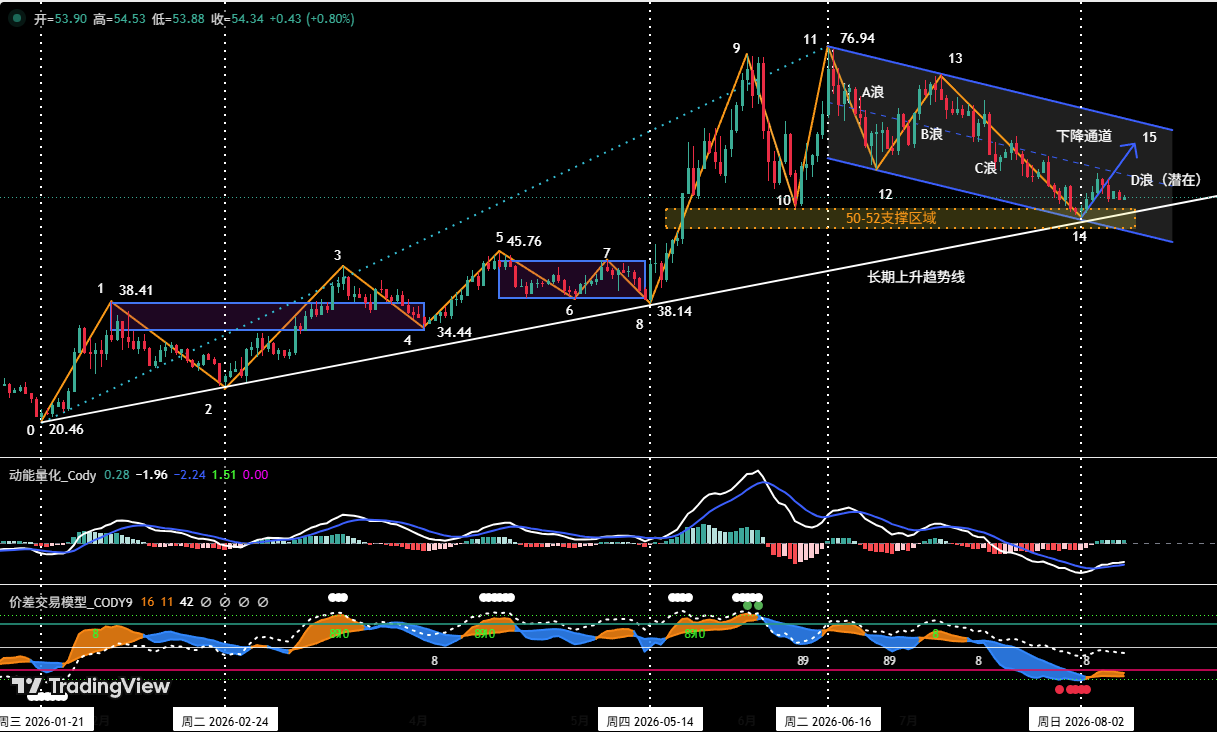
Figure 4: HYPE daily K-line chart
1. The daily structure shows that HYPE’s pullback, which began at the June 16 high of $76.94, is currently running within a clearly 定义ned descending channel (blue): the upper boundary connects the June 16 and July 7 highs, while the lower boundary runs parallel to the upper boundary and extends through the June 25 low.
2. Since the daily uptrend began on January 21, HYPE has established a long-term daily ascending trendline (white), which connects the January 21 low (validated on February 24) with the May 14 low.
3. As shown in (Figure 4): the price pulled back on August 2 to a confluence of three technical support levels: the long-term ascending trendline, the lower boundary of the descending channel, and the key $50–$52 support zone. With the resonance of these three supports, the probability of a daily-level rebound forming at this level has increased significantly.
4. HYPE Price Forecast and Short-Term Trading Strategy for This Week
1. HYPE price forecast for this week:
① Key resistance levels:
- First resistance zone: $58.5–$60 area
- Second resistance: near the upper boundary of the descending channel
- Third resistance: near $72.97
② Key support levels:
- First support: $50–$52 zone
- Second support: near $45
Core view for this week: focus on tracking the long-short battle as the price rebounds toward the upper boundary of the descending channel. Whether this level can be effectively broken will directly determine the nature of this upward move: a technical rebound or a trend reversal.
2. HYPE short-term trading strategy for this week:
Short-term operations this week:
① For those holding long positions: investors who established long positions in the $50–$52 zone per last week’s trading plan should set stop-losses and strictly adhere to them while holding for further upside.
② For those with no positions: if the price retests the $50–$52 zone at the start of the week and shows signs of stabilization, a light long position may be considered, with strict adherence to stop-loss discipline.
5. Bitcoin Short-Term Trade Review
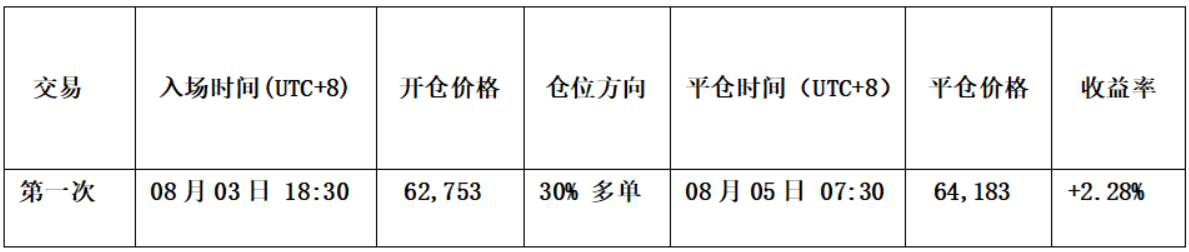
Strictly following our action plan, based on trading signals from our proprietary “Spread Trading Model” and “Momentum Quantitative Model,” we completed one short-term (long) trade last week, with total trading profit of approximately 2.28%.
1. Short-term trade record: (see Table 1)
Bitcoin short-term trade details summary: (leverage: 1x)
 2. Short-term trade review: (see Figure 5)
Entry strategy:
- a. When the price declined to just above $62,000 and showed signs of stabilization, the K-line formed a “bottom fractal” pattern;
- b. The “Spread Trading Model” triggered a bottom warning signal (red dot), and then the signal band (orange-yellow) in the chart broke above the horizon line (magenta), issuing an upward signal. This was simultaneously accompanied by a bottom signal from the “Momentum Quantitative Model.” Therefore, we established a 30% long position at $62,753.
Exit strategy:
- a. When the price rose to around $65,000 and showed signs of stalling, the K-line formed a “top fractal” pattern;
- b. The “Spread Trading Model” triggered consecutive top warning signals (white dots), and then the signal band (blue) in the chart broke below the skyline (green), forming a top resonance signal with the “Momentum Quantitative Model.” Therefore, we closed the entire position at approximately $64,183.
- Summary: This trade achieved a successful profit of approximately 2.28%.
6. Special Notes:
- At entry: immediately set an initial stop-loss.
- When profit reaches 1%: move the stop-loss to the entry cost price (break-even point) to protect principal.
- When profit reaches 2%: move the stop-loss to the 1% profit level.
- Continuous tracking: thereafter, for every additional 1% profit, the stop-loss moves up by 1% accordingly, dynamically protecting and locking in gains.
The financial markets change rapidly, and all market analysis and trading strategies require dynamic adjustment. All views, analytical models, and trading strategies presented in this article are derived from personal technical analysis and serve solely as a personal trading journal. They do not constitute any investment advice or basis for trading decisions. 市场 risk is high; invest with caution. Please do not make decisions based solely on this content.
本文来源于互联网: Bitcoin bulls and bears are fighting over a key level, HYPE rebound signal emerges | Analyst Special
On the evening of June 30, Beijing time, the emergence of a new stablecoin once again stirred the landscape of the stablecoin market. A company named Open Standard announced the launch of a stablecoin called Open USD, featuring free minting and redemption, sharing of reserve asset returns, and joint governance by partners. These open designs directly address pain points in stablecoin distribution and appear highly attractive. What surprised the market most was that Open Standard had already “secured” over 140 partners before the stablecoin’s launch. This list includes several companies that have already issued stablecoins, such as Western Union, Ripple, MetaMask, and Aave. Gathering signatures from so many giants in both the Web3 and traditional finance sectors before the stablecoin’s issuance left the market both surprised and full of expectations…































 简体中文
简体中文  English
  繁體中文
繁體中文