Translated by: @0xBenniee
For the vast majority entering the 加密 space, the sole purpose is that it’s one of the few places left where ordinary people can truly take control of their financial destiny. Most come here chasing “life-changing trades” and profits, not just out of a passion for the underlying technology.
But the problem is: the game is rigged with only one intended winner – the 市场 Makers.
This article will thoroughly dismantle how this manipulation works, the tools you need to identify it early, and how to avoid becoming “exit liquidity.” All conclusions are based on real-world cases of multiple manipulated tokens over the past 7 months.
Two Scripts, One Ending
Not all “criminal pumps” follow the exact same playbook. After studying 7 manipulated tokens over 7 months, we discovered two distinct patterns. Both rely on low-float tokens on Binance and ultimately end with retail/exchange losses, but the underlying mechanisms for extracting funds are fundamentally different.
MYX: The Squeeze
Phase 1 — Set Up
According to CoinMarketCap historical data, the “big move” that eventually pushed MYX to $19 began around late August 2025. It broke out from below $0.10 to around $1.20, then continued climbing into the several-dollar range over subsequent weeks.
Deep analysis of this rally reveals it was orchestrated by 6 wallets: they executed 2,240 small buy orders on PancakeSwap, accumulating a total of $3.92 million worth of MYX tokens, which were then consolidated into a deposit address on a centralized exchange.
Research on Arkham also found that during August-September 2025, multiple wallets systematically injected USDT into MYX liquidity pools using a “rotation pattern”: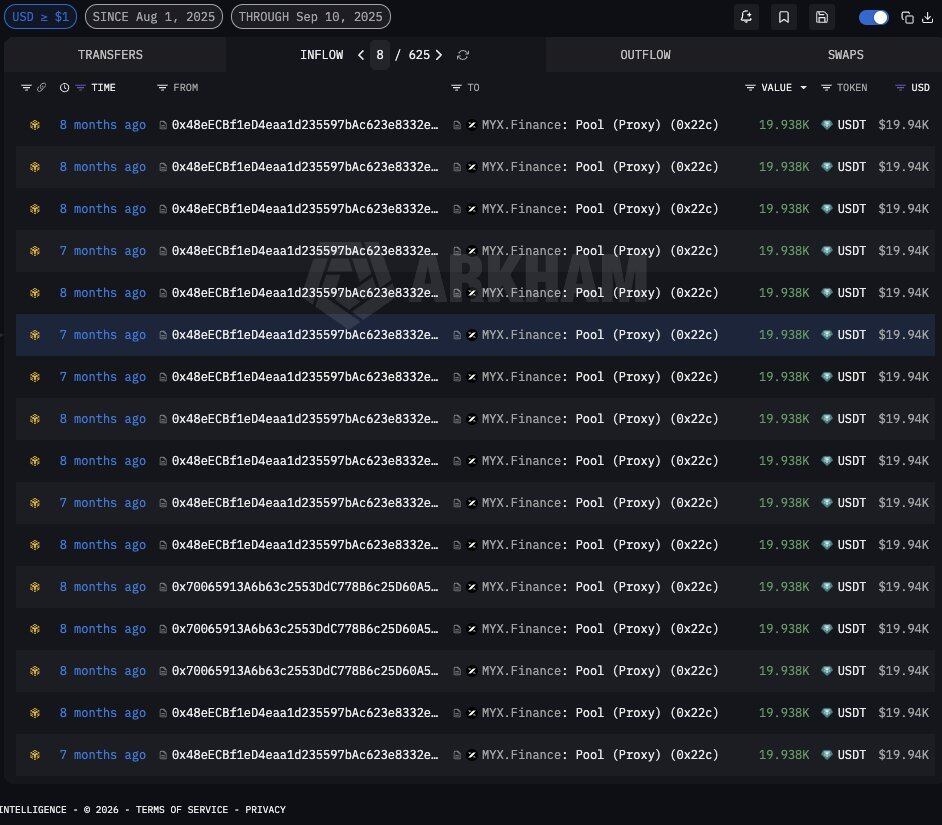
- Wallet 1 injected funds in batches of $90k–$108k;
- Wallet 2 injected funds in batches of $20k–$67k;
- Wallet 3 executed dozens of nearly identical injections of $19,938.
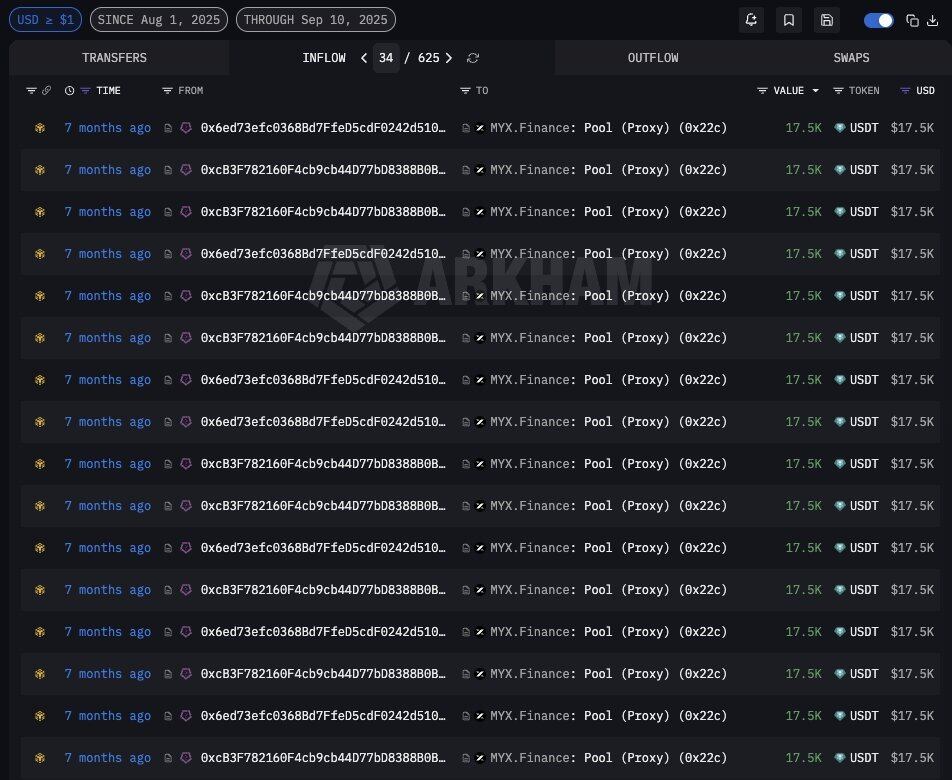
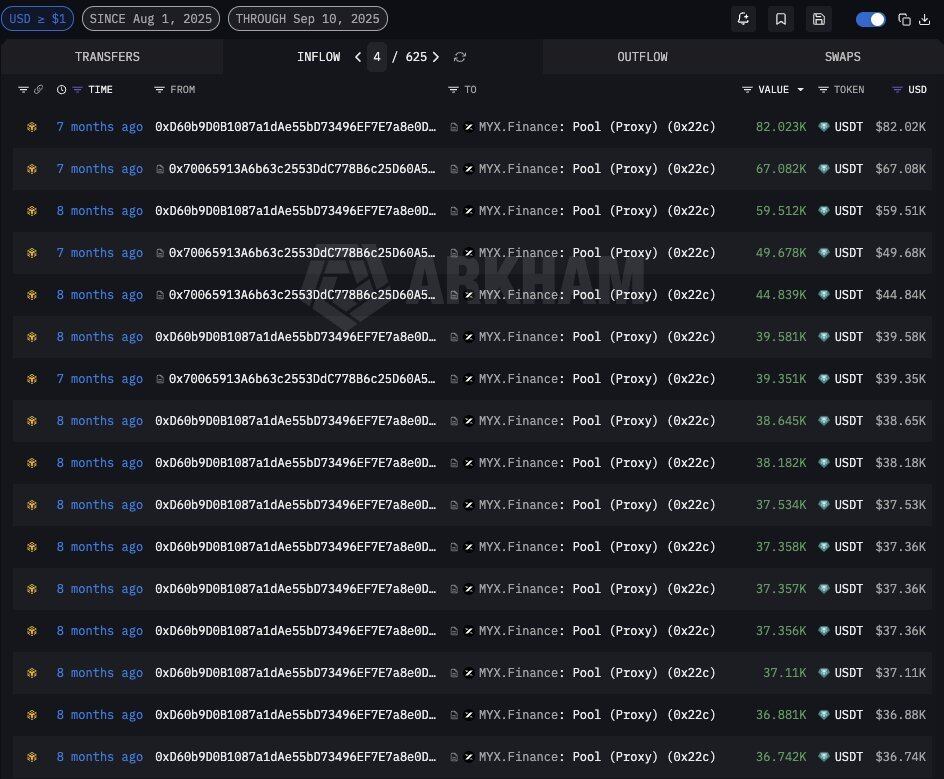
These wallets made multiple small purchases and split holdings on-chain. This operation allowed them to gain early control of circulating supply off-exchange before the pump, while avoiding the risk controls designed to catch whale activity. Through this stealthy accumulation phase, the market makers managed to gain a controlling stake without being detected, laying the groundwork for subsequent manipulation.
Phase 2 — Luring Shorts
CoinGecko historical data shows MYX trading between $0.10–$0.11 from late July to early August 2025:
- August 3: jumped to $0.168;
- August 4: surged to $0.398;
- August 5: reached $1.29 – a 1,190% increase in 5 days.
A token unlock of 39 million tokens occurred precisely on August 6, when the price was $1.65, right in the middle of this initial rally.
The pump was deliberately designed to look “unsustainable.” Any cautious trader looking at fundamentals, seeing a micro-cap token with no users surge 1,550%, would think the same thing: “Shorting this is a sure bet.”
Over the next month (August 6 – September 6), MYX consolidated between $1.05–$2.00, briefly hitting $2.00 on August 16 before retreating, dropping to $1.31 on September 6. This month-long consolidation looked exactly like a top was forming. More short sellers entered the market.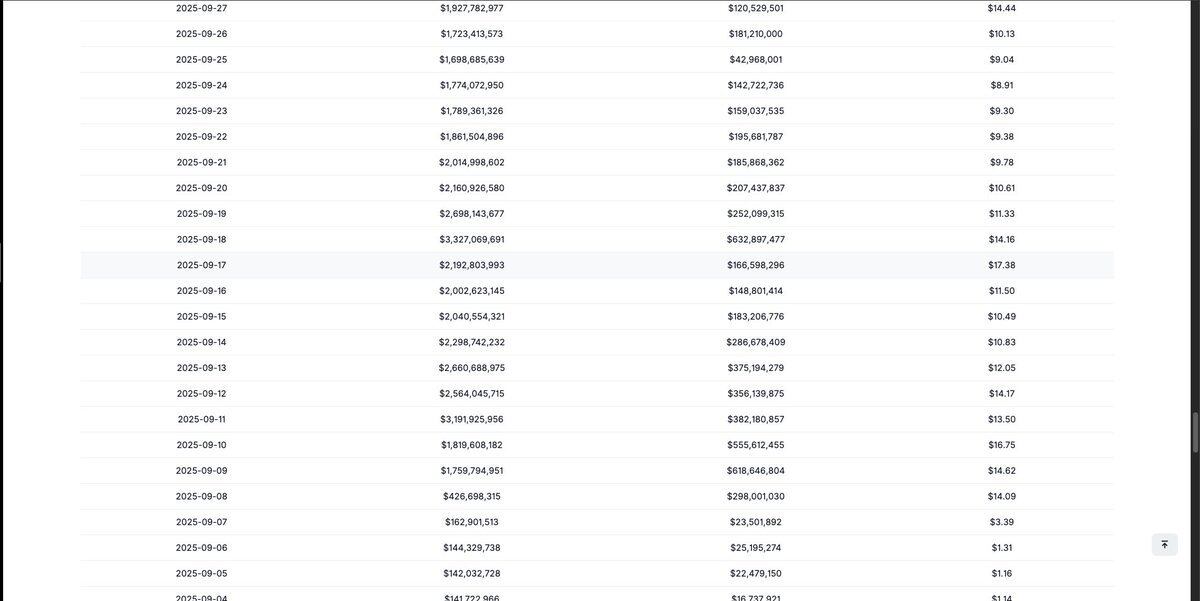
As of April 2026, only 28.18% of MYX’s total supply had been unlocked, with 71.82% still locked or under linear release. During the August-September 2025 pump, circulating supply was even lower, and the project team’s control was typically as high as 95% or more.
Here’s a common misconception: Market Cap & Fully Diluted Value (FDV)
Market cap = Current price x Circulating supply
Fully-diluted value (FDV) = price x max supply
Typically, strong-handed tokens have an initial circulating supply of around 10-20%. The actual cost of control depends on market cap, not FDV. This can mislead some into shorting based on fear of a high FDV, when the true circulating supply, considering only the market cap and real off-exchange floats, is much smaller.
Phase 3 — The Trap
During that month of consolidation, funding rates turned deeply negative. Shorts were paying -2% every 4 hours, meaning holding a position for just one day cost -12%, and that’s without even factoring in sideways or upward price movement.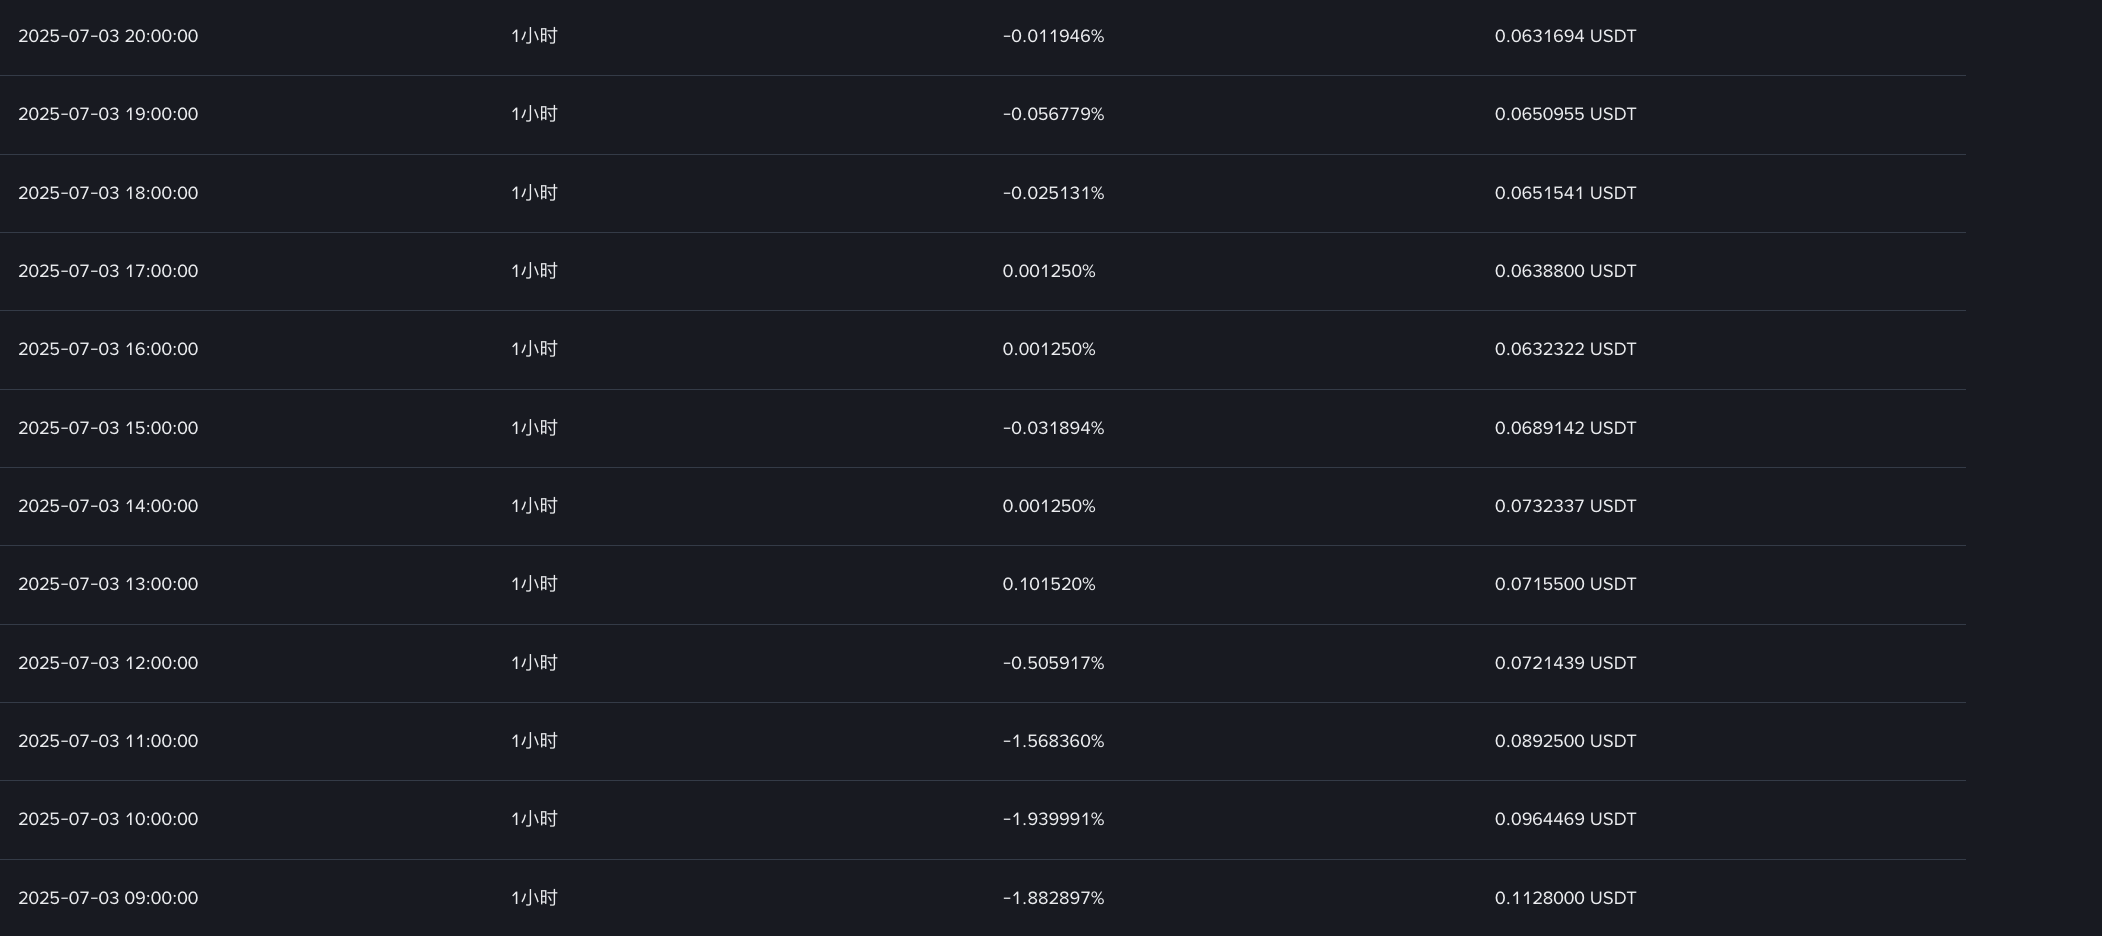
The manipulator used this phase to close initial long positions and re-leverage. The $1–$2 range combined with deeply negative funding rates painted a picture of a “token that had already topped.” More shorts entered, convinced “the dump is imminent.”
Phase 4 — The Squeeze
Coinglass data confirms this setup:
- September 6: OI $95.15M, Price $1.31;
- September 7: Price nearly tripled to $3.39. The first wave of shorts was liquidated. OI surged as new positions from both longs and shorts flooded in;
- September 8: MYX exploded from $3.39 to $14.09 in a single day. According to WEEX analysis, $16.53M was liquidated on this day alone, with $13.68M coming from short liquidations. Each liquidation forced a buyback, pushing the price higher and triggering the next round. OI spiked to over $370M;
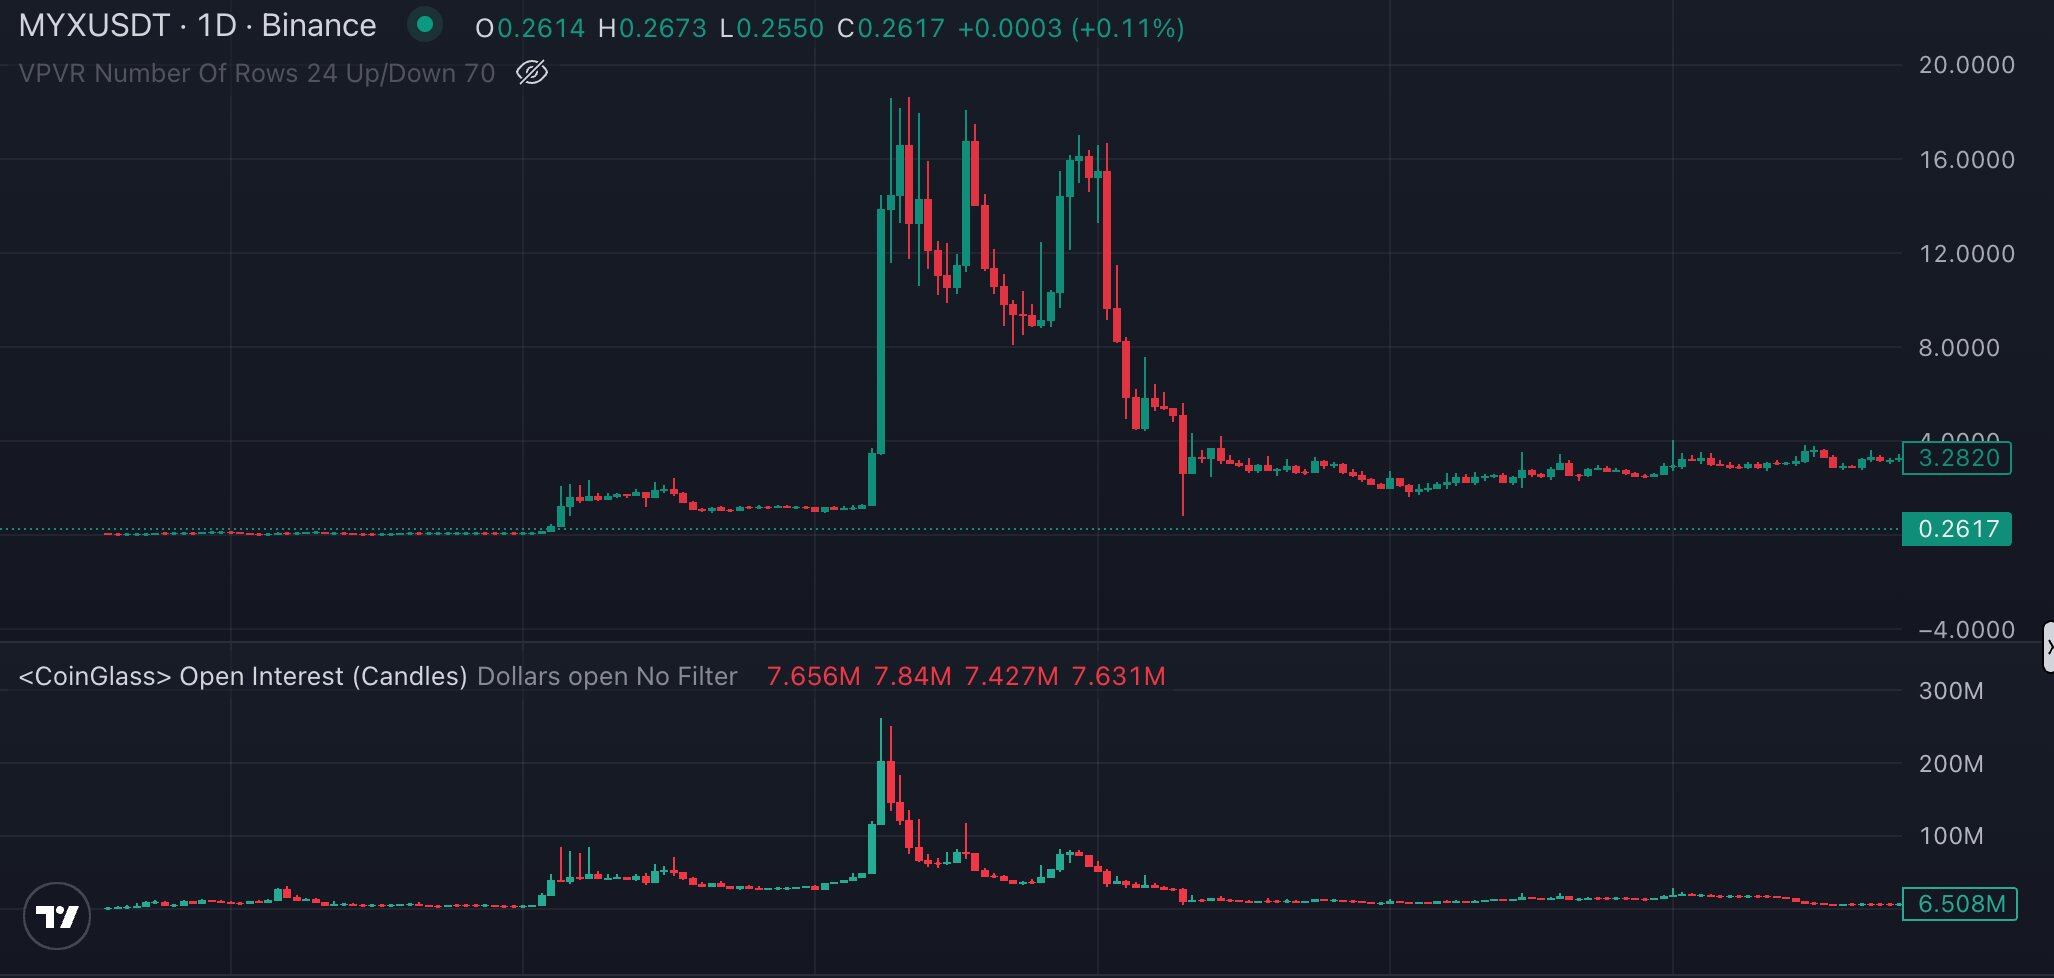
- September 9: Pushed to $14.6;
- September 10: Hit $16.75. Coinglass shows daily futures trading volume spiked to $9–10B+ during this period.
The squeeze continued into mid-September, grinding the price between $10–$17, hunting down any remaining shorts.
Phase 5 — The Exit
Once the shorts were wiped out and the price peaked, the manipulator flipped their position: opened shorts at the top, slowly unwound their remaining long positions, and began transferring tokens to CEXs for spot purposes, without immediately selling.
This was the second trap that caught some experienced on-chain analysts. Seeing “wallet → exchange” transfers, they instinctively assumed “a dump is coming” and opened shorts. However, those transfers were just bait. Before the real dump, the manipulator would first liquidate this new wave of shorts for one final harvest before making their actual exit.
COAI: The Pump and Dump
COAI launched in September 2025 at an opening price of $0.22. Within two days, it dropped to $0.17 due to airdrop recipients selling. Over the next 7 days, it traded quietly between $0.17–$0.39 – this was the accumulation window.
On October 6, COAI listed 5x leverage futures on the Aster exchange. The same day, the price went from $0.39 to $2.42. Binance Alpha was the first platform to list COAI (September 25, same day as TGE), with Bybit following around October 30. The entire BNB ecosystem was in an upward momentum at the time, with the “BNB Season” narrative providing the perfect cover for the pump.
As of April 2026, only 24.86% of COAI’s total supply had been unlocked, with **75.14% still under linear release. This means during the October 2025 pump, the real circulating supply was even smaller, and on-exchange control was even tighter.
Bubblemaps’ on-chain analysis revealed 60 wallets: they were funded simultaneously, each receiving exactly 1 BNB from Binance at 11:00 UTC on March 25, and then executing identical automated trading strategies via Binance Alpha. This high degree of behavioral uniformity led Bubblemaps to directly point out the existence of centralized manipulation or high coordination behind these addresses.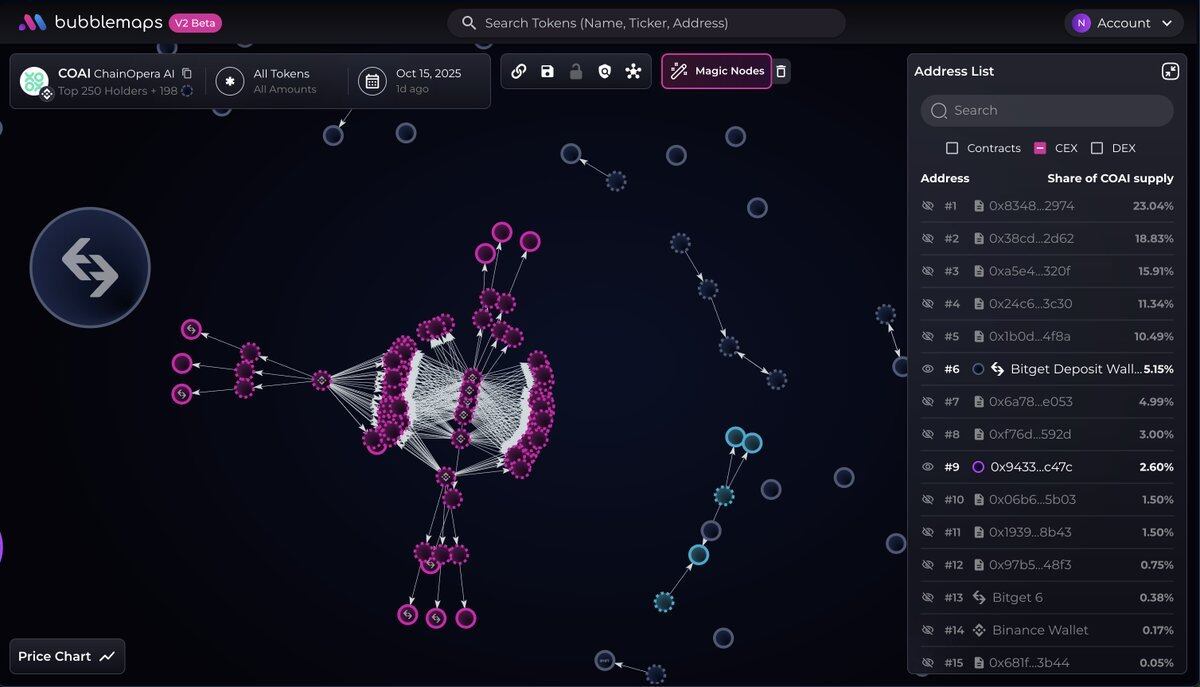
bubble maps:https://x.com/bubblemaps/status/1978865917552660795
The rally accelerated from there. Coinglass data shows:
- Before Aster listing: OI ~$30.2M;
- October 7: OI surged to $207.6M, Price $2.99;
- October 9: OI $350.93M, Price $5.82;
- October 12: All-time high (ATH) around $44–45.
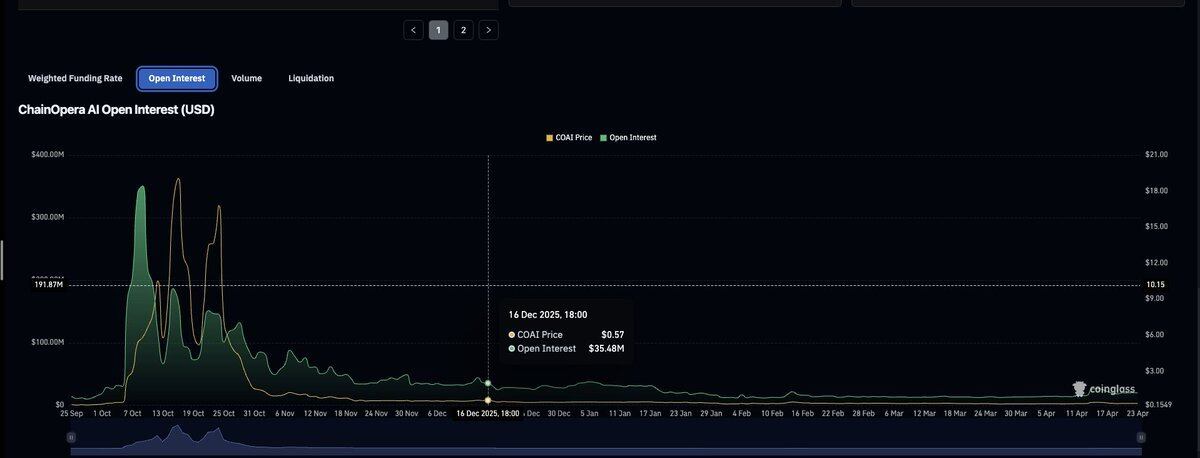
Data from coinglass
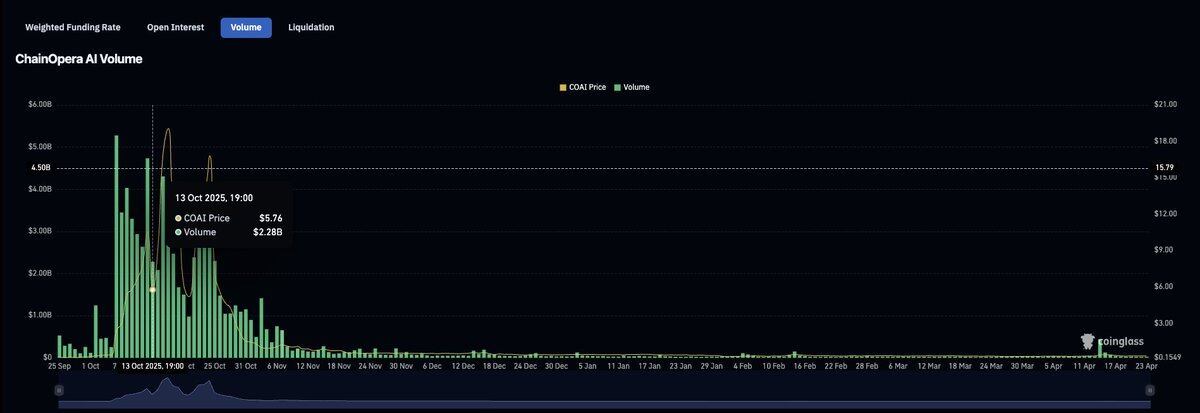
coinglass:https://www.coinglass.com/currencies/COAI
After the ATH, OI on Coinglass showed a series of rapid decreases.
Key Difference from MYX
COAI did not follow MYX’s five-phase script. MYX had a clear month-long consolidation period between the initial pump and the squeeze – a deliberate “bait + trap” cycle: market makers waited for shorts to enter, let funding rates turn deeply negative, then triggered a cascade of liquidations.
COAI was different. From launch to ATH, it happened almost in one go, without any intermediate pause. With over 75% of the supply locked on day one, the tradable circulating supply was razor-thin from the start. A highly controlled token doesn’t need to construct a squeeze to dominate the price on such a small float; it can extract remaining on-exchange liquidity through off-exchange capital allocation.
Common Characteristics of These 代币s
1. Low Float
- COAI unlocked 19.65% at TGE;
- MYX unlocked 9.21%.
- Low initial circulation allows for low float + high control.
2. BNB Chain All involved tokens have BNB Chain contracts, including AIA (marketed as the “largest AI agent infrastructure”, deployed on SUI/BSC/BTC simultaneously at launch). BNB Chain offers cheaper fees and a direct path to Binance Alpha.
Some tokens are deployed on multiple chains:
- AIA: SUI, BNB Chain;
- Rave: Ethereum, Base, BNB Chain;
- River: Ethereum, Base, BNB Chain.
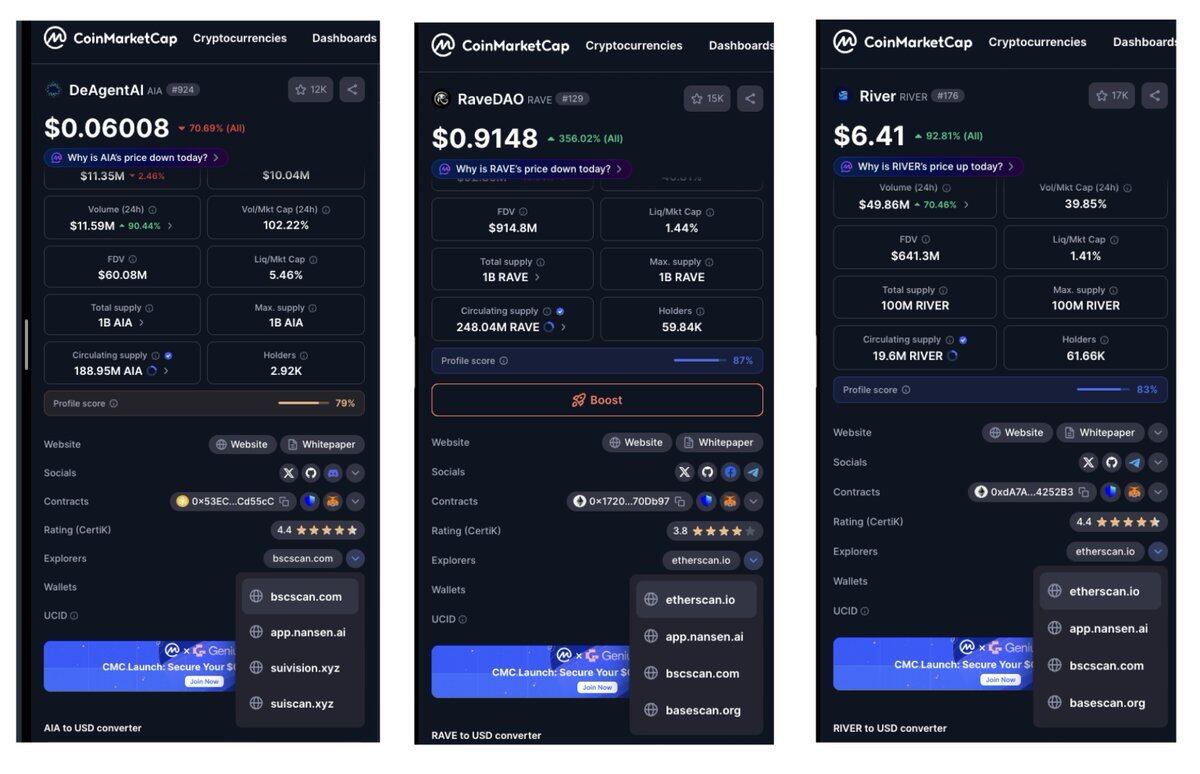 Multi-chain deployment provides more angles for manipulation: they can move tokens to the chain with the thinnest liquidity, create price differences for arbitrage, exploit bridge mechanisms for manipulation (like Power using the Ronin bridge pause), and spread tokens across multiple liquidity pools during the distribution phase. The more chains, the more venues for manipulation.
3. Binance Alpha → Binance Futures BNB Chain launch → Binance Alpha → Binance Futures. Futures listing is the most critical step – it provides the venue for leveraged liquidations, which is the primary profit center.
4. AI Narrative (Most Cases)
Most tokens in this article are packaged as AI projects – AI agents, AI infrastructure. MYX is a perpetual protocol, and PIPPIN is the only exception (a pure meme coin with no AI packaging). But as long as the AI label exists, every pump has a story to tell.
Retail is far more willing to enter a token with an AI story than a random BNB Chain token with no narrative.
5. Coordinated Wallet Accumulation
- COAI: 60 wallets, each with 1 BNB;
- PIPPIN: 50 wallets funded from HTX, controlling 44% of supply;
- MYX: 6 wallets, 2,240 small buys on PancakeSwap;
- SIREN: 200 wallets, controlling 50% of total supply.
These operations are typically spread out over weeks or months.
Order Book Level Manipulation
OI Brushing
“Brushing OI” refers to market makers inflating the OI number artificially by buying and selling to themselves, or by using coordinated accounts to open and close positions on exchanges with lower liquidity, while creating no real market risk exposure. This inflated OI makes the token look more active than it is, attracting more retail and creating an illusion of “ample liquidity.”
MYX is a clear example. Coinglass shows daily futures volume hit $9–11B during the September squeeze, while OI fluctuated between $95–$396M, giving a Vol/OI ratio of up to 24x. Normal tokens have a ratio of 3–8x; anything above 20x strongly suggests a significant portion of volume is fabricated.
According to WEEX analysis, two-thirds of MYX’s total volume was concentrated on Bitget – a single exchange accounted for most of the activity for a micro-cap token. This concentration itself is another signal of volume manipulation: when a token listed on multiple exchanges has most of its volume on one, that volume is likely artificially inflated to attract attention and influence other exchanges’ listing decisions.


