Bitcoin’s Range-Bound Battle Between Bulls and Bears Continues, HYPE Faces Critical Support Test of Wave V | Invited Analysis
To navigate complex market conditions steadily, one must follow the trend and strictly adhere to discipline.
Summary of This Week’s Core Trading Views:
• Analysis of HYPE’s current price structure. (Details in Part 1)
• HYPE’s market forecast and short-term trading strategy for this week. (Details in Part 2)
• Multi-timeframe analysis of BTC’s price structure. (Details in Part 3)
• BTC’s market forecast and medium/short-term trading strategies for this week. (Details in Part 4)
市场 Verification of Last Week’s Trading Strategies and Core Views:
• HYPE Short-term Trading Results: HYPE completed one short-term long position trade (1x leverage) last week, achieving a cumulative profit of approximately 6.80%. (Details in Table 1)
• 市场 Verification of HYPE Price Forecast: In a previous article, we noted that the rebound from the April 2nd low of $34.44 for HYPE could be considered a potential daily Wave V uptrend in terms of wave structure. The current market movement validates our earlier view. Last week’s rally reached a high of $45.75, not only successfully breaking above the March 18th Wave III high of $43.78 but also setting a new high for this uptrend.
• Verification of BTC Medium-term Trading Results: Bitcoin followed the established medium-term strategy last week, continuing to hold the short position opened at $89,000 (1x leverage). As of last week’s close (around $73,800), the profit was approximately 17.08%, with a maximum profit of about 32.58% during the period.
• Market Verification of BTC Price Forecast: Last week, we indicated that the market would maintain a wide-range consolidation pattern. The current market movement validates our previous forecast.
I. HYPE: Price Structure Analysis
HYPE_4-Hour Candlestick Chart
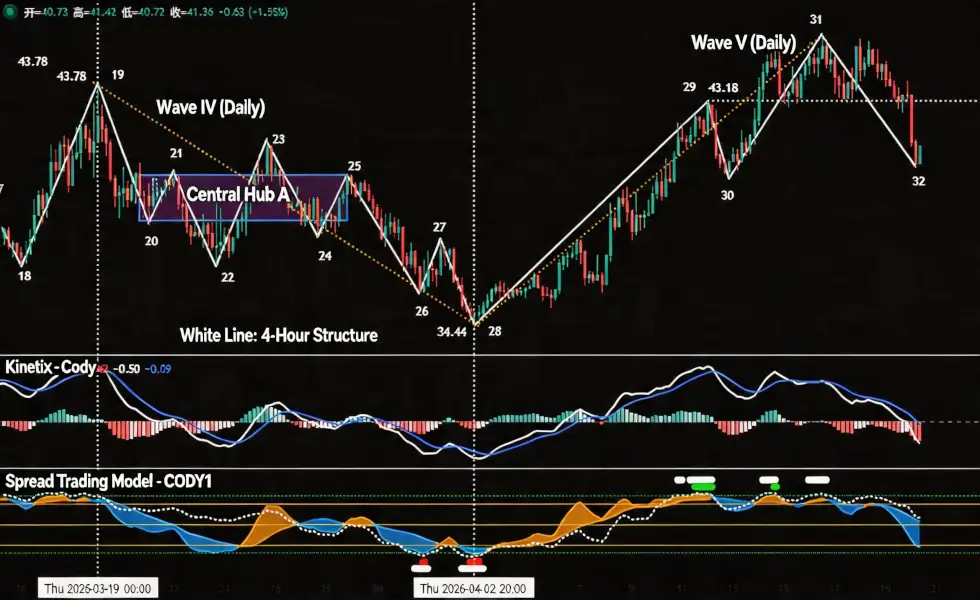
Figure 1
1. As shown in (Figure 1), HYPE reached a new high of $45.76 on April 16th, setting a new rebound high since the January 21st low of $20.46 and breaking above the previous high of $43.78 from March 18th (the Wave III high). Therefore, the upward movement starting from the April 2nd low of $34.44 can be tentatively viewed as a daily Wave V uptrend structure, which is currently in progress.
2. As shown in (Figure 1), the aforementioned daily Wave V can be further subdivided into a 4-segment upward structure in the 4-hour timeframe: segments 28-29, 29-30, 30-31, and 31-32.
3. The market is currently in the 31-32 correction segment.
• In HYPE’s 4-hour structure, our proprietary momentum quantitative model detected that two momentum signal lines have simultaneously moved below the zero axis, indicating that this correction segment may be weak and the correction time may be prolonged.
• Currently, the potential correction endpoint (i.e., endpoint 32) is approaching the previous support level of $40.17 (i.e., endpoint 30).
II. HYPE Market Forecast and Short-term Trading Strategy for This Week
1. HYPE Market Forecast for This Week:
As shown in (Figure 1), focus on whether endpoint 32 breaks below endpoint 30 (i.e., $40.17):
• If it holds above, expect consolidation within the $40.17–$45.76 range.
• If this support level is broken and the subsequent rebound high fails to surpass $45.76 (i.e., endpoint 31), it would form a classic technical pattern of “correction breaking the previous low, but the subsequent rebound failing to make a new high.” This would imply a high probability that the daily Wave V uptrend structure initiated from the April 2nd low has already completed its termination at $45.76.
2. HYPE Short-term Trading Strategy for This Week:
• Based on the forecast of an overall uptrend, adhere to the strategy of “follow the trend, buy on dips.”
• Using signals from our proprietary quantitative model, target the 30-minute/60-minute timeframe as the operational cycle, utilizing 30% of capital to capture long entry opportunities.
• Entry Strategy: HYPE faces correction pressure at the beginning of the week. If the price retraces near the key support of $40.17 and shows signals confirming a hold above support, combined with bottom-buying signals triggered by both major models, consider entering a long position while strictly adhering to stop-loss discipline.
III. Bitcoin Multi-timeframe Price Structure Analysis
1. BTC Daily Wave Classification: (Based on price action after the October 6, 2025 high)
Bitcoin _ Daily Candlestick Chart:
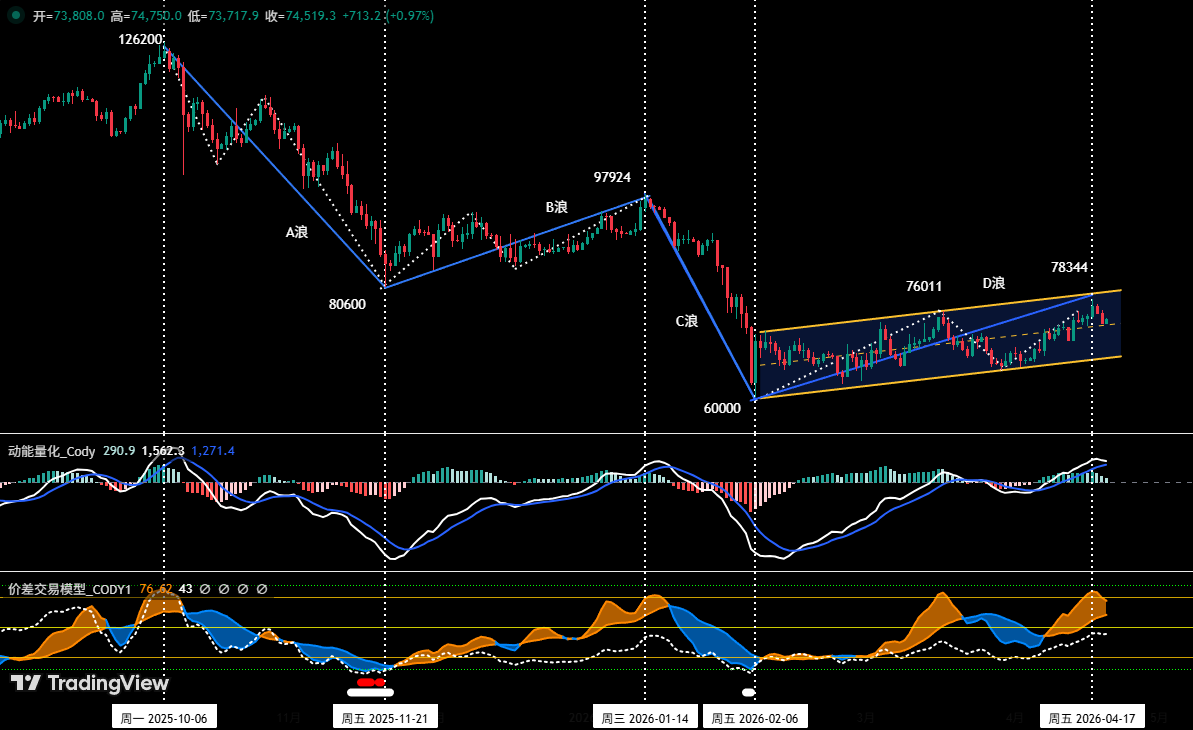
Figure 2
As shown in (Figure 2), Bitcoin’s rebound from the February 6th low of $60,000 not only reached a new rebound high of $78,333 on April 17th but has also lasted approximately 73 trading days as of April 19th. Both its duration and magnitude have significantly exceeded the scope of the previously anticipated “C-2 wave rebound within the C wave correction” (e.g., its sustained rebound time has far exceeded the 54-day B wave rebound). Therefore, based on Elliott Wave analysis principles, the original framework may need adjustment. We are more inclined to re定义ne this upward movement from $60,000 as a larger-degree “Wave D rebound,” which better aligns with the objective reality of the current market exchanging time for space and extending the rebound cycle.
The specific medium-term corrective wave classification can be optimized as follows:
• Wave A Correction (Impulsive Decline): Started from the October 6, 2025 high of $126,200, ending at the November 21, 2025 low of $80,600. Lasted about 46 days, with a maximum decline of approximately 36%. This wave established the medium-term correction pattern.
• Wave B Rebound (Complex Correction): Started from the November 21, 2025 low of $80,600, ending at the January 14, 2026 high of $97,924. Lasted about 54 days, with a maximum gain of approximately 21.5%. This was a correction against the Wave A decline.
• Wave C Correction (Main Decline Wave): Started from the January 14, 2026 high of $97,924, rapidly declining to touch the $60,000 low on February 6, 2026. Lasted about 22 days, with a maximum decline of approximately 38.7%. This wave completed the main spatial part of the correction.
• Wave D Rebound (Currently in progress / possibly in its final stages): Started from the February 6, 2026 low of $60,000. As of April 19th, it has lasted about 73 days, with a maximum gain of approximately 30.6% (from $60,000 to $78,333). This rebound is characterized by a prolonged duration and complex structure, and it is currently facing tests from key time windows and price resistance zones (e.g., $79,000–$80,600). If Wave D is valid, upon completion of the price rebound, a corresponding “Wave E” correction may follow.
2. BTC: In-depth Price Structure Analysis
Bitcoin _4-Hour Candlestick Chart
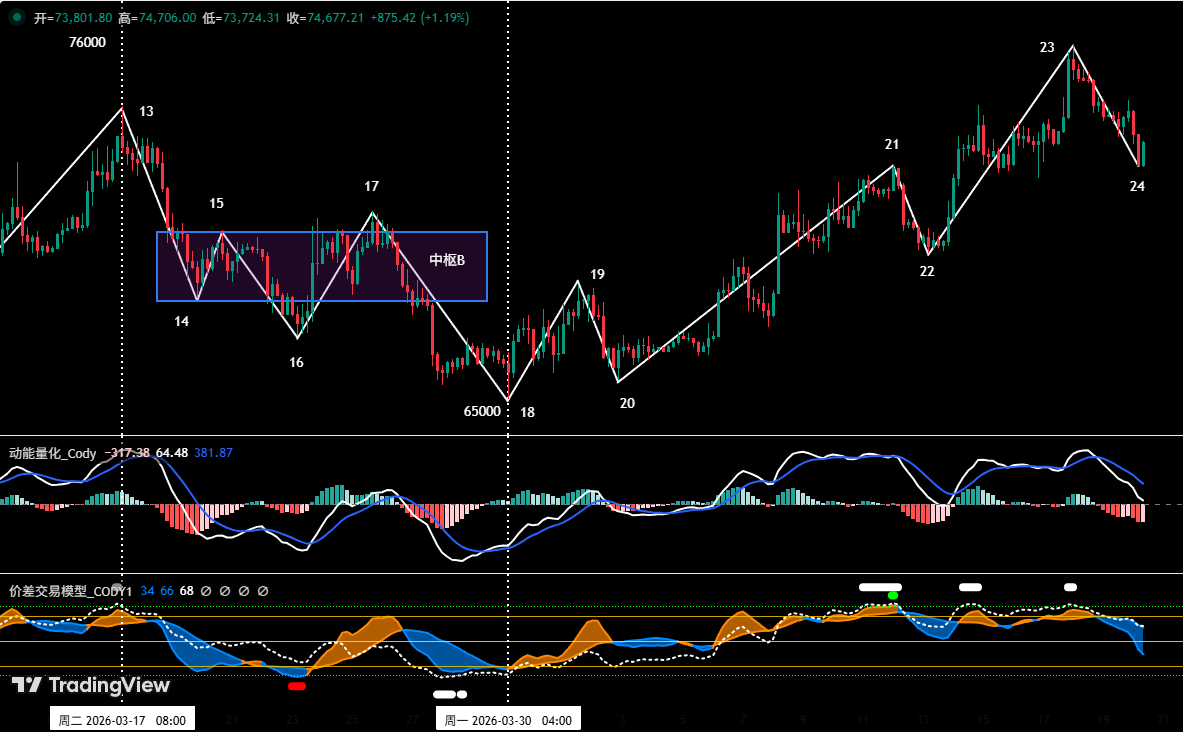
Figure 3
• Based on price evolution after the March 30th low of $65,000.
• As shown in (Figure 3), BTC initiated a volatile upward movement from the March 30th low. From endpoint 18 to endpoint 24, it consists of a 6-segment structure: 18-19, 19-20, 20-21, 21-22, 22-23, and 23-24.
• The chart shows: From endpoint 18 to endpoint 23, the market has completed a relatively clear 5-wave rebound structure, and is currently in the 23-24 segment. From our proprietary Spread Trading Model, recent top warning signals have been continuously triggered (green and white dots in the chart), indicating that technical indicators are in a severe overbought state, and the market has short-term consolidation/correction needs.
IV. Bitcoin Market Forecast and Trading Strategy for This Week
1. BTC Market Forecast for This Week:
• Core View for This Week:
Currently maintaining consolidation within the $73,500–$79,000 range. Monitor the battle between bulls and bears near the upper and lower boundaries of this range. If the rebound breaks above the upper boundary, the market may experience a volatile rebound, but with limited upside. If it effectively breaks below the lower boundary, the price may further test the key support near $69,500.
2. Core Resistance Levels:
• First Resistance Zone: $79,000–$80,600 area (near the November 2025 low)
• Second Resistance Zone: $83,500–$84,500 area (previous high-volume congestion zone)
3. Core Support Levels:
• First Support Level: Near $73,500 (previous important support)
• Second Support Level: Near $69,500 (previous important support)
• Third Support Level: $65,000–$66,000 area (near the lower boundary of the consolidation range)
4. Trading Strategy for This Week (Excluding Impact of Sudden News): (04.20–04.26)
① Medium-term Strategy:
Bitcoin _ Daily Candlestick Chart: (Position Monitoring Model)
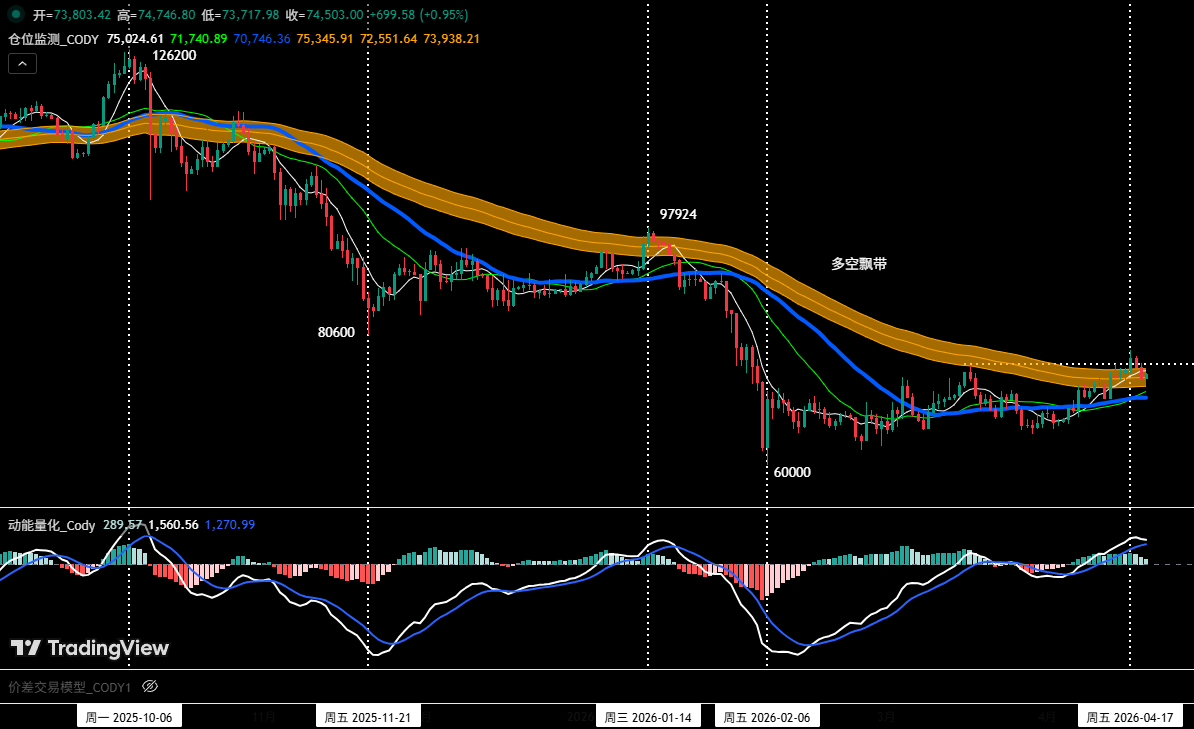
Figure 4
Position Monitoring Model: As shown in (Figure 4), the price is currently consolidating near the Bull-Bear Ribbon. Following our strategy rules, we are temporarily holding the 60% short position established at $89,000 (on January 28th).
• If the price rebounds this week and effectively stabilizes above the Bull-Bear Ribbon, all medium-term positions will be closed.
② Short-term Strategy: Utilize 30% of capital, set stop-loss points, and look for “spread” trading opportunities based on support and resistance levels. (Using 30-minute/60-minute as the operational cycle).
③ Based on the forecast of a medium-term bearish trend for the market, the current operational principle should be “follow the trend and go short.” To dynamically respond to the market’s complex evolution and combine signals from our proprietary trading models, we have formulated two short-term operational plans: Plan A/B.
• Plan A: Sell on Rallies, Go Short at Highs.
• Entry: When the price rallies to the $76,500–$79,000 zone, triggers resistance signals, and combines with model top signals, a 30% short position can be established.
• Risk Control: Initial stop-loss set above $80,600.
• Exit: When the price falls near important support levels and combines with model signals, positions can be gradually closed to take profits.
• Plan B: Trend-following Breakdown Short.
• Entry: If the price continues to adjust and effectively breaks below the support near $73,500, combined with model top signals, a 30% short position can be established following the trend.
• Risk Control: Initial stop-loss set above $74,500.
• Exit: When the decline reaches support levels and combines with model signals, positions can be gradually closed to take profits.
V. HYPE: Trade Review
1. Short-term Trade Review: (See Table 1)
We strictly followed the operational plan and, based on trading signals from our proprietary Spread Trading Model and Momentum Quantitative Model, completed one short-term (long) trade last week, achieving a cumulative trading profit of 6.80%.
2. HYPE Short-term Trade Details Summary: (Leverage*1x)
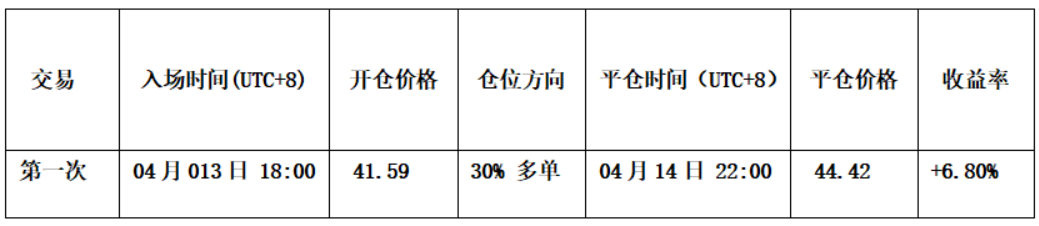
Table 1
3. Short-term Trade Review: (See Figure 5)
• Entry Strategy: First, based on the judgment of a market Wave V uptrend; second, the Spread Trading Model had already issued early bottom warning signals (good points in the chart); third, the two momentum lines in the Momentum Model simultaneously moved above the zero axis, and both models issued synchronized bullish signals. We established a 30% long position at $41.59.
• Exit Strategy: When the price rose near $45 and encountered resistance, and the Spread Trading Model triggered strong top warning signals (green point + white point), we closed all positions near $44.42.
• Summary: This trade successfully achieved a profit of approximately 6.80%.
HYPE_60-Minute Candlestick Chart: (Momentum Quantitative Model + Spread Trading Model)
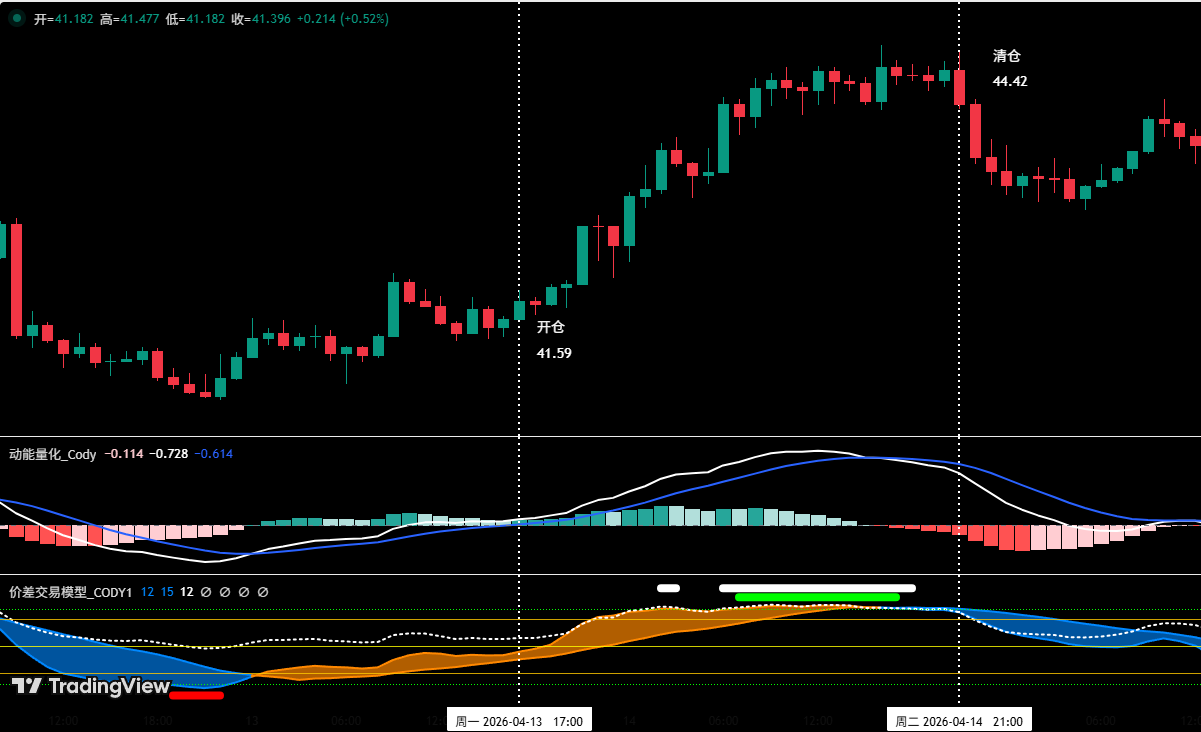
Figure 5 (Short-term Trade Illustration)
VI. Special Notes:
1. Upon Entry: Immediately set the initial stop-loss level.
2. When Profit Reaches 1%: Move the stop-loss to the entry price (breakeven point) to ensure capital safety.
3. When Profit Reaches 2%: Move the stop-loss to the 1% profit level.
4. Continuous Tracking: Thereafter, for every additional 1% profit, move the stop-loss up by 1% accordingly, dynamically protecting and locking in profits.
Financial markets change rapidly. All market analysis and trading strategies require dynamic adjustment. All views, analytical models, and operational strategies mentioned in this article are derived from personal technical analysis, intended solely for personal trading log purposes, and do not constitute any investment advice or operational basis. The market carries risks; investment requires caution. Please do not make decisions based solely on this content.
Related: Latest Stablecoin Report: Real Distribution and Flow Are Far More Important Than Supply
Compiled by | Odaily (@OdailyChina) Translator | Ding Dang (@XiaMiPP) Editor’s Note: While the market is still accustomed to using “total supply” to summarize the stablecoin world, a set of more granular data is revealing another layer of reality. A single supply figure can only answer “how much,” but cannot explain “who holds it,” “how it flows,” or “why it stays.” When we observe supply scale, holding concentration, on-chain circulation velocity, and specific activity categories on the same map, what we see is no longer a static stockpile, but the dynamic structure of how capital migrates, settles, leverages, and reprices on-chain. This perspective is important because it may correct our intuitive judgments about the past year. The crypto market’s downturn contrasts sharply with the strong performance of U.S. stocks. The…