
These three altcoins exhibit bullish formations against Bitcoin (BTC) and could outperform it in March 2024.
尽管 BTC 正在迅速上涨至历史新高,但以下山寨币仍呈现看涨形态。
Solana (SOL) 价格从支撑位反弹
The weekly time frame outlook shows that SOL has increased swiftly since breaking out from a long-term descending resistance trend line and validating it as support (green icon) on September 2023. The increase led to a high of ₿0.0029 in December 2023. Even though SOL fell slightly after the high, it bounced at the ₿0.0020 horizontal area this week.
The wave count suggests that wave four is complete. Elliott Wave theory involves the analysis of recurring long-term price patterns and investor psychology to determine the direction of a trend. According to the wave count, the SOL price has just started wave four and will increase by another 100% to the next resistance at ₿0.0040.
Read more: 如何购买 Solana (SOL) 以及您需要了解的一切
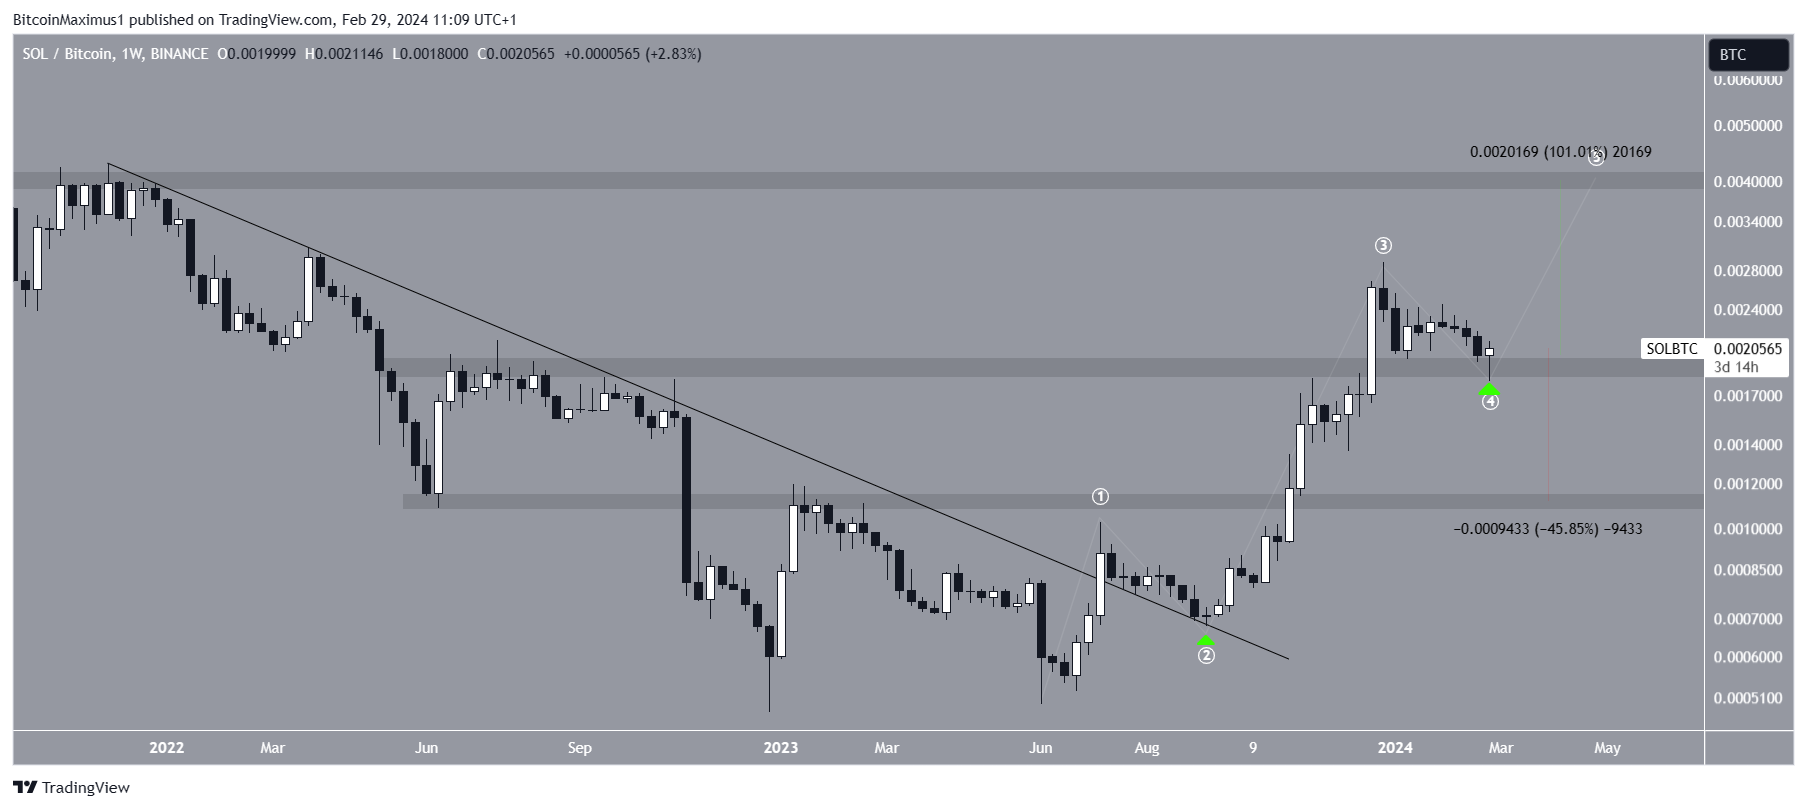
Despite the bullish SOL price prediction, closing below the ₿0.040 area will invalidate the count and can trigger a 45% drop to the closest support at ₿0.0011.
狗狗币(DOGE)形成看涨背离
自 2022 年 10 月以来,狗狗币价格一直跌至下降阻力趋势线以下。这一下跌导致本周跌至 157 聪的低点。然而,狗狗币价格反弹并形成了一个大的看涨周烛台。如果周收盘价守住,DOGE将突破已经存在了490天的下降阻力趋势线。
A bullish divergence in the RSI preceded the bounce. Traders utilize the RSI as a momentum indicator to assess whether a market is overbought or oversold and whether to accumulate or sell an asset.
如果RSI读数高于50并且趋势向上,多头仍然具有优势,但如果读数低于50,则相反。当动量增加伴随价格下跌时,就会出现看涨背离。它通常会导致看涨趋势逆转。
Read more: 如何购买狗狗币(DOGE)
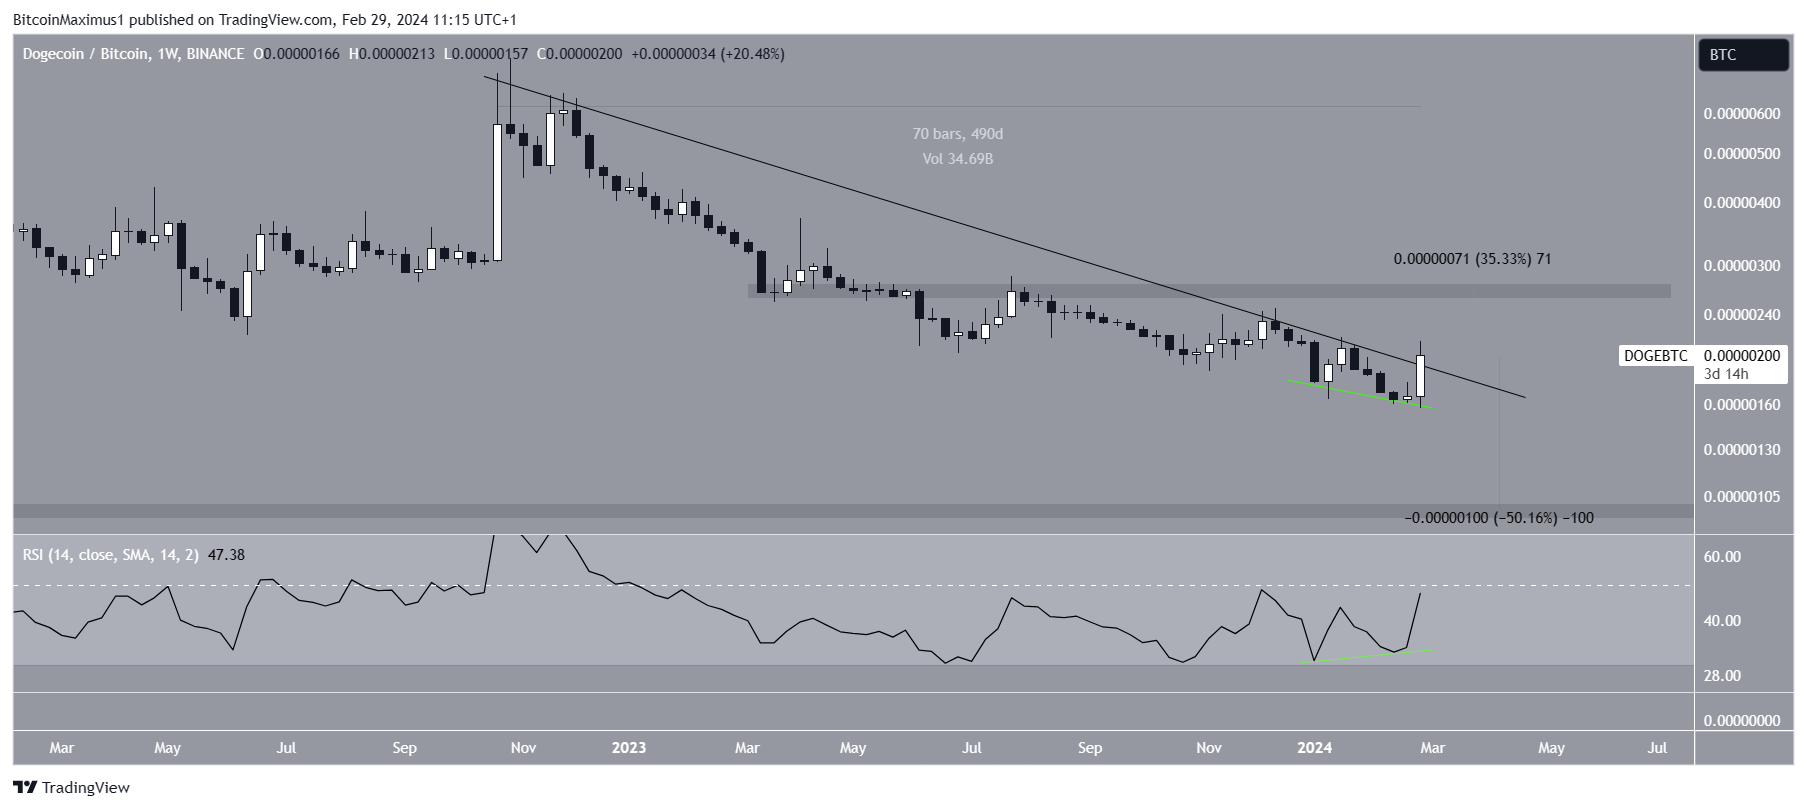
如果DOGE确认突破,则可以上涨35%至下一个阻力位270聪。尽管 DOGE 价格预测看涨,但未能突破可能导致 50% 跌至最近的支撑位 100 聪。
图表(GRT)似乎出现突破
最后一种可能超越 BTC 的山寨币是 GRT。 GRT 价格突破了自历史高点以来一直存在的下降阻力趋势线。在趋势线(绿色图标)反弹后,GRT 开始向上运动,突破 450 聪阻力区域。
此次突破与 RSI 升至 50 以上相结合,使其合理化。因此,如果继续上涨,图表可能会再上涨 90%,以达到下一个阻力位 900 聪。
Read More: 8 个最佳期货跟单交易加密平台
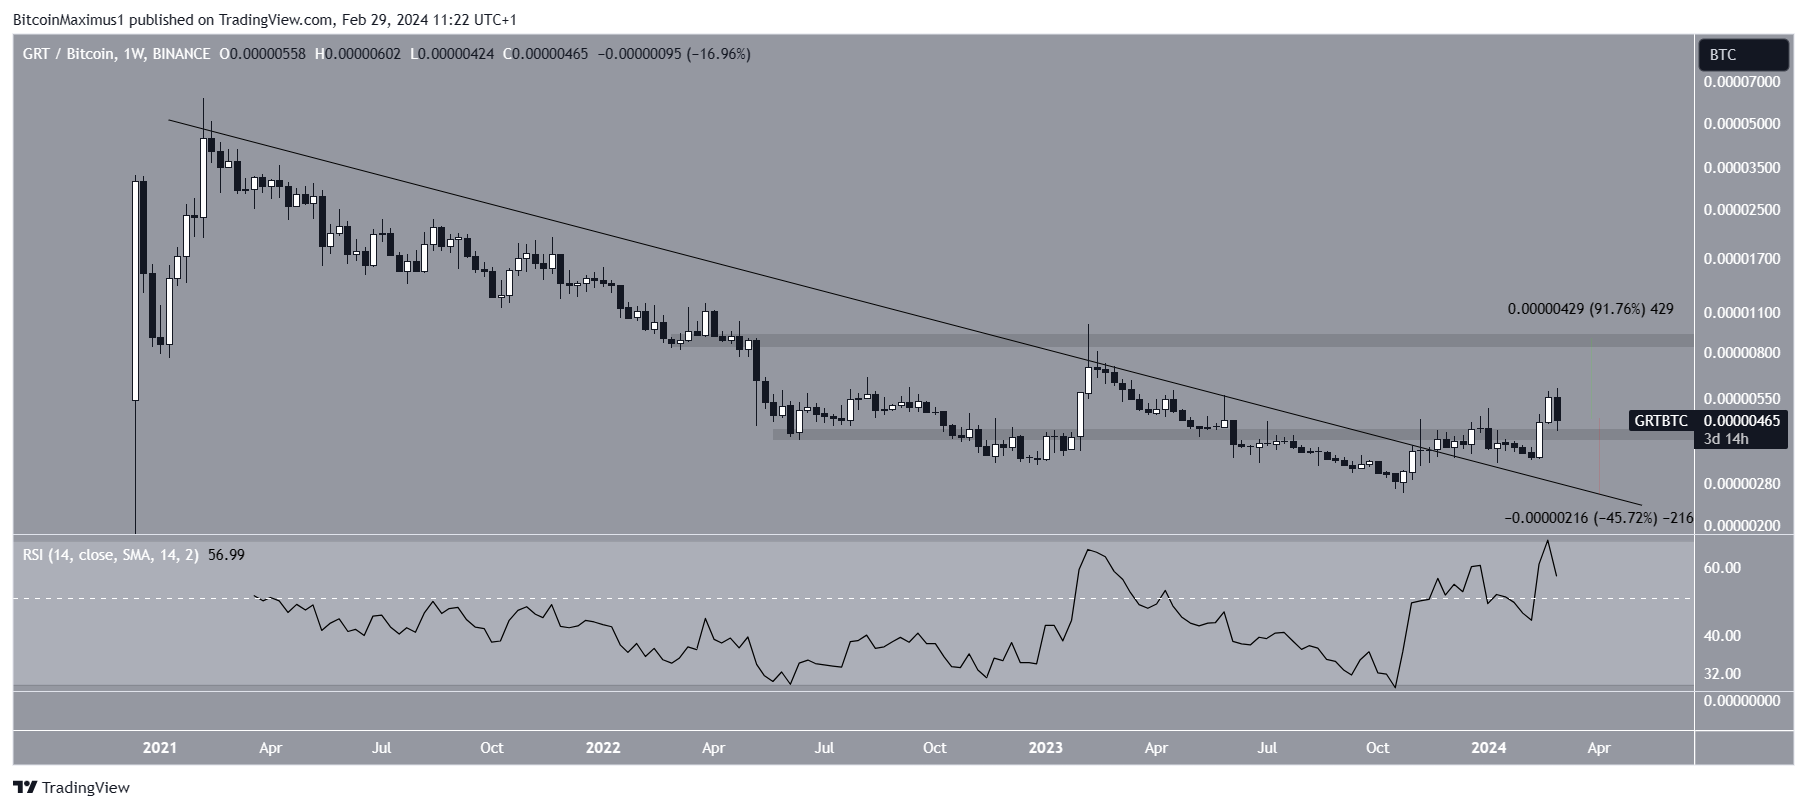
尽管 GRT 价格预测看涨,但收盘价低于 450 聪支撑区域可能会导致 45% 跌至 280 聪的阻力趋势线。


我想更多地了解蜜蜂。康姆
我很高兴能加入你们这里