上週,卡爾達諾(ADA)經歷了看漲反彈,成功達到了斐波那契(Fib)價格目標。然而,卡爾達諾現在有可能經歷調整階段。
Reflecting on the previous week’s analysis, it was noted that if Cardano were to break through the resistance area between the $0.4 and $0.43 levels, it could then aim for the .382 Fib resistance level, which is situated around $0.61. Given the recent bullish bounce, this scenario has been relevant, but the current market dynamics suggest that a corrective movement might follow.
卡爾達諾價格觸及斐波那契阻力位約 $0.61
卡爾達諾的價格已達到0.382斐波那契(Fib)阻力位,約$0.61。在這個水平上,價格最初可能會面臨看跌拒絕。
儘管存在這種潛在的短期挫折,但卡爾達諾的中期前景仍然非常樂觀。 10月以來,ADA大幅上漲,漲幅超過170%。
Supporting this bullish trend, the monthly chart’s Moving Average Convergence Divergence (MACD) histogram shows a bullish increase, and the MACD lines are also crossing in a bullish manner. The Relative Strength Index (RSI), meanwhile, is in neutral territory.
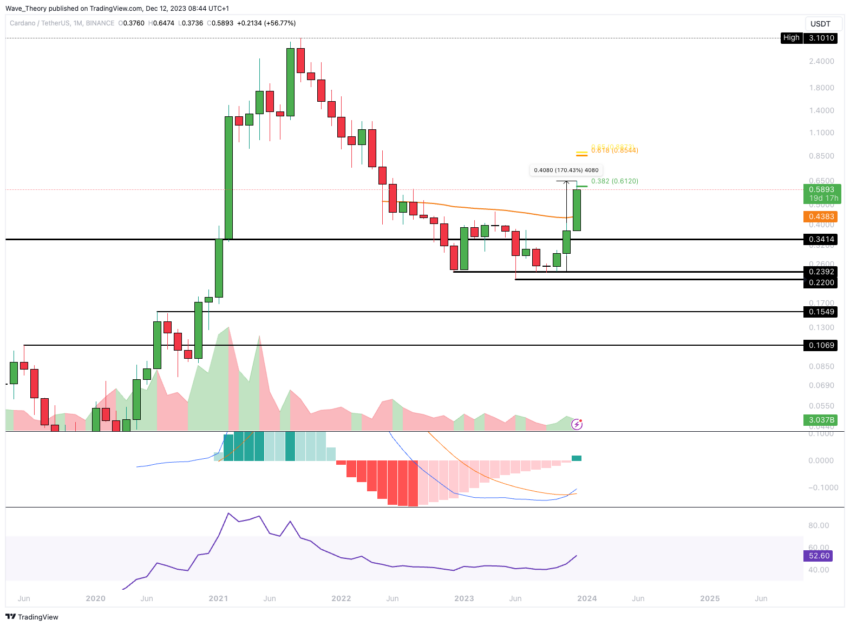
Furthermore, ADA has successfully breached the 50-month Exponential Moving Average (EMA) resistance at around $0.44, which now acts as a support level, adding to Cardano’s positive medium-term perspective.
Weekly Chart Analysis: Cardano’s MACD Indicates Strong Bullish Trend
In the weekly chart for ADA, the indicators present a mix of signals. On one side, there’s a ‘death cross’ in the Exponential Moving Averages (EMAs), indicating that a bullish trend confirmation is yet to be established.
此外,相對強弱指數(RSI)處於嚴重超買區域。這表明市場可能會進行調整。然而,從看漲的角度來看,移動平均收斂分歧(MACD)柱狀圖呈上升趨勢,MACD線已看漲交叉。
儘管有這些看漲指標,但在 $0.61 附近的 0.382 斐波那契 (Fib) 阻力位處存在明顯的看跌拒絕。因此,卡爾達諾可能會修正至下一個斐波那契支撐位,分別約為 $0.484 和 $0.38。
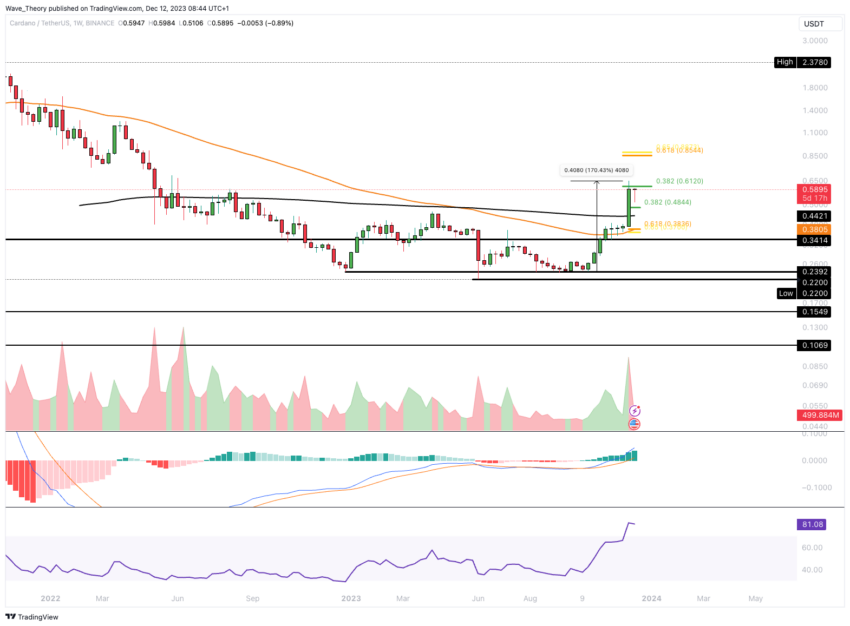
Additional support is provided at around $0.38 by the 50-week EMA, while the 200-week EMA offers support at approximately $0.44. These EMA levels could stabilize Cardano’s price if it undergoes a downward correction.
日線圖展望:ADA 中短期維持看漲軌跡
在 ADA 日線圖中,中短期趨勢仍看漲。這種看漲前景受到指數移動平均線(EMA)黃金交叉的支撐,顯示出積極的勢頭。此外,移動平均收斂分歧(MACD)線處於看漲交叉狀態,MACD長條圖呈現上升趨勢,進一步強化了看漲情緒。
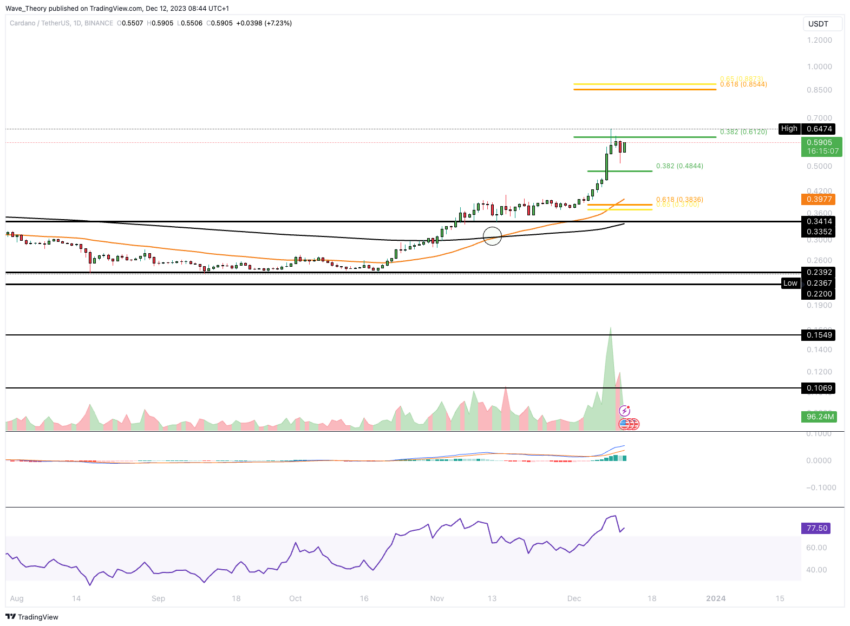
然而,相對強弱指數(RSI)目前處於嚴重超買區域。儘管存在這種超買狀況,但沒有明顯的看跌背離跡象,這意味著在沒有立即反轉訊號的情況下,上行勢頭可能會繼續。這些指標組合表明卡爾達諾繼續看漲,儘管由於 RSI 超買而保持謹慎,這通常先於潛在的回調或盤整階段。
Cardano’s Next Target: Eyeing 0.382 Fib Resistance at $0.61 Again
如果卡爾達諾成功突破 0.382 斐波那契 (Fib) 阻力位(約 $0.61),則有潛力升至黃金比例水準(約 $0.86)。這將標誌著顯著的看漲進展。
此外,4 小時 (4H) 圖表顯示修正走勢可能會提前結束,因為卡爾達諾已重新接近 $0.61 附近的 0.382 Fib 阻力位。移動平均線收斂分歧(MACD)長條圖呈上升趨勢,支持了這個看漲前景。而指數移動平均線(EMA)則繼續呈現黃金交叉。
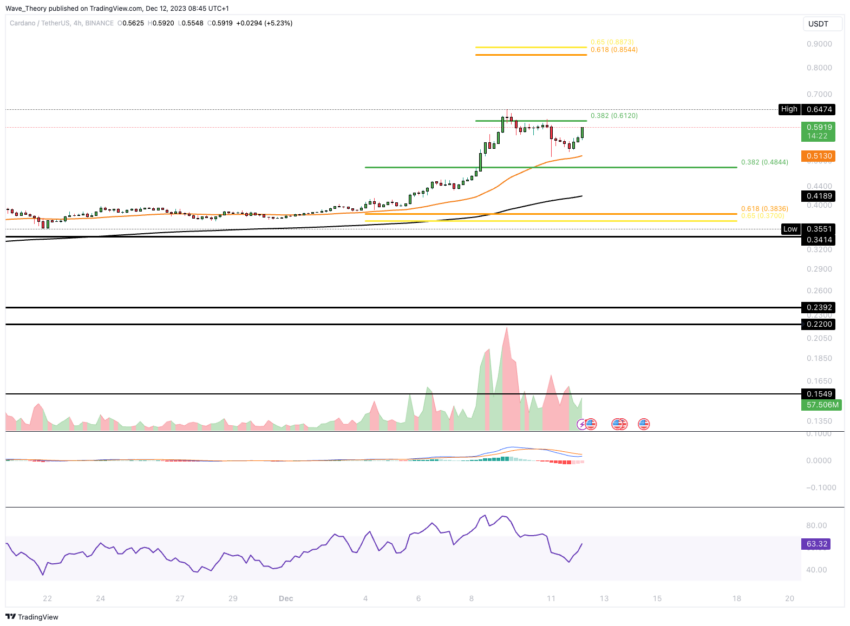
這些指標共同顯示卡爾達諾的看漲勢頭在短期內復甦。
Cardano’s Price Experiences Bullish Breakout Against Bitcoin Last Week
上週,卡爾達諾兌比特幣(BTC)的價格大幅上漲,成功突破了幾個關鍵阻力位。其中包括斐波那契 (Fib) 阻力位約 0.0000103 BTC 和 0.000012 BTC,以及超過約 0.0000126 BTC 的 50 週指數移動平均線 (EMA)。
展望未來,ADA 的下一個主要斐波那契阻力位設定在 0.000015 BTC 和大約 0.00001985 BTC 左右。這種上升勢頭得到了移動平均收斂分歧(MACD)直方圖的進一步支持。自上週以來一直呈上升趨勢,MACD線也呈現看漲交叉。
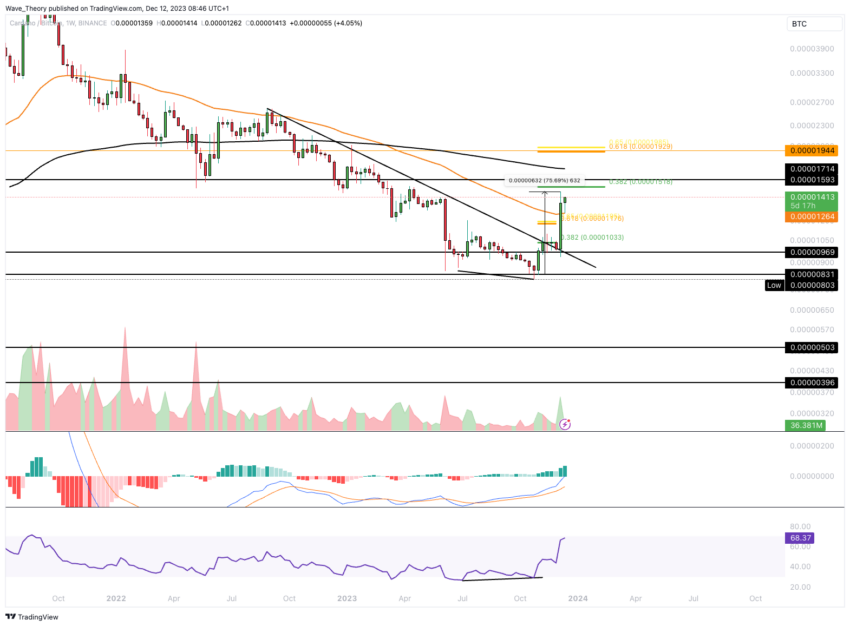
Overall, Cardano’s price has seen an impressive rise of over 75% in the past few weeks. The recent developments indicate that Cardano is currently performing very well, especially in its pairing against Bitcoin.


漂亮