U.S. Stocks in the “Largest Bubble in History” Zone? Four Major Valuation Indicators Simultaneously Flash Red
소개: The S&P 500’s CAPE ratio has touched 39, its highest level since the 2000 dot-com bubble; the “Buffett Indicator” has broken through 230%, setting a new historical record; the top ten constituents account for over 35% of the index’s weight, marking the highest concentration in modern market history. Multiple valuation indicators are simultaneously flashing overheating signals, yet Wall Street is deeply divided in its judgment: one side argues that AI-driven profit growth justifies the premium, while the other believes this is the classic hallmark of a bubble peak.
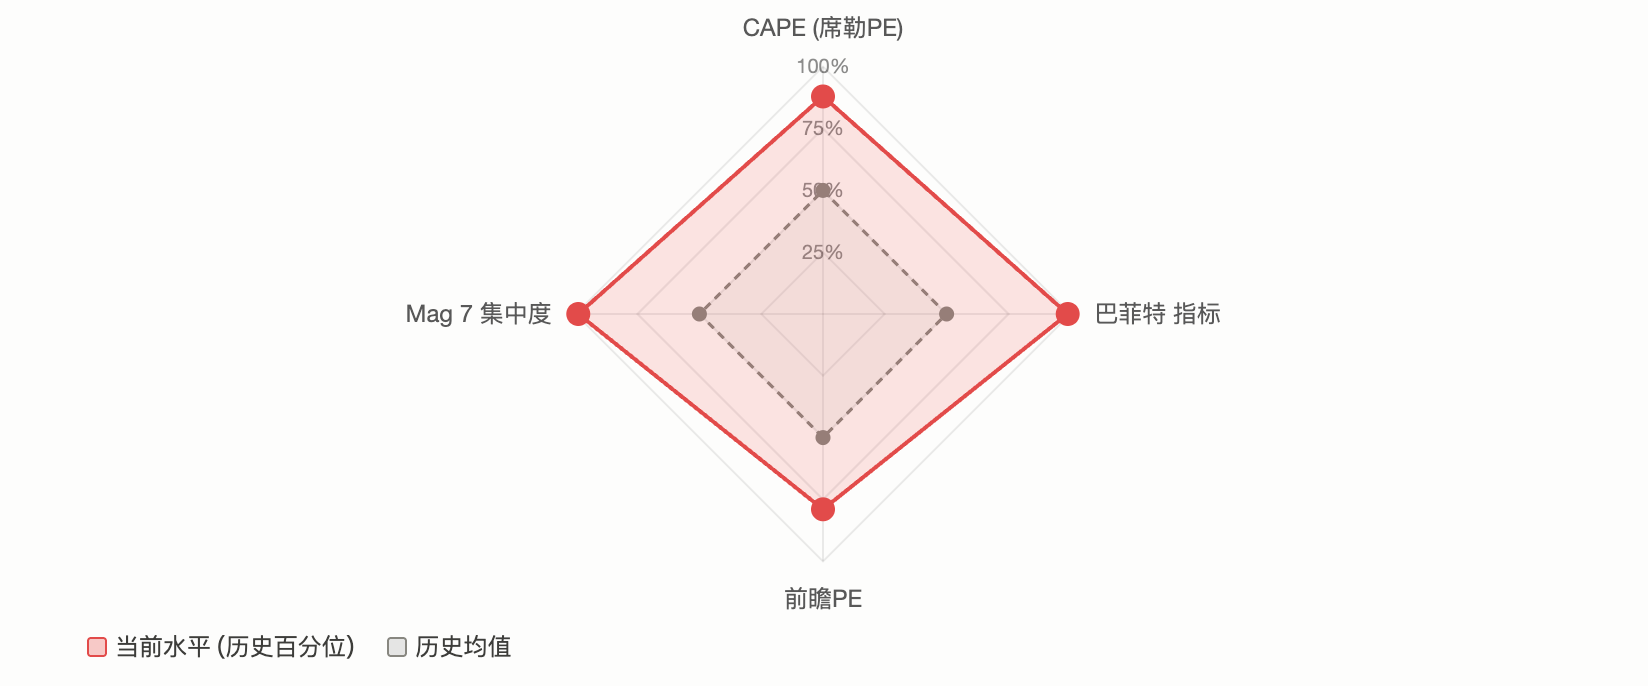
The S&P 500 is in a rare state: almost all mainstream valuation indicators are simultaneously flashing red.
The CAPE (Shiller P/E) is approaching 40, the highest level since the dot-com bubble; the “Buffett Indicator” (시장 Cap/GDP ratio) has exceeded 230%, setting a new historical record; the top ten constituents account for over 35% of the index’s weight, with market concentration reaching an unprecedented level in modern financial history. A post on the Reddit community r/stocks characterized the current market as “the most overextended state in history,” garnering over 2,100 upvotes and 640 comments. The discussion centers on a core question:
Is this a signal of a bull market top, or the beginning of an AI-driven “new paradigm”?
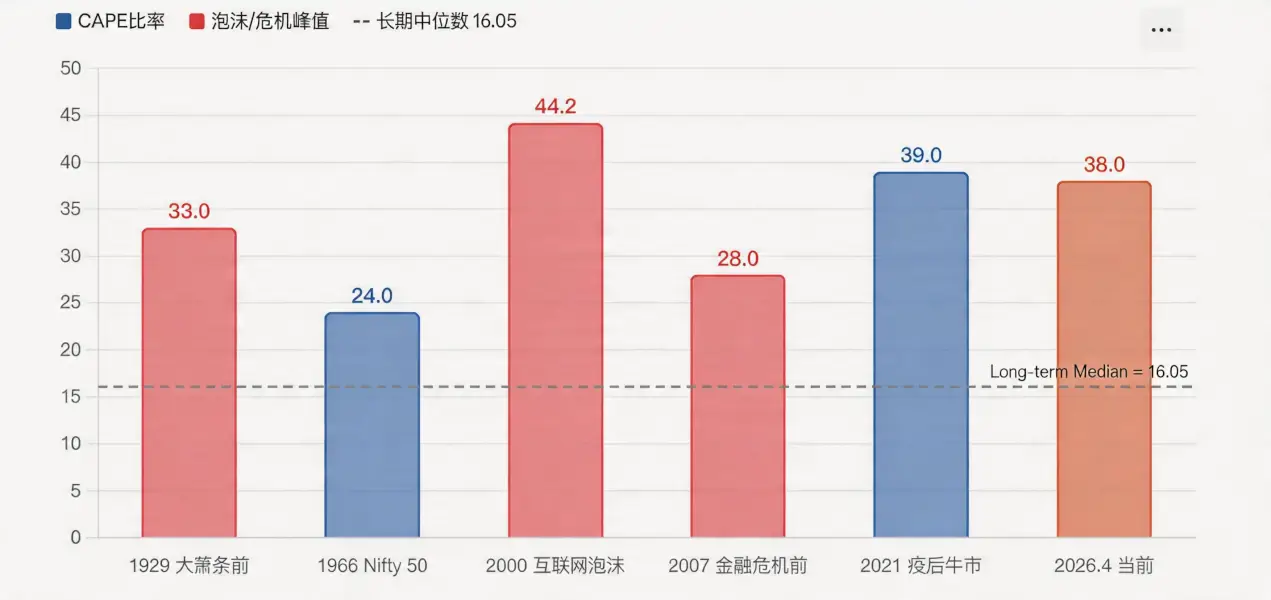
CAPE Ratio Touches 39, Second Only to 2000 Dot-Com Bubble Peak
The Shiller P/E (CAPE) is a valuation metric developed by Nobel laureate economist Robert Shiller. It calculates the price-to-earnings ratio using the average inflation-adjusted earnings over the past 10 years, aiming to eliminate the noise of short-term economic cycles.
According to a Motley Fool report in March, the S&P 500’s CAPE ratio reached 39.2 in February. Data from GuruFocus on April 1 shows the indicator at 38.66. Both readings are the second-highest in history, trailing only the peak of 44.2 during the 2000 dot-com bubble, while the long-term median is only 16.05.
Historically, CAPE has reached similar highs twice: in the late 1920s (followed by the Great Depression) and in 2000 (after the dot-com bubble burst, the S&P 500 plummeted 49% over two and a half years). According to Shiller’s research model, the current CAPE level corresponds to a future annualized return of only about 2%.
Motley Fool’s analysis points out that Shiller himself has expressed concern when CAPE exceeds 25, noting that since 1881, there have been only three periods above this level: around 1929, 1999, and 2007.
However, IndexBox’s report also acknowledges that a high CAPE does not automatically mean a crash is imminent, as the market has risen over 40% since the indicator broke above 30 at the end of 2023.
“Buffett Indicator” Breaks 230%, Setting a Half-Century Record High
Warren Buffett once called the 시장 Cap/GDP ratio “the best single measure of where valuations stand” in a 2001 Fortune magazine interview. He suggested at the time that 75%-90% was a reasonable range, and exceeding 120% indicated an overvalued market.
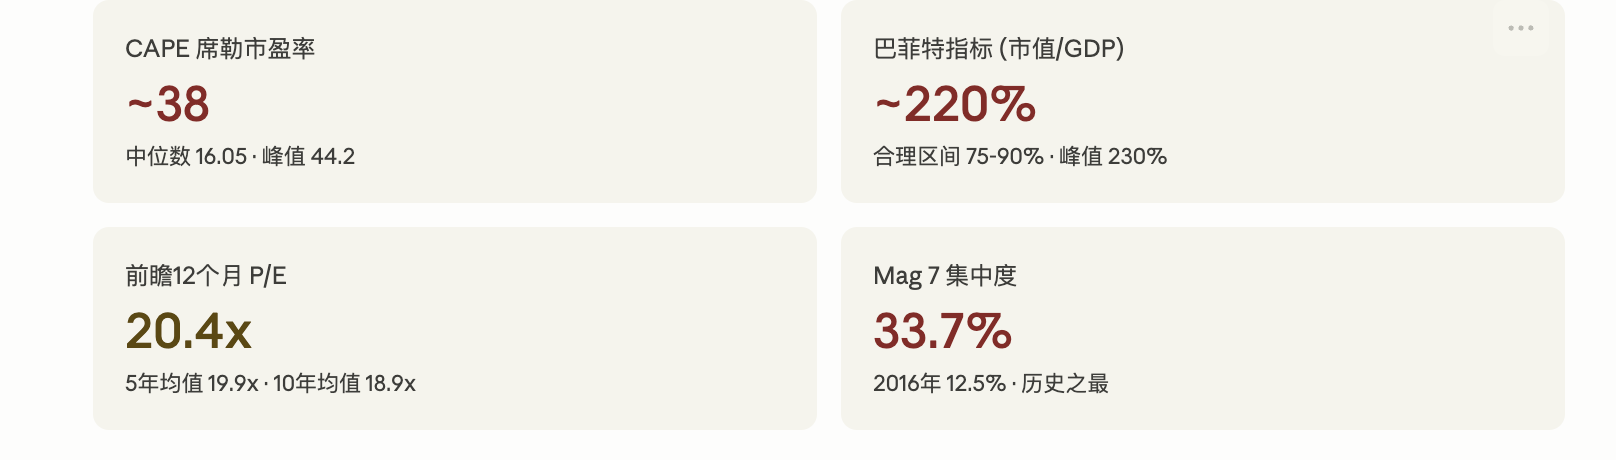
According to Advisor Perspectives data, by early 2026, this indicator once touched 230.3%, the highest level on record, approximately 2.09 standard deviations above the trend line, 디파이ned as “significantly overvalued.” The latest reading in March retreated to 227.5%, still the second-highest in history. Based on this ratio, GuruFocus projects an annualized return for U.S. stocks of approximately -0.3% over the next eight years.
According to GuruFocus data on April 14, the ratio was 219.5%. Critics point out that the indicator fails to fully account for two structural changes: first, U.S. corporate profit margins are significantly higher than historical averages, and second, large U.S. companies are generating an increasing share of their revenue from overseas (boosting market cap but not reflected in domestic GDP). However, proponents argue that even after detrending, the current reading remains in an extreme historical range.
Market Concentration at Modern History High, Mag 7 Exceeds 30%
Valuation is only one dimension of the problem. The structural risks of the market are equally concerning.
According to AhaSignals data on April 13, the top ten constituents of the S&P 500 account for 35.59% of the index’s weight, the top five for 25.97%, and the “Magnificent 7” (Mag 7) for 30.44%. The agency’s Aggregate Concentration Risk Index (ACRI) reads 81/100, at a “critical” level. According to Motley Fool data from April, the Mag 7’s weight in the S&P 500 has risen from 12.5% in 2016 to the current 33.7%.
A CNBC report in December 2025 cited a warning from Nick Ryder, CIO of Kathmere Capital: investors remain overly concentrated in the Mag 7, and he recommends diversifying beyond large-cap U.S. growth stocks. Ed Yardeni, president of Yardeni Research, suggested around the same time that investors underweight the Mag 7 and overweight the “other 493” (Impressive 493).
The practical risk from concentration is: when a handful of stocks dominate index movements, their decline can drag down the overall market with disproportionate force. The first quarter of 2026 has already provided preliminary evidence of this. According to 24/7 Wall St, Microsoft, Amazon, and Nvidia fell approximately 20%, 9%, and 6% year-to-date, respectively, dragging the market-cap-weighted S&P 500 down nearly 4%, while the equal-weight S&P 500 (RSP) was slightly positive over the same period.
Two Camps Face Off: “History Repeating” vs. “This Time Is Different”
Faced with this data, Wall Street’s judgment is sharply divided.
The core argument of the bearish camp is mean reversion in valuations. GMO co-founder Jeremy Grantham explicitly characterizes the current market as a large AI-driven bubble in his latest research. He points out that the actual revenue from current AI investments falls far short of the scale of capital expenditures, with OpenAI forecasting its own operating losses to reach $17 billion in 2026 and expand to $35 billion in 2027. GMO believes the classic signals of a bubble top (speculative stock collapses, quality stocks significantly outperforming) have not yet fully appeared, but this only means the bubble hasn’t peaked yet, not that it doesn’t exist.
IO Fund’s cycle analysis also leans cautious. The firm’s report notes that 2026 coincides with the convergence window of both the Gann 60-year grand cycle and the 4-year presidential cycle. Furthermore, every single stock in the Mag 7 peaked between July 2025 and February 2026, with core components quietly retreating as the index made its final new highs, which is a “classic late-bull warning signal.”
The bullish camp emphasizes the earnings fundamentals. According to FactSet data from April, the S&P 500’s forward 12-month P/E ratio is 20.4x. Although this is above the 10-year average of 18.9x, it has retreated from the 22x at the end of 2025. Analysts forecast full-year 2026 earnings growth for the S&P 500 at 17.6%. If this expectation materializes, the high valuation could be partially digested.
Jurrien Timmer, Director of Global Macro at Fidelity, offers a relatively moderate judgment: since the Iran conflict, the S&P 500’s maximum drawdown has been less than 10%, a decline that historically occurs on average once a year. Earnings expectations are still growing at a 17% annualized rate and have not yet been materially impacted by geopolitical headlines.
Morgan Stanley Investment Management also noted in its 2026 outlook that most bull markets last 5 to 7 years, and historically, bull markets entering their fourth year have all delivered positive returns. The bank’s allocation to non-U.S. stocks has risen to a historically high level.
BlackRock stated that the gains in tech stocks in 2025 were primarily driven by earnings growth rather than valuation expansion, and current valuations are reasonable based on growth expectations.
Overlaid Geopolitical Shock: Iran War and Stagflation Risk
Beyond the valuation debate, the macro environment adds extra uncertainty.
The Iran conflict pushed oil prices above $100 per barrel, and the S&P 500 briefly fell below its 200-day moving average in March. According to FinancialContent, the Fed’s March meeting maintained a “hawkish hold,” with the updated dot plot projecting only one more rate cut for the remainder of 2026. UBS, in a March 17 report, characterized the recent volatility as a “necessary reset of high valuations” rather than the start of a bear market, maintaining a year-end target of 7700 points.
Goldman Sachs has raised the probability of a recession within the next 12 months to about 30%. This resonates with the warnings from valuation indicators: historically, when an economic recession coincides with high valuations, the average peak-to-trough decline for the S&P 500 has been 32%. However, if earnings continue to grow (the FactSet consensus expects 17%), significant corrections have historically been limited in magnitude and recovered from relatively quickly.
For investors, the contradiction at the signal level is already clear. Long-term valuation indicators are almost universally flashing red, but short-to-medium-term earnings data remains strong. The market stands at a crossroads where “valuations say no” but “earnings say yes.” The outcome depends on whether AI capital expenditures can translate into sustained profits and whether geopolitical shocks ultimately translate into a recession.
이 글은 인터넷에서 퍼왔습니다: U.S. Stocks in the “Largest Bubble in History” Zone? Four Major Valuation Indicators Simultaneously Flash Red
Author | Asher (@Asher_0210) Last Friday, Genius, which received a “tens of millions of dollars” investment from YZi Labs and saw CZ personally join as an advisor, announced on X platform that the airdropped share is 21% of the total token supply. It is divided into three seasons: Season 1, Season 2, and Season 3, with each season accounting for 7%. Official original image. There is an obvious error in the image: the bottom right ‘Season 2’ should be ‘Season 3’. According to Genius’ previous statement, Season 1 will end before April 12th. More importantly, the TGE will occur before April 12th. Therefore, at the TGE before April 12th, the community airdrop share will be 7% of the total token supply, which means 70 million tokens will be airdropped. Genius…