Original translation by Luffy, Foresight News
TL;TR
- As long-term holders sell in batches and new participants take over the supply, the turnover rate of Bitcoin’s supply gradually slows down, resulting in a smoother transfer of ownership.
- Since the beginning of 2024, spot Bitcoin ETFs and 암호화폐 treasuries (DAT) alone have absorbed about 57% of the increase in supply from short-term holders, and now account for nearly a quarter of the total circulating Bitcoin over the past year.
- The continued stabilization of actual volatility indicates that the market structure is maturing, characterized by institutional demand dominating and a longer cycle.
After hitting an all-time high earlier this year, Bitcoin has largely been consolidating, briefly dipping below the $100,000 mark for the first time since June. Macroeconomic headwinds, a weak stock market, and a rare series of cryptocurrency liquidations have collectively dampened market sentiment, slowed capital inflows, and raised questions about the sustainability of the Bitcoin bull market. Furthermore, growing concerns about large holders transferring or selling early positions are putting pressure on Bitcoin and the overall cryptocurrency market. Following the recent decline, the current total market capitalization of cryptocurrencies is approximately $3.6 trillion.
Beyond the surface phenomena, Bitcoin’s on-chain data provides crucial context. In this article, we will explore how changes in Bitcoin holder behavior and core demand drivers influence market sentiment and 디파이ne the rhythm of this cycle. By analyzing changes in active supply and demand channels, we will investigate whether recent market volatility signals end-of-cycle profit-taking or a structural shift in Bitcoin ownership.
Supply distribution and institutional undertaking
Active supply
First, let’s look at Bitcoin’s active supply. This metric is divided by “time since the last on-chain move” and reflects the flow of tokens held for different years. It can clearly show the distribution of supply between “dormant tokens” and “recently moved tokens”.
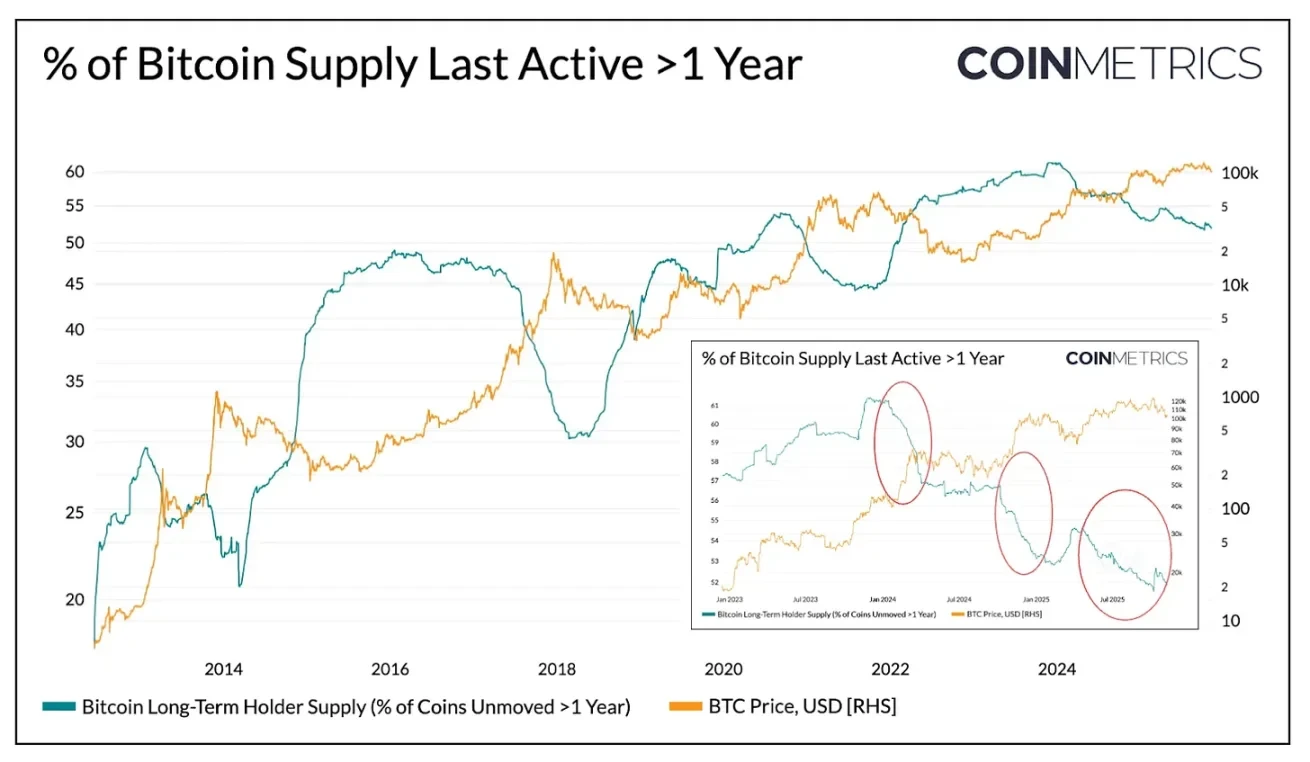
The chart below separately lists the percentage of Bitcoin supply held for more than a year without moving. This data can be used as a proxy indicator of the holdings of long-term holders (LTH). Historically, this percentage tends to rise during bear markets (as tokens concentrate in the hands of long-term holders) and fall during bull markets (as long-term holders begin moving their tokens, taking profits, and selling at higher prices).
Data source: Coin Metrics Network Data Pro
As of now, of the 19.94 million circulating Bitcoins, approximately 52% have remained unmoved for over a year, down from 61% at the beginning of 2024. Both the rate of increase during bear markets and the rate of decrease during bull markets have noticeably leveled off. Phased selling occurred in Q1 2024, Q3 2024, and recently in 2025. This indicates that long-term holders are selling their tokens in a more consistent manner, reflecting a lengthening cycle of ownership transfer.
ETFs and DAT: Core Drivers of Demand
Conversely, since 2024, the supply from short-term holders (tokens active over the past year) has steadily increased as previously dormant tokens have re-entered circulation. Simultaneously, the launch of spot Bitcoin ETFs and the accelerated accumulation of Crypto Treasury (DAT) tokens have created new and sustained demand, absorbing the supply distributed by long-term holders.
As of November 2025, the number of active Bitcoins over the past year was 7.83 million, an increase of approximately 34% from 5.86 million at the beginning of 2024 (dormant tokens recirculated). During the same period, holdings in spot Bitcoin ETFs and Strategy’s treasury increased from approximately 600,000 Bitcoins to 1.9 million, absorbing nearly 57% of the net increase in supply from short-term holders. Currently, these two channels together account for approximately 23% of the supply from short-term holders.
Although capital inflows have slowed in recent weeks, the overall trend shows that supply is gradually shifting to more stable, long-term holding channels, which is a unique feature of the market structure in this cycle.

Data source: Coin Metrics Network Data Pro & Bitbo Treasuries; Note: ETF supply excludes Fidelity FBTC, DAT supply includes Strategy.
Short-term and long-term holder behavior
Actual profit trends further confirm the flat nature of Bitcoin’s supply dynamics. The Spent Output Profit Ratio (SOPR) measures whether holders sell tokens at a profit or loss, clearly reflecting the behavioral patterns of different holder groups throughout market cycles.
In the past, the profit and loss realization of long-term and short-term holders often exhibited sharp and synchronous fluctuations. However, recently, this relationship has diverged: long-term holders’ SOPR remains slightly above 1, indicating that they are steadily realizing profits and moderately selling at higher prices.

Data source: Coin Metrics Network Data Pro
Short-term holders’ SOPR hovers near the break-even point, which explains the recent cautious market sentiment, as many short-term holders’ positions are close to their cost price. This divergence in behavior between the two types of holders reflects a more leveling market phase: institutional demand is absorbing the supply from long-term holders, rather than a return to the sharp fluctuations of the past. If the short-term holders’ SOPR continues to break above 1, it could indicate strengthening market momentum.
While a full-blown correction will still compress the profitability of all holders, the overall pattern shows a more balanced market structure: supply turnover and profit realization are both progressing gradually, extending the cyclical rhythm of Bitcoin.
Bitcoin volatility decreased
This structural smoothing is also reflected in Bitcoin’s volatility, which has been trending downwards over the long term. Currently, Bitcoin’s 30-day, 60-day, 180-day, and 360-day realized volatility is stable at around 45%-50%, whereas in the past its volatility was often highly explosive, leading to significant market fluctuations. Now, Bitcoin’s volatility characteristics are increasingly resembling those of large-cap tech stocks, indicating that it has matured as an asset. This reflects both improved liquidity and a more institutionally-driven investor base.
For asset allocators , declining volatility could increase the attractiveness of Bitcoin in their portfolios, especially given that its correlation with macro assets such as stocks and gold remains dynamic.

Data source: Coin Metrics 시장 Data Pro
결론적으로
Bitcoin’s on-chain trends indicate that this cycle is progressing in smoother, longer phases, without the frenzied surges of previous bull markets. Long-term holders are selling in batches, with most of the selling being absorbed by more sustainable demand channels (ETFs, DAT, and broader institutional holdings). This shift signifies a maturing market structure: lower volatility and velocity of circulation, and longer cycles.
Nevertheless, market momentum still hinges on sustained demand. Flattening ETF inflows, pressure on some DAT tokens, recent market-wide liquidations, and short-term holders’ SOPR nearing the break-even point all highlight that the market is in a readjustment phase. A continued increase in long-term holder supply (tokens held for over a year without movement), SOPR breaking through 1, and renewed inflows into spot Bitcoin ETFs and stablecoins could all be key signals of a return to market momentum.
Looking ahead, easing macroeconomic uncertainties, improved liquidity conditions, and regulatory progress related to market structure may reignite capital inflows and extend the bull market cycle. Although market sentiment has cooled somewhat, the market fundamentals are healthier, supported by recent deleveraging adjustments and the expansion of institutional channels and the widespread adoption of on-chain infrastructure.
이 글은 인터넷에서 퍼왔습니다: Why has this Bitcoin cycle been prolonged?Recommended Articles
目录 1.什么是稳定币公链 1.1 稳定币公链的提出动因 1.2 稳定币在公链上的价值分配 1.3 稳定币公链的概念 1.4 稳定币公链 vs 传统公链 2.典型项目 2.1 Plasma 2.2 Stable 2.3 Arc(Circle) 2.4 Tempo(Stripe) 2.5 主流稳定币驱动下的生态对比分析 3.稳定币公链的经济模型与生态设计 4.支付体系演进与稳定币公链分析 5.监管与合规对稳定币公链的影响 6.竞争格局与发展推演 6.1 稳定币公链赛道现状 6.2 Tether、Circle 与支付巨头的链上博弈 6.3 稳定币公链与传统公链的竞争格局 6.4 发展推演 7.挑战与展望 参考 前言 近年来,稳定币已经成为加密金融体系中最核心的资产类别之一。以 USDT 与 USDC 为代表的美元稳定币,总市值已超过千亿美元规模,不仅在二级市场交易中充当了最主要的结算与报价资产,更逐渐渗透到跨境支付、链上金融、企业资金管理等更广泛的场景中。加上近年来稳定币相关政策的出台,稳定币的重要性将在未来进一步放大。 因此,稳定币不仅是 Web3 与传统金融之间的重要桥梁,也可能在很大程度上决定 Web3 未来的形态和发展方向。在公链竞争格局中,能够吸引并留住最多稳定币的链,通常也会形成最强的金融生态,从而在应用创新、资金流动和用户粘性方面占据先机。 然而放眼现有公链生态,稳定币扮演着十分重要的角色。无论是 DeFi 协议的抵押与结算,还是中心化交易所的主要交易对,或是链上支付的流通媒介,稳定币都处于价值传输的核心环节。但当前主要承载稳定币的公链,如以太坊、TRON、Solana 等,最初的设计并非专门为稳定币而生,因此在性能、合规与生态匹配度等方面可能存在一定局限。历史经验告诉我们,稳定币的成功要素并非复杂的金融设计,而在于简单、稳定、低成本、高性能且具备可扩展性与合规性的基础设施。 在这样的背景下,稳定币公链这一赛道,承载着为稳定币量身定制基础设施的期待。它的目标是解决现有公链在成本、效率、合规性和生态绑定方面的不足,从而推动稳定币进入更大规模的应用。但与此同时,如何确保资产稳定性、流动性可持续性,以及在监管框架下构建真正可用的生态网络,是稳定币公链必须要思考的问题。稳定币公链正处于巨大机遇与挑战并存的时刻。 1. 什么是稳定币公链 1.1 稳定币公链的提出动因 稳定币公链的提出,源自多方面的实际需求与发展动因。目前主流稳定币依托的公链,如以太坊、TRON 等,并非为稳定币量身定制。这种外部依赖带来了一些问题:高额 Gas 成本、交易性能瓶颈、跨链体验割裂,以及在合规监管上的不确定性。由此,设计专门针对稳定币的公链成为一种趋势,旨在打造一个更加稳定、可靠的基础设施。 稳定币公链试图通过构建一体化的生态闭环,实现稳定币的发行、流通、结算和应用全部在同一条链上完成。这不仅提升了效率,也增强了生态的自洽性和安全性。金融机构和支付巨头的需求也在推动这一方向发展,它们希望有一条符合合规要求的链路,配套完善的身份体系和监管接口,以满足合规化运营的要求。 总体来看,稳定币公链的核心目标可以归纳为三个方面。第一,提供稳定、低成本且高速的支付能力,解决现有公链在性能和费用上的痛点。第二,确保合规与可追溯性,以满足金融机构和支付巨头在监管环境下的使用需求。第三,具备可编程金融能力,使其能够在链上同时承载 DeFi、RWA 以及合规支付 API 等应用。凭借这些特征,稳定币公链有望成为连接加密金融与现实金融体系的重要桥梁。 1.2 稳定币在公链上的价值分配 稳定币不仅是 Web3 生态的核心计价和结算工具,同时也在公链上创造了可观的经济价值。以 USDT 为例,其流通量最大的两条公链分别是 Ethereum 和 TRON。根据数据统计,在以太坊上,过去一年因 USDT 交易产生的 Gas 费,折算为美元约有五千万到一亿。这部分手续费直接贡献了区块链验证者的收入,也间接形成了公链所在的生态价值。 同样,USDC 的流通量在 Ethereum 上占比超过 60%,以太坊上因 USDC 交易产生的 Gas 费全年累计超过五千万美元。这进一步说明,大型稳定币在主流公链上产生的链上经济活动巨大,其手续费收入对于所在公链和整个生态系统都具有重要意义。 然而面对如此巨大的手续费收入,USDT 和 USDC 的发行方 Tether 和 Circle 却无法从中获利,所有手续费都流向了所在公链。因此,稳定币发行方想要构建自己的公链,不仅是要构建自己的生态闭环,更希望能拿回属于自己的流量和财富。 1.3 稳定币公链的概念 稳定币公链是指专门围绕稳定币的发行、流通与应用而设计的区块链网络。它不同于传统意义上的通用公链,并非以承载所有类型的应用为目标,而是聚焦于稳定币这一类资产的高效流通与可持续运行。 目前稳定币公链主要呈现出两类发展路径: • 稳定币驱动型链:由稳定币项目方或相关团队推动,以稳定币作为链上经济的核心驱动力,例如 Plasma、Stable 等项目。它们的设计重点是降低交易成本、提升 TPS,并为稳定币量身定制基础设施。 • 稳定币发行方主导链:由大型稳定币发行方或支付巨头主导建设,例如未来可能由支付巨头 Stripe 推出的链。这类链的优势在于可以直接整合合规框架、身份体系与支付接口,天然契合机构用户与跨境支付需求。 稳定币公链不同于通用公链的广覆盖,而是在稳定币这一关键资产上形成专注和深耕。 1.4 稳定币公链 vs 传统公链 在现有的区块链生态中,以太坊、TRON、Solana 等通用公链,承载了稳定币的大部分流通与结算。但这些公链的设计目标是构建多资产、多应用的综合生态,稳定币只是其中的一种核心资产。因此,稳定币的发展不可避免地受到外部环境的制约,例如高昂的 Gas 费用、有限的 TPS、跨链割裂以及合规适配上的不确定性。 相比于以太坊、TRON 等通用公链,稳定币公链的独特价值在于,它从底层就围绕稳定币的运行环境进行优化。首先,在成本方面,稳定币公链能够支持小额支付与高频交易,显著降低用户的使用门槛。其次,部分稳定币公链在设计上预留了身份验证与监管接口,天然契合金融机构和支付公司对合规性的要求。更重要的是,稳定币公链能够将发行、流通、结算与应用整合在同一条链上,形成一个完整的闭环生态,从而减少跨链摩擦,提升整体效率与安全性。 这些特性决定了稳定币公链的潜在用户群体也十分明确。支付公司和金融机构是最直接的受益者,它们希望在合规环境下将稳定币接入支付与清算网络;稳定币发行方则能够借此减少对外部公链的依赖,掌握交易体验与合规主动权;而对于交易所和金融应用而言,稳定币公链则意味着更高效、成本更低的结算底层,帮助提升用户体验。 2. 典型项目 2.1 Plasma 专为稳定币设计的 Layer1 基础设施…