Illustrating the Private Credit Crisis: Blue Owl Plummets 66%, How Did Goldman Sachs “Escape Death”?
Mainstream financial media quickly framed this as a “retail private credit narrative collapse” and “AI disruption of software companies spilling over to creditors.” However, these labels obscured a more critical fact. In the same week, Goldman Sachs Asset Management’s Goldman Sachs Private Credit Corp reported that its Q1 redemption requests amounted to 4.999% of its shares, a mere 0.001 percentage point shy of the 5% gate. This made it one of the few, and possibly the only, large semi-liquid perpetual BDC among its peers that did not trigger the gate, allowing for full payout to redeeming investors. This redemption wave is not a “private credit crash” but a clear case of K-shaped divergence.
According to a Bloomberg report on April 6, Goldman’s $15.7 billion fund was the outlier that “Dodges Exodus” this quarter. In contrast, Blue Owl’s OTIC redemption rate was 8.1 times that of Goldman’s, and OCIC’s was 4.4 times. While market attention was fixated on Blue Owl’s plunge, the truly pertinent question is why two institutions, with the same structure, in the same week, facing the same 5% gate, experienced completely different outcomes.
Stock Price Evaporates by Two-Thirds in Fifteen Months
First, look at the market’s pricing of Blue Owl. According to Yahoo Finance historical weekly data, Blue Owl Capital (OWL) closed at $25.02 during the week of January 20, 2025, marking its historical peak. By the week ending April 6, 2026, it closed at $8.45, a 66.2% decline over fifteen months, erasing nearly two-thirds of its market value.
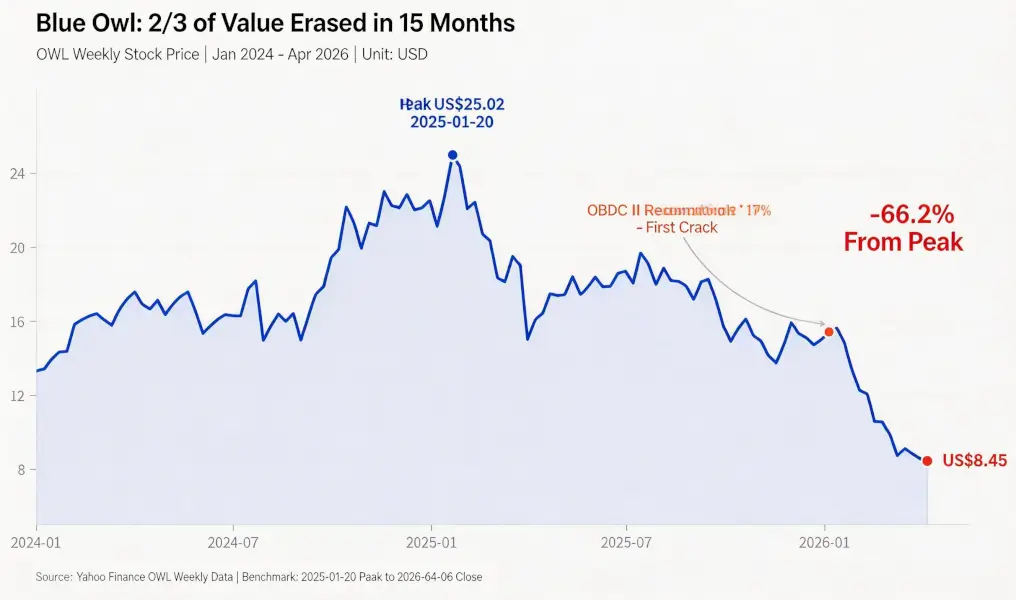
The first significant crack in the stock price appeared in early January 2026, when another Blue Owl fund, OBDC II (a smaller non-public BDC), disclosed redemption requests equivalent to 17% of its outstanding shares, seen as the “first fissure.” The stock price trended downward thereafter until the end of Q1, when both flagship funds, OTIC and OCIC, triggered their gates simultaneously. On Monday, the stock briefly hit an absolute low of $7.80, its lowest point since listing.
Interestingly, Blue Owl’s stock price decline (-66.2%) far outpaced the deterioration of its fundamentals. OCIC still boasts $36 billion in AUM, with its net asset value declining about 6.5% in Q1 2026. The company’s overall AUM remains above $290 billion. The market is clearly repricing the company based on two factors: “future redemption uncertainty” and “collapse in valuation confidence,” rather than just current performance.
The Same Gate, Two Different Fates
The cross-sectional view truly clarifies the “K-shaped divergence.” Placing the five large semi-liquid perpetual BDCs that publicly disclosed redemption data for Q1 2026 side by side reveals a clear structure.
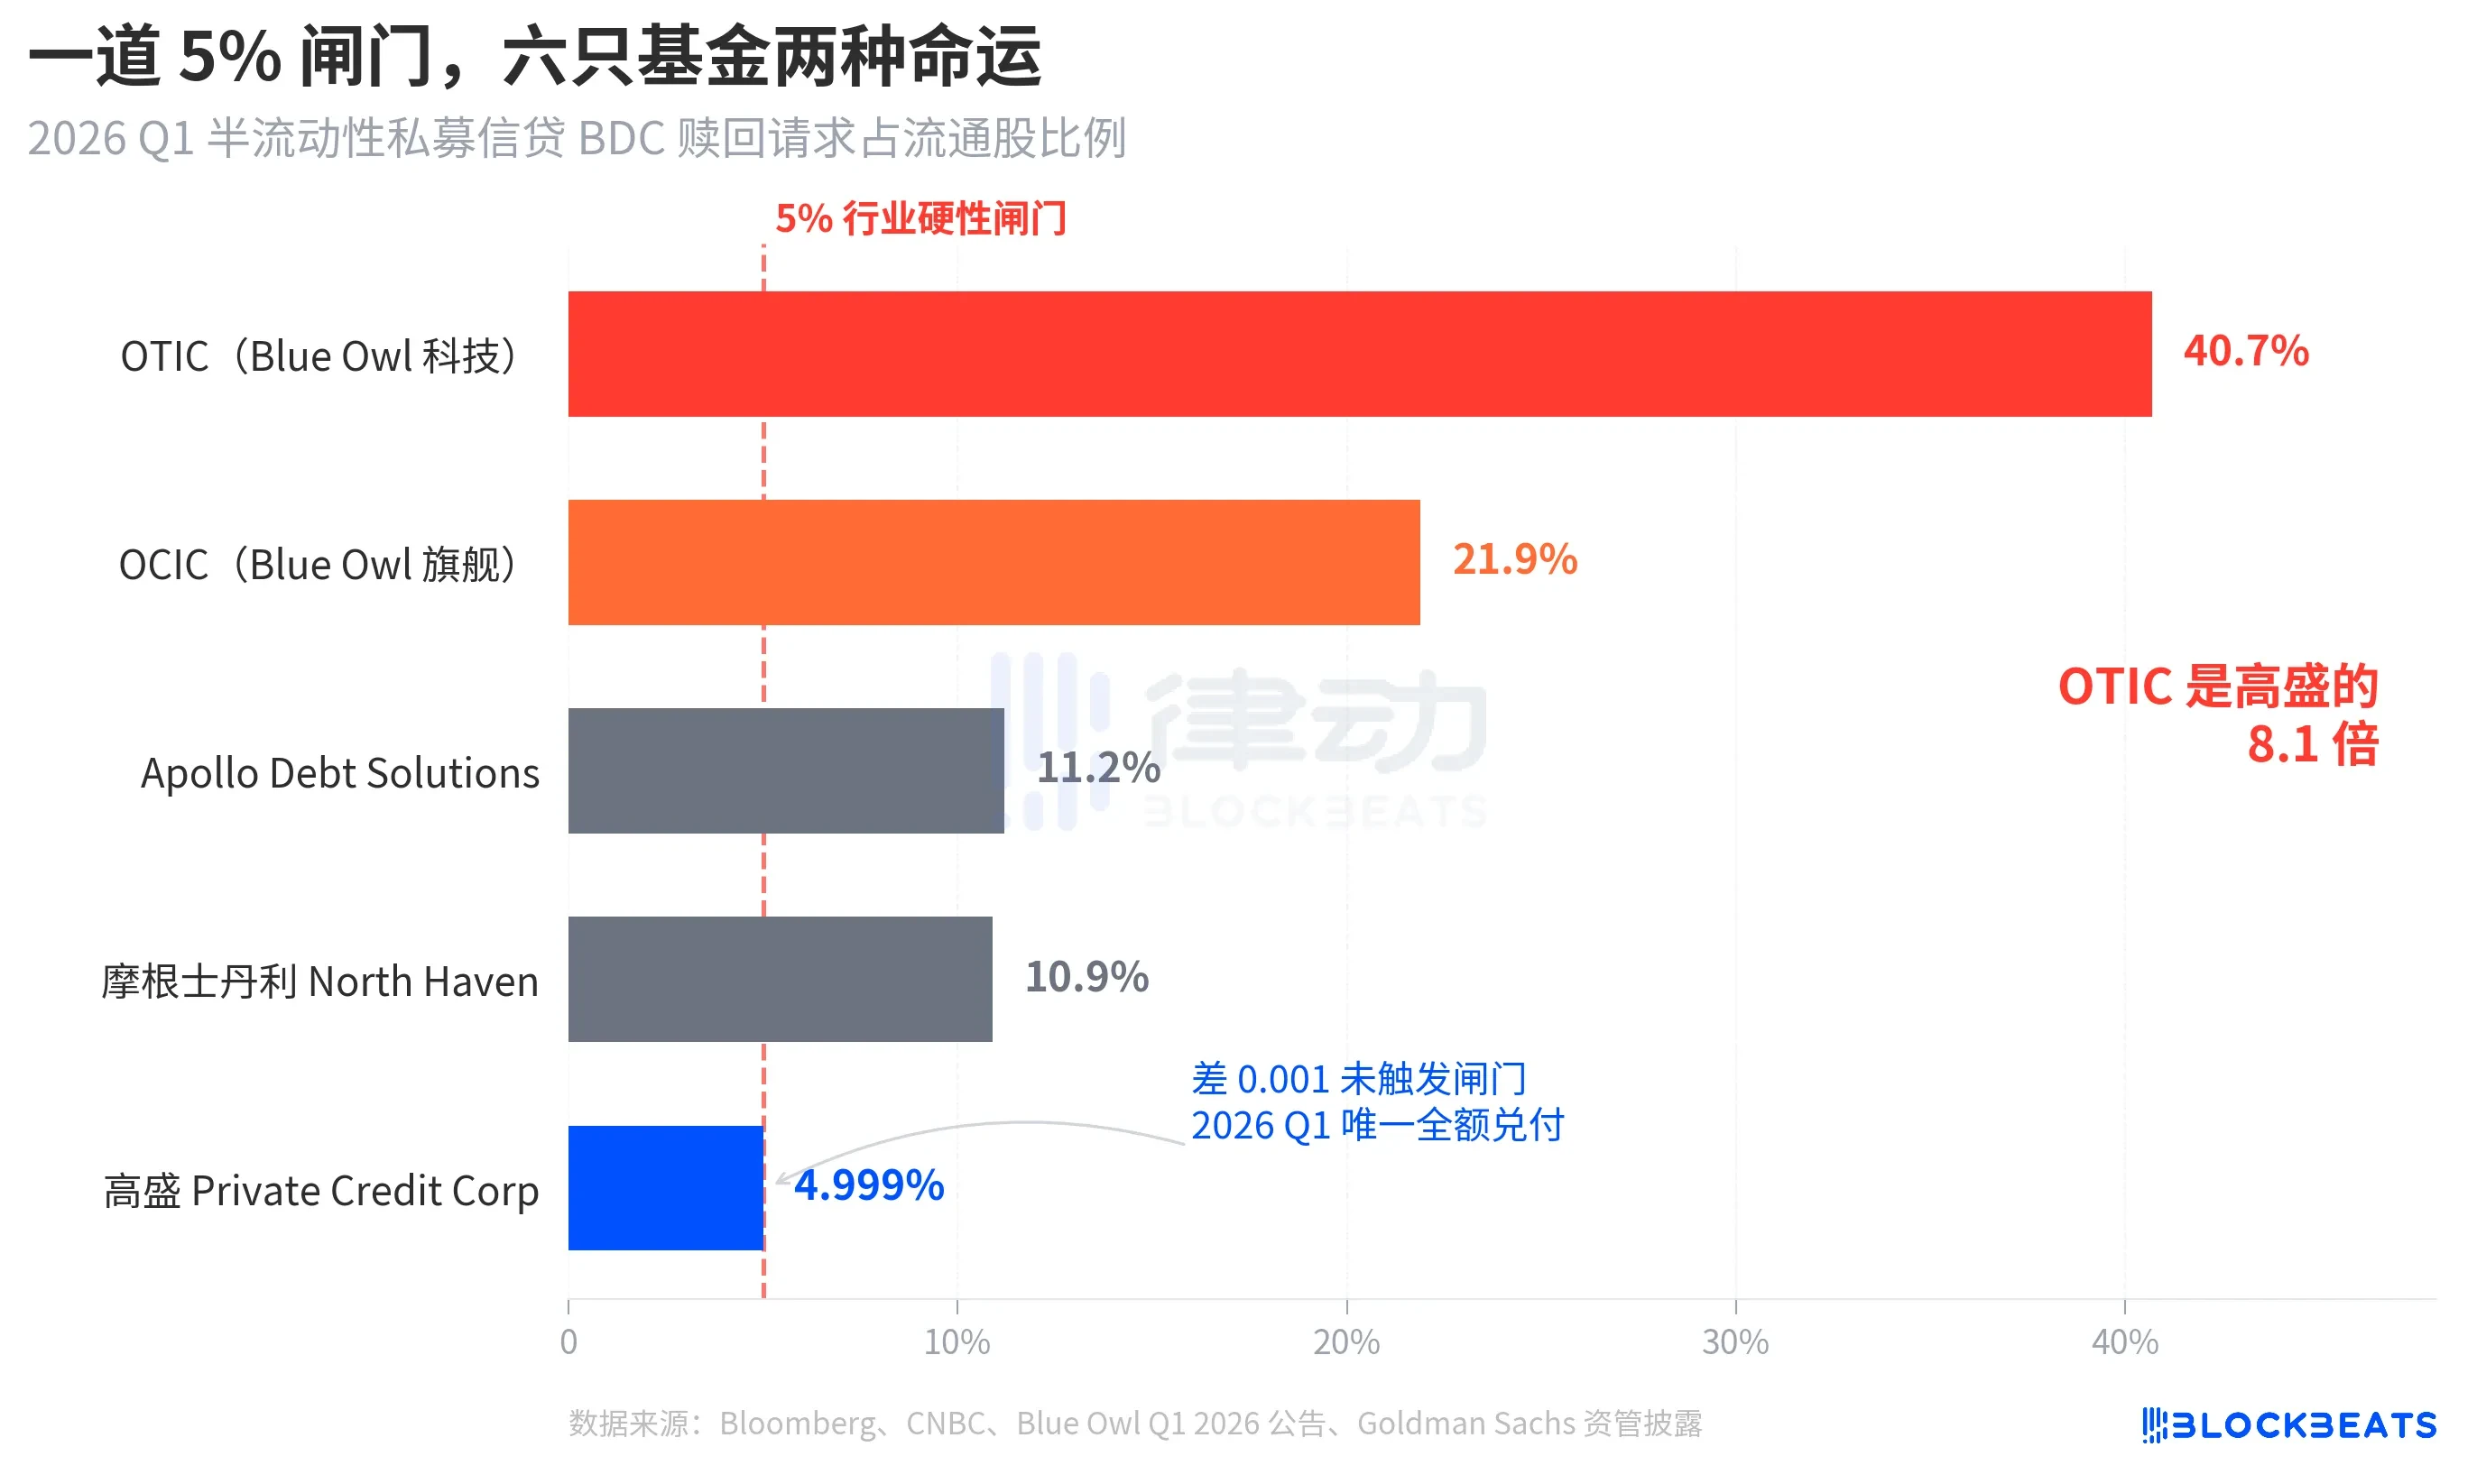
According to Bloomberg, CNBC, and company announcements, the redemption rates for the five funds are as follows: Blue Owl OTIC 40.7%, Blue Owl OCIC 21.9%, Apollo Debt Solutions 11.2%, Morgan Stanley North Haven Private Income Fund 10.9%, and Goldman Sachs Private Credit Corp 4.999%. These five funds can be roughly categorized into three tiers.
Upper Tier: Blue Owl’s two funds far exceeded the gate. Nearly half of OTIC’s holders sought to exit, while OCIC’s requests were nearly four times the gate limit. Following the rules, only a maximum of 5% of outstanding shares were redeemed. OTIC paid out approximately $179 million, and OCIC paid out about $988 million. The remaining over $4.2 billion in redemption requests were locked behind the gate.
Middle Tier: Apollo and Morgan Stanley’s redemption rates fell between 10% and 11%. According to Bloomberg reports on March 11 and March 23, Apollo Debt Solutions paid out about 45% of requests, and North Haven paid out about 46%. Based on industry explanations from PitchBook and iCapital, they also triggered their gates, but the pressure was significantly less than for Blue Owl.
Lower Tier: Only Goldman Sachs. Its 4.999% rate was the only one among large funds that did not trigger the 5% gate during the period, allowing for 100% payout of all redemption requests.
Bloomberg’s headline used “Dodges Exodus.” The fact that OTIC’s rate was 8.1 times that of Goldman’s illustrates the intensity of the divergence. In the same week, with the same type of structure and the same rules, the fates of the two institutions were completely different.
The Bubble: Retail Investors Inflated It by 4.4 Times
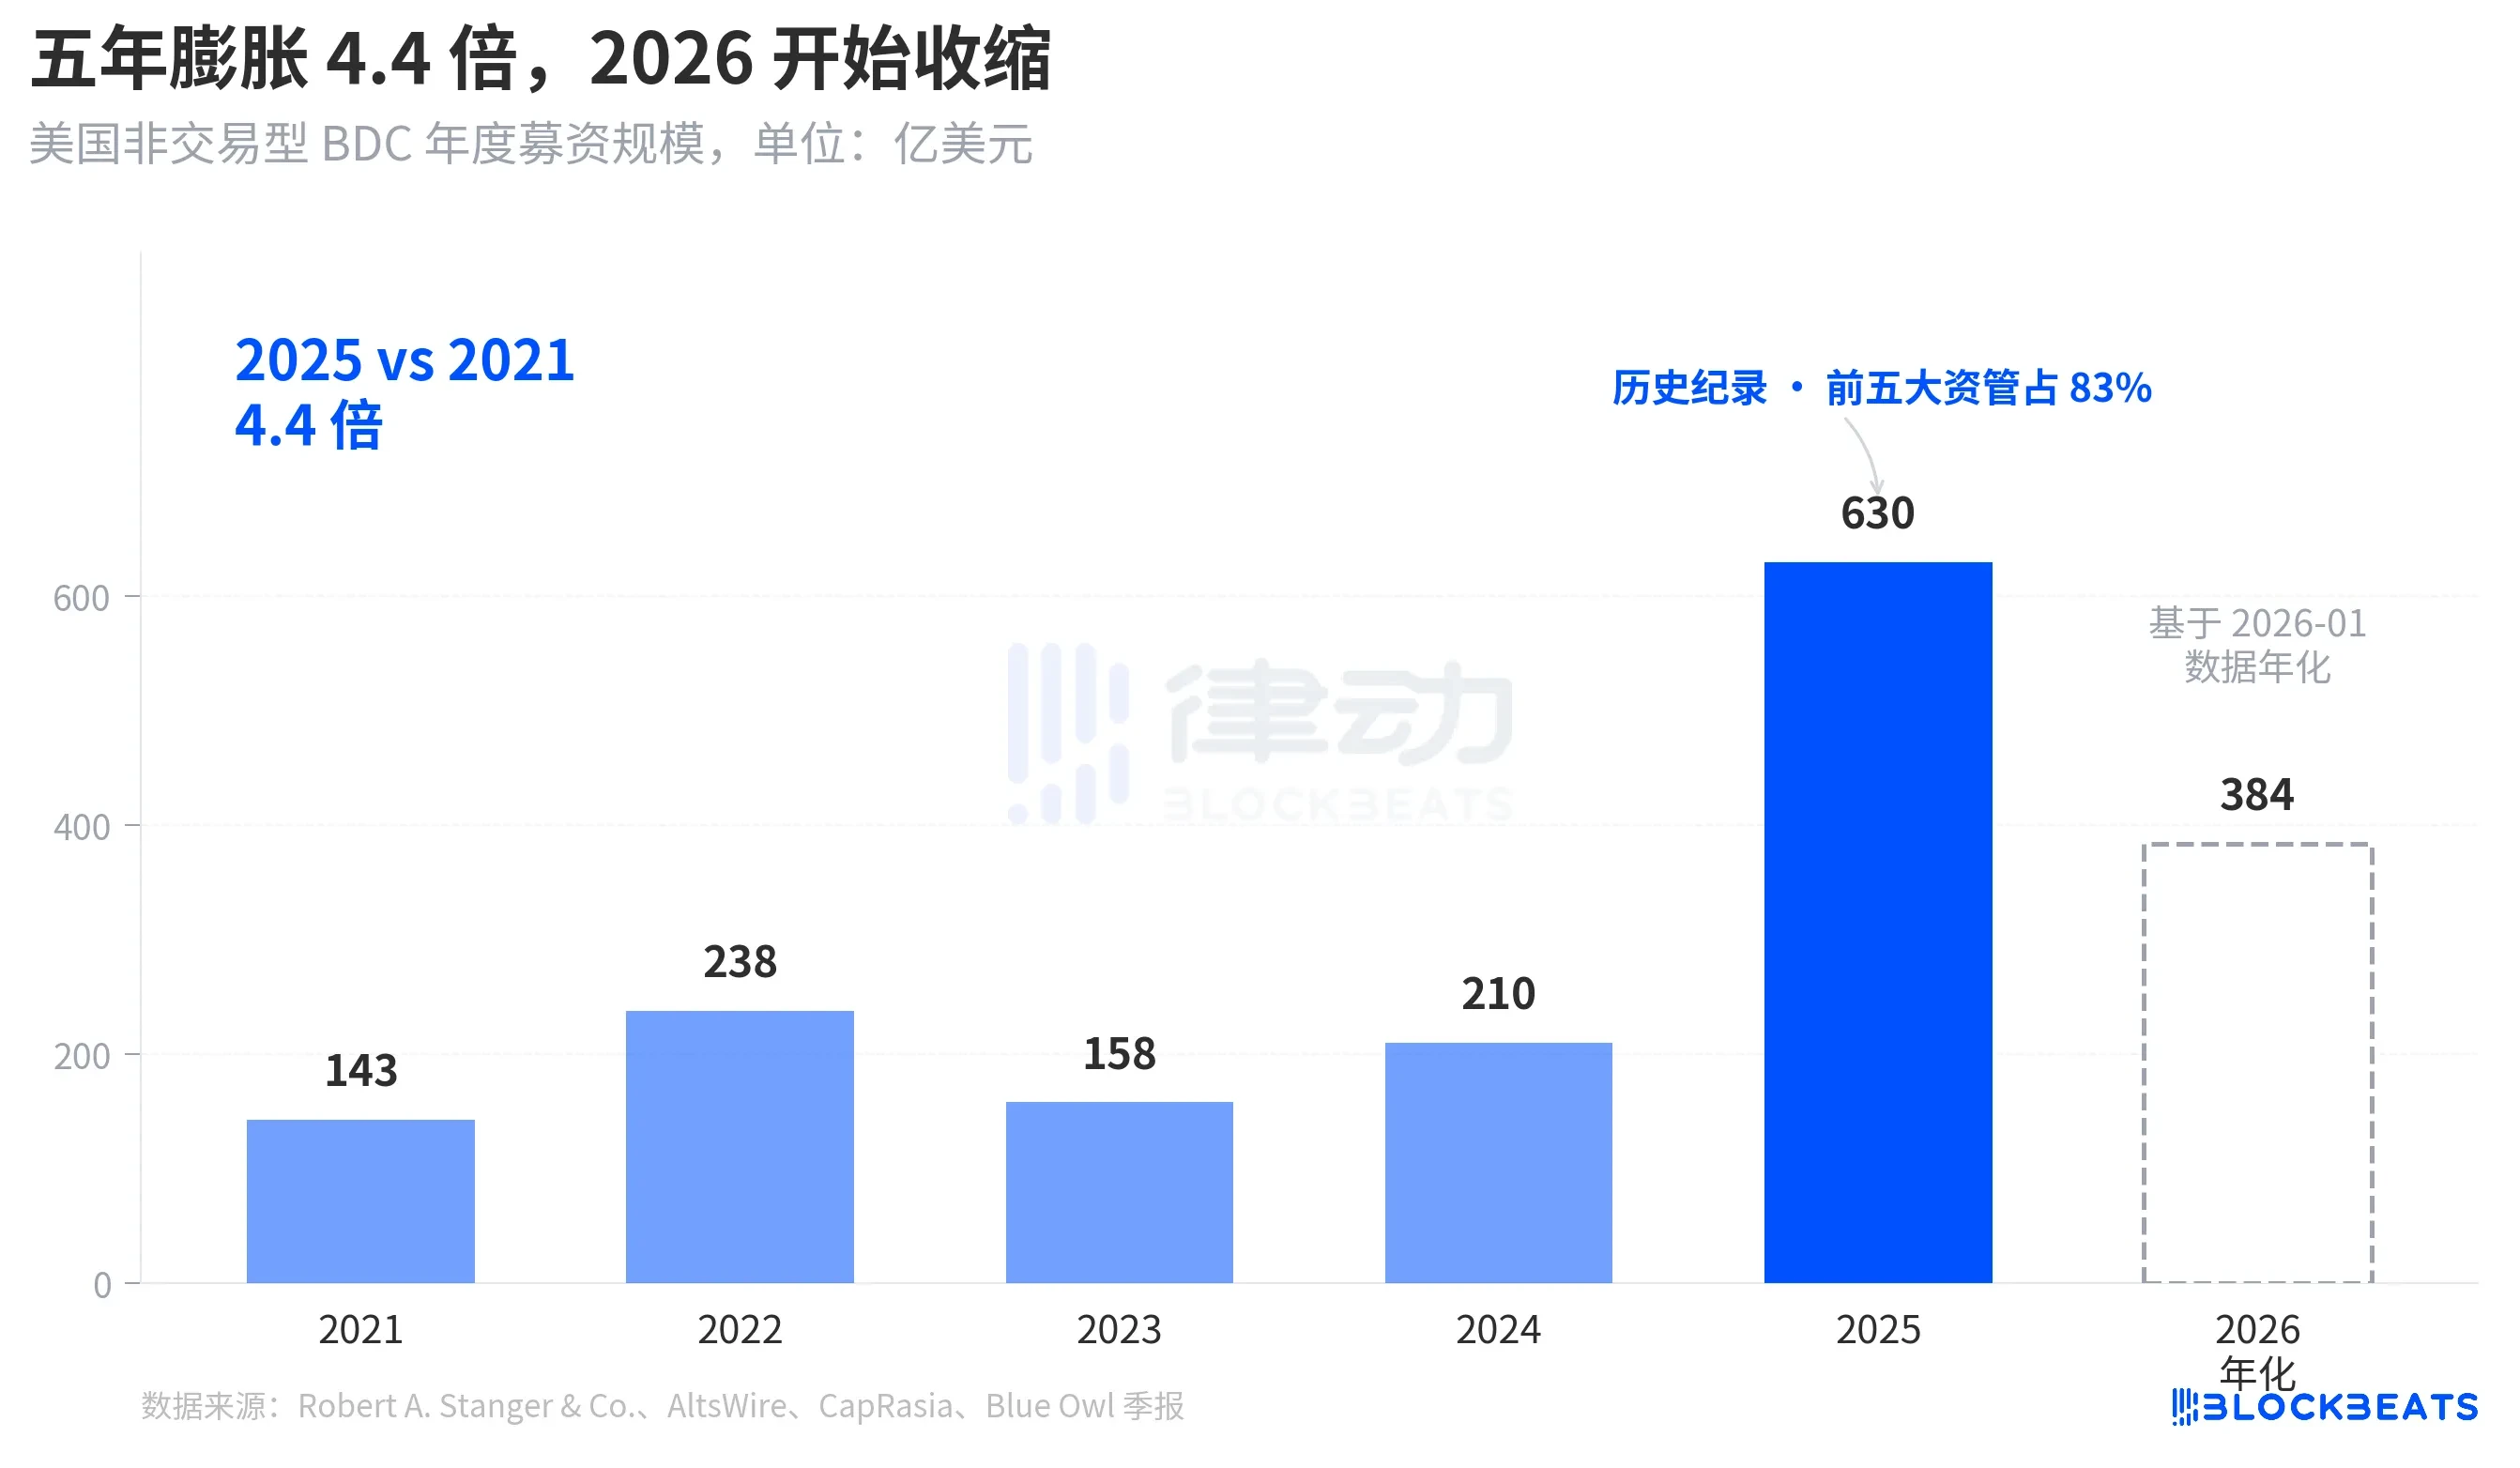
To understand why this redemption wave hit so hard, one must first see how much capital flowed in. According to industry statistics from Robert A. Stanger & Co., the annual fundraising scale for US non-traded BDCs over the past five years shows a distinct parabolic curve.
From $14.3 billion for the full year 2021, it reached a historical record of $63 billion for the full year 2025, a 4.4-fold increase over five years. The same statistics show that in 2025, the top five institutions (Blackstone, Blue Owl, Apollo, Ares, and HPS) captured about 83% of that, approximately $52.3 billion concentrated in the top five. The retail capital that poured in over the past five years was not only massive in total but also extremely concentrated in its distribution.
However, by January 2026, Stanger’s monthly data showed non-traded BDC fundraising was only $3.2 billion, nearly halved compared to the peak of $6.2 billion in March 2025. According to reports from Connect Money and FinancialContent, overall BDC sales in Q1 2026 declined by about 40% year-over-year. In the same quarter investors began requesting redemptions en masse, new inflows were visibly decelerating. Rising redemption pressure and declining new subscriptions occurred simultaneously, pushing against the gate harder than anyone anticipated.
This is not a cyclical pullback. It is the first time, at the capital level, that the narrative of semi-liquid perpetual BDCs being sold to retail investors as “savings-like products” is being re-examined.
From BREIT to Blue Owl: Vulnerability Gradually Materialized Over Four Years
Placing this redemption wave on a longer timeline reveals it did not erupt suddenly.
The “semi-liquid perpetual” structure makes two promises. It allows the fund to remain unlisted and not publicly valued, while promising investors they can redeem a portion of their shares quarterly at NAV. Essentially, it packages illiquid assets (private credit, private real estate) into a product that “appears to be withdrawable at any time.” To prevent runs, the industry uniformly set a 5% quarterly redemption gate. If quarterly redemption requests exceed 5% of outstanding shares, the fund pays out proportionally, locking the remaining requests to wait until the next quarter.
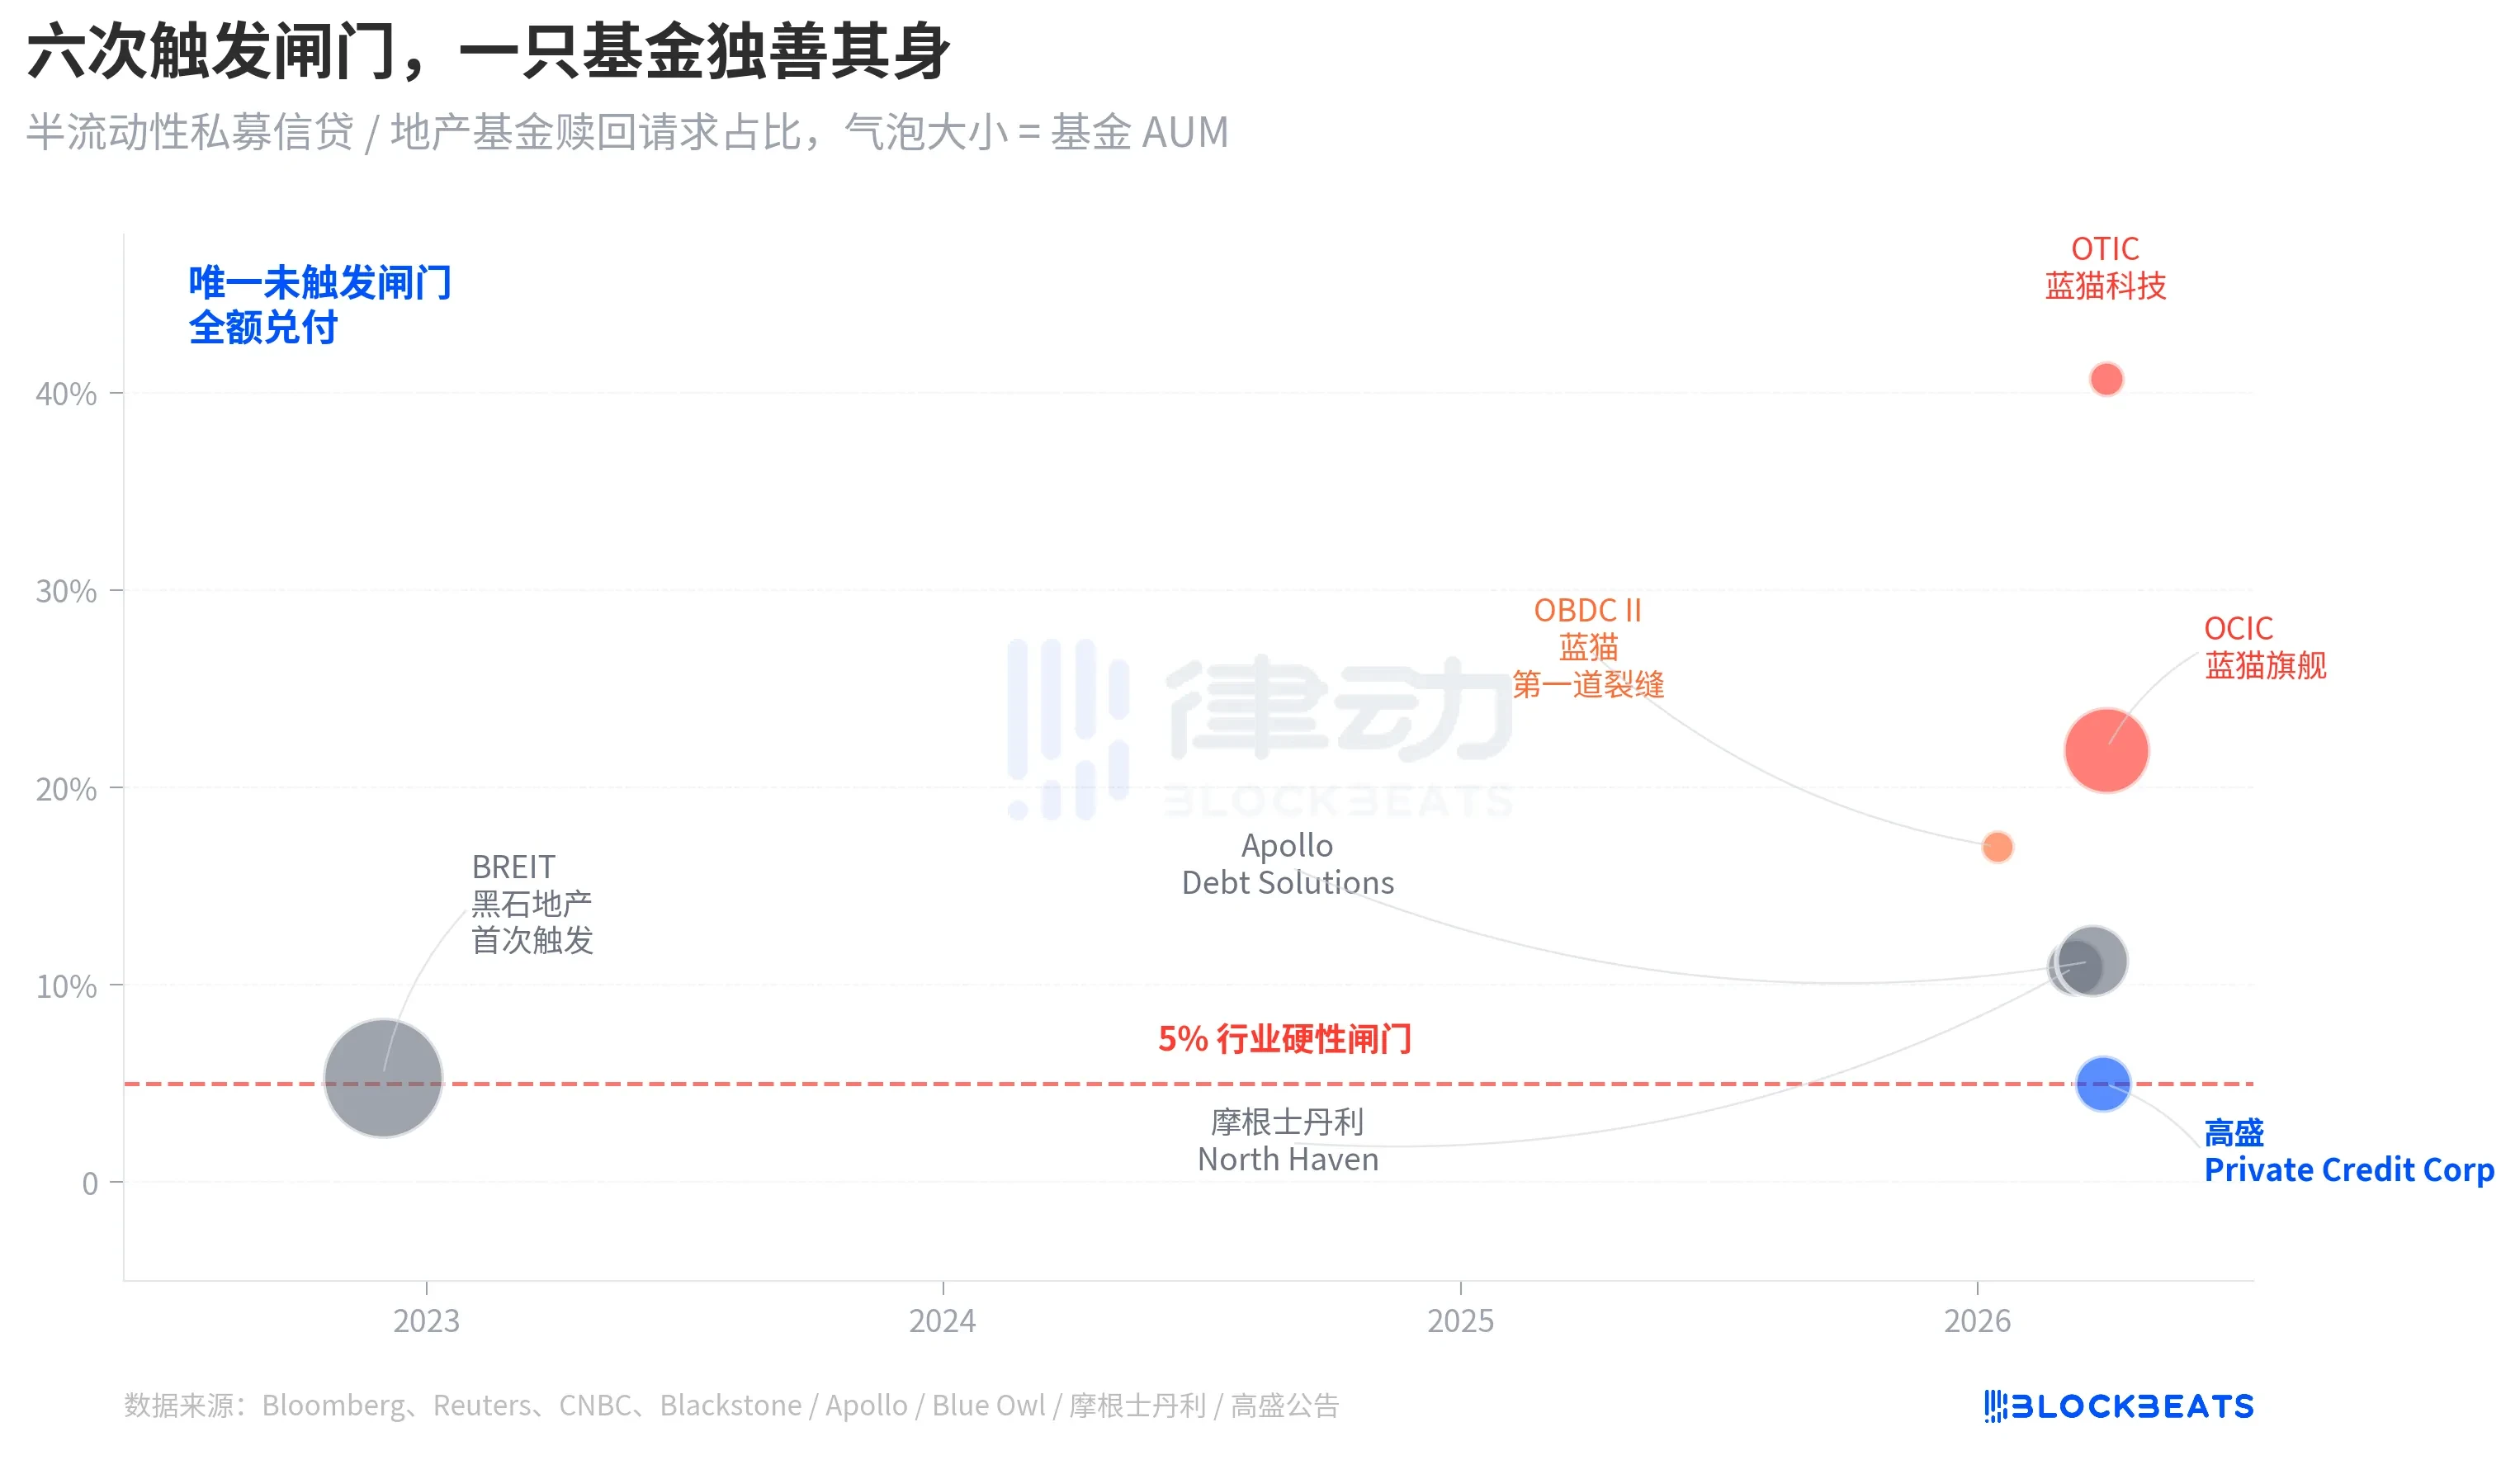
In November 2022, Blackstone’s non-traded real estate trust, BREIT, first triggered this gate, marking the first systemic liquidity event for the perpetual semi-liquid structure. According to Caproasia data, in January 2023, BREIT only paid out 25% of all requests for that month. Cumulatively, by November 2023, BREIT had paid out $14.3 billion in redemption requests. That episode was interpreted as an isolated event within the real estate asset class; the private credit market was not dragged down.
Four years later, the same fissure spread from real estate to credit. In January 2026, Blue Owl OBDC II disclosed a 17% redemption request, becoming the first signal. On March 11, Morgan Stanley’s North Haven triggered its gate. On March 23, Apollo Debt Solutions triggered its gate. On April 2, Blue Owl’s OCIC and OTIC simultaneously triggered their gates. Within seven days, large BDCs from four major asset managers consecutively breached the same threshold, while Goldman Sachs, with a 4.999% gap, remained outside the gate in the same quarter.
The structural fragility of semi-liquid perpetual BDCs was not exposed solely by Blue Owl’s current redemption wave; it has been on the table since the BREIT incident in 2022. It’s just that no one truly took it seriously over the past four years.
Root Cause: OTIC’s 80% Exposure to Tech and Healthcare
Now, back to the key question: why, with the same structure and the same week, the outcomes for Goldman and Blue Owl differed by a factor of 8. Dissecting OTIC’s investment portfolio provides a clear answer.
According to a KBRA rating report and Blue Owl OTIC’s Q4 2024 financial disclosure, as of the end of 2025, OTIC’s investment portfolio was valued at $6.2 billion, holding 190 companies across 39 end markets. Among these, 92% were backed by private equity funds, and 93% were first-lien senior secured loans. On paper, this appears to be a fund of decent quality. However, its industry concentration is quite unique. Systems software accounted for 16.1%, healthcare technology for 13.0%, and application software for 12.4%. These three sub-sectors alone constituted 41.5%.
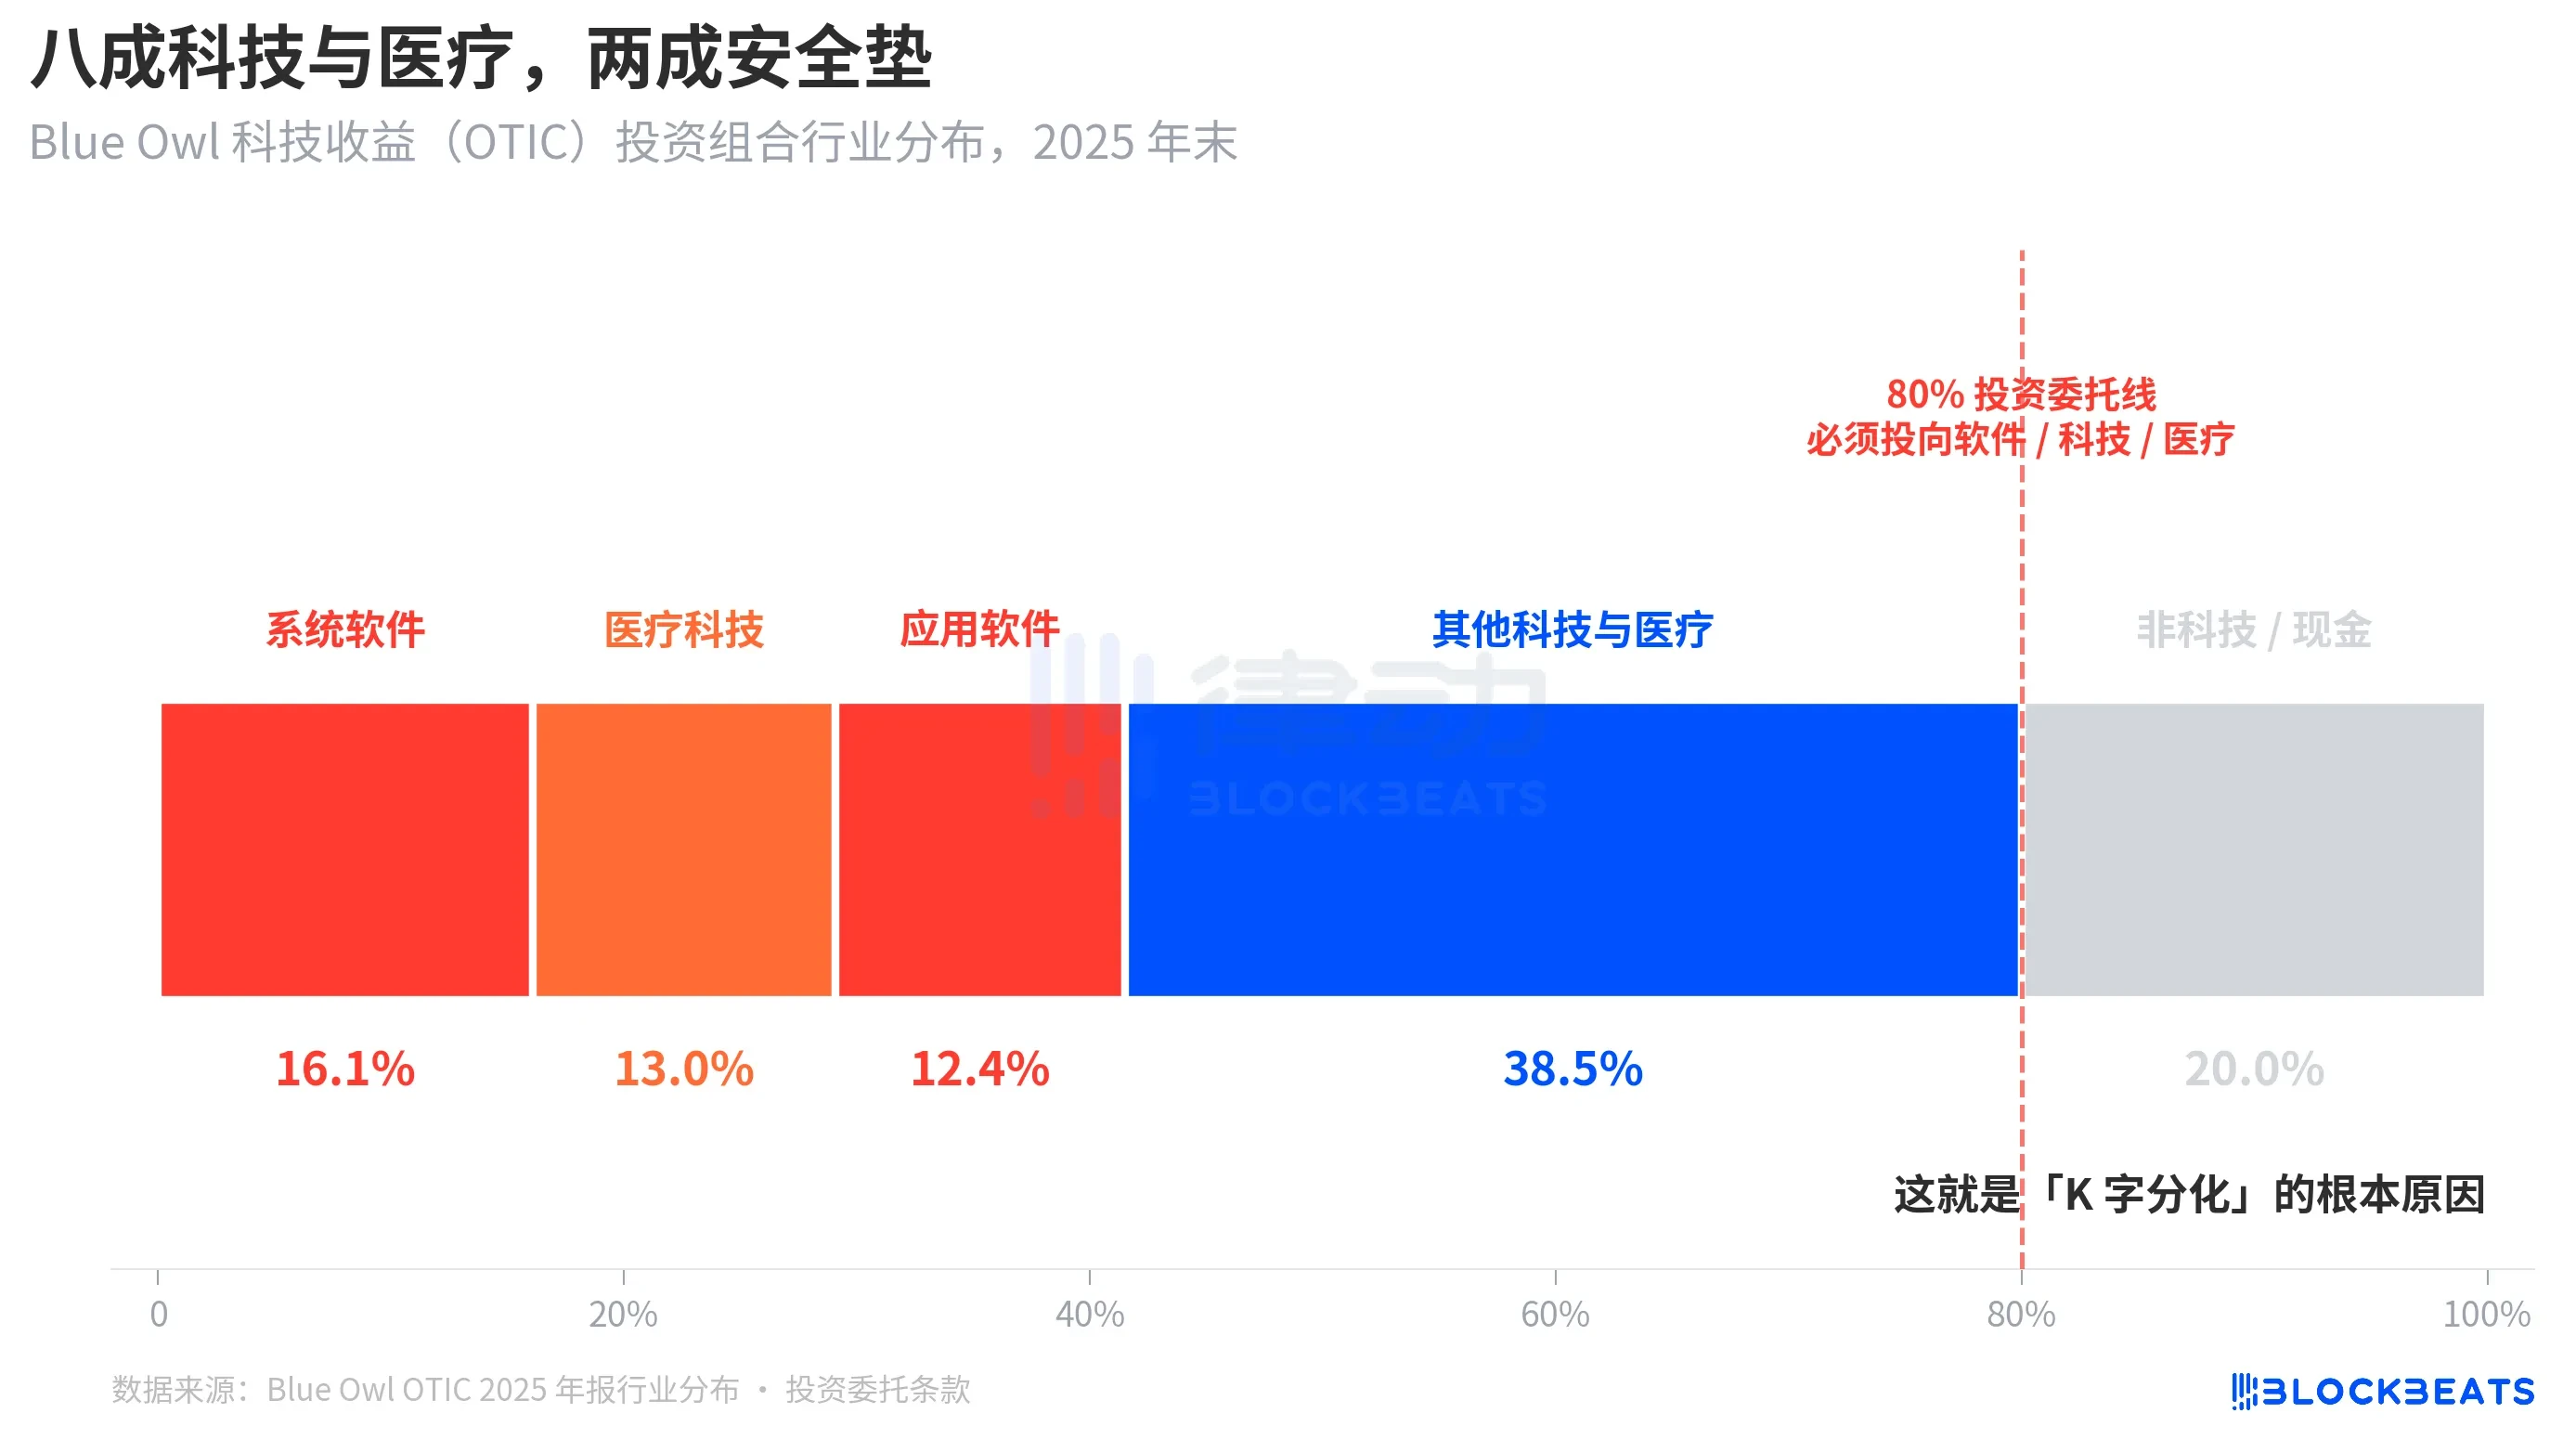
The key point is that this is not a temporary sector preference by the manager but a hard rule written into OTIC’s investment charter: at least 80% of total assets must be invested in “software and technology-related” companies. Blue Owl describes OTIC in its public materials as “primarily investing in large, market-leading software enterprises providing mission-critical, recurring revenue solutions.” From its inception, OTIC was designed as a SaaS technology credit fund.
In the market narrative of the past six months, SaaS has been one of the asset classes most severely repriced by AI. When investors began worrying about “AI disrupting the long-term subscription revenue of software companies,” a private credit fund with 80% exposure to software and technology was the first to bear the brunt. According to reports from Bloomberg and Reuters, Blue Owl’s management acknowledged in communications with investors that part of the Q1 redemption pressure stemmed from “concerns about AI disruption of software companies.”
In contrast, Goldman Sachs Private Credit Corp’s investment portfolio ($15.7 billion AUM) was described by Bloomberg as “significantly more diversified than its peers,” with no single industry reaching the level of OTIC’s tech exposure. With the same private credit, the same semi-liquid structure, and the same 5% gate, the underlying assets’ exposure to the current market theme was 80% for one and less than 15% for the other. The result: one had a 40.7% redemption rate, the other 4.999%.
This is the fundamental reason for the “K-shaped divergence.” It is not that private credit as an asset class is collapsing. Rather, funds heavily concentrated on a single market theme are experiencing concentrated problems, while diversified funds are almost unaffected. The divergence occurs at the risk exposure layer, not the structural layer.
結論
JPMorgan Chase CEO Jamie Dimon’s 2026 shareholder letter, released on April 6, coincidentally landed on the same day Blue Owl hit its new low. He wrote in the letter: “Private credit, in general, lacks transparency and rigorous loan mark-to-market valuations, which makes people more likely to sell if they think the environment will worsen, even if the actual losses have hardly changed.”
Dimon’s statement points to a structural issue. Private credit is difficult to mark to market, making holders’ perception of risk more sensitive than the actual losses. Reading this on April 7, 2026, carries two implications. First, Goldman’s 0.001-point gap is more a result of its diversified structure than luck. Second, the entire $1.8 trillion private credit market has yet to resolve the underlying contradiction between “liquidity and opaque portfolios.”
A 5% gate did not separate Blue Owl and Goldman into “good funds” and “bad funds.” It merely settled, on the same price chart, two different investment decisions: “concentrated bets on current themes” versus “diversification.”
この記事はインターネットから得たものです。 Illustrating the Private Credit Crisis: Blue Owl Plummets 66%, How Did Goldman Sachs “Escape Death”?
Related: Three Weeks into the U.S.-Iran War: Who’s Profiting and Who’s Paying?
This figure exceeds the combined losses of the 1973 oil embargo and the 1979 Iranian Revolution crises. Energy infrastructure at over 40 sites across 9 Middle Eastern countries suffered varying degrees of damage. Concurrent IEA data shows that global natural gas supply losses reached 140 billion cubic meters, nearly double the European gas losses (75 billion cubic meters) during the Russia-Ukraine conflict. In three weeks, the quantitative impact of this conflict on the energy market has surpassed the entirety of the 1970s. But supply loss is only half the story. The other half is that this crisis has clear beneficiaries. Putin’s Windfall Before the Iran war began, Urals crude traded at less than $60 per barrel. This price had been locked in for nearly three years, a direct result of…


良い