








Approaching Historical Warning Lines: Soaring Long-End Financing Costs in U.S. Debt, 30-Year Auction Yield Hits Highest Since 2001
Original Source: Wall Street CN
The U.S. government’s long-term borrowing costs are approaching historic warning levels. Results from two consecutive long-term Treasury auctions this week show that the compensation investors demand for holding long-dated U.S. debt has risen to heights rarely seen in decades, putting tangible pressure on the Treasury Department and the Trump administration.
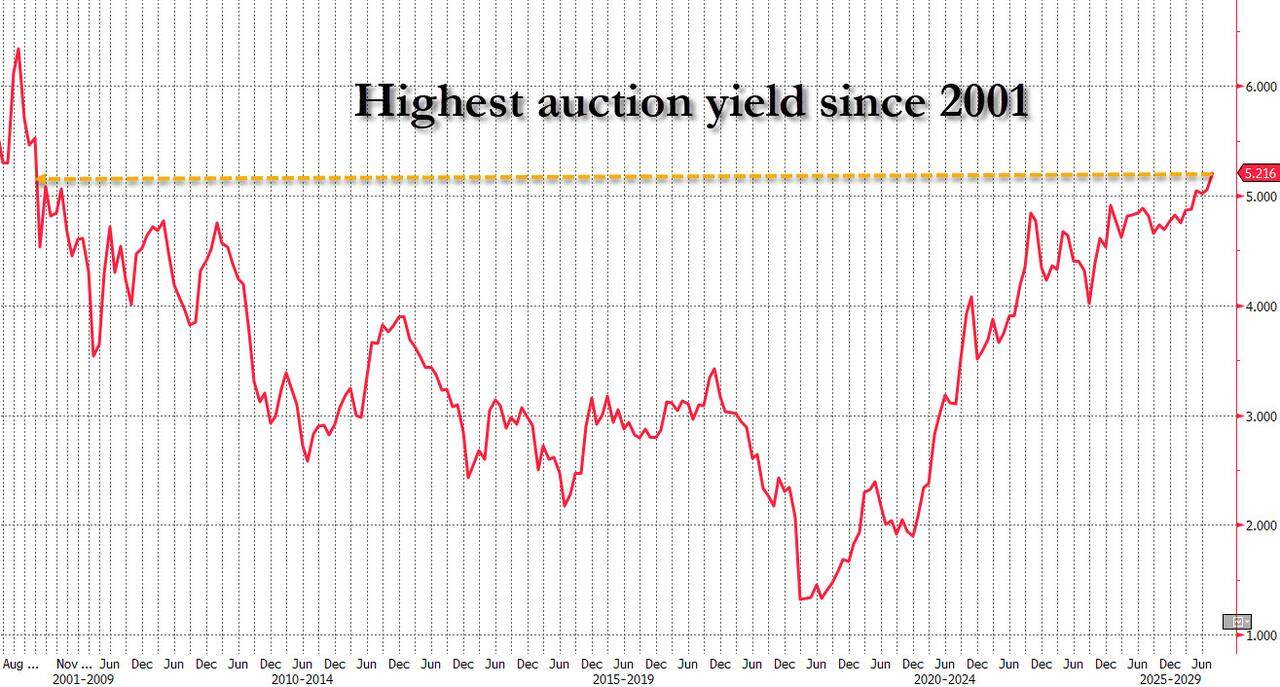
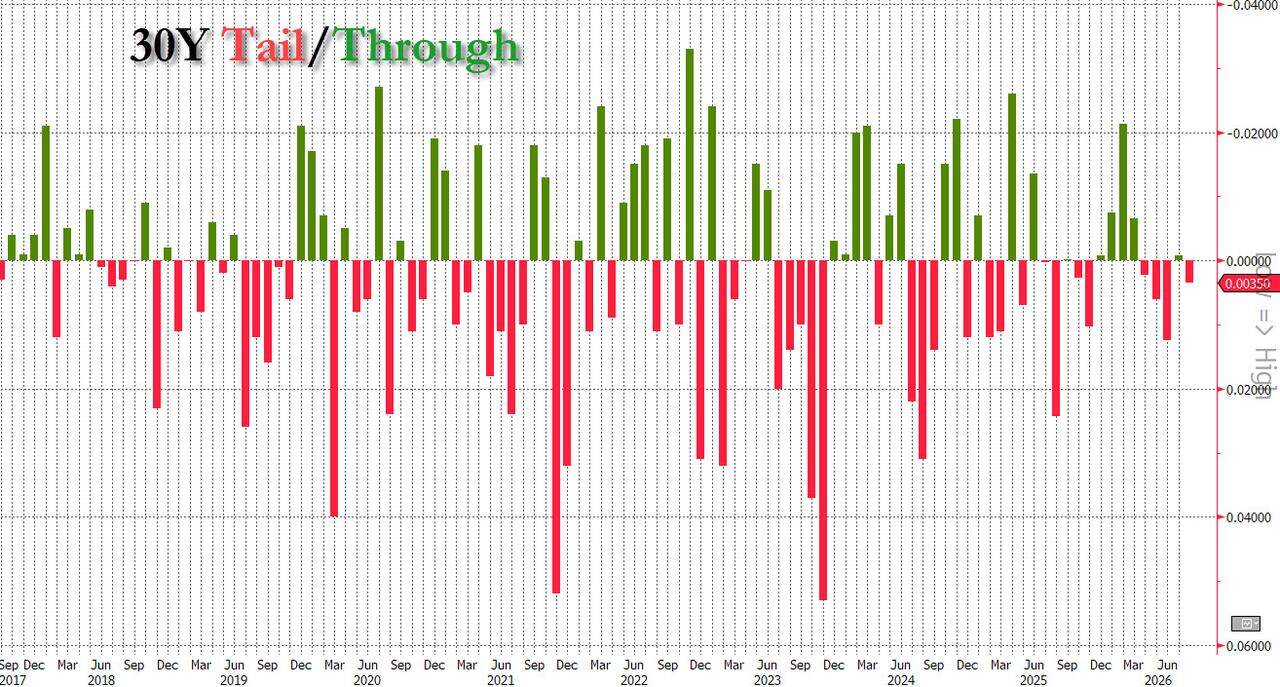
On Thursday, the U.S. Treasury completed a $25 billion auction of 30-year Treasury bonds, with the high yield hitting 5.216%, the highest level since 2001. The auction saw a slight “tail”—the high yield came in about 0.4 basis points above the when-issued yield, meaning investors required a higher yield than the intraday market pricing to take down the paper. The day before, a $42 billion auction of 10-year Treasury notes saw the high yield reach 4.683%, the highest since the 2007 global financial crisis.
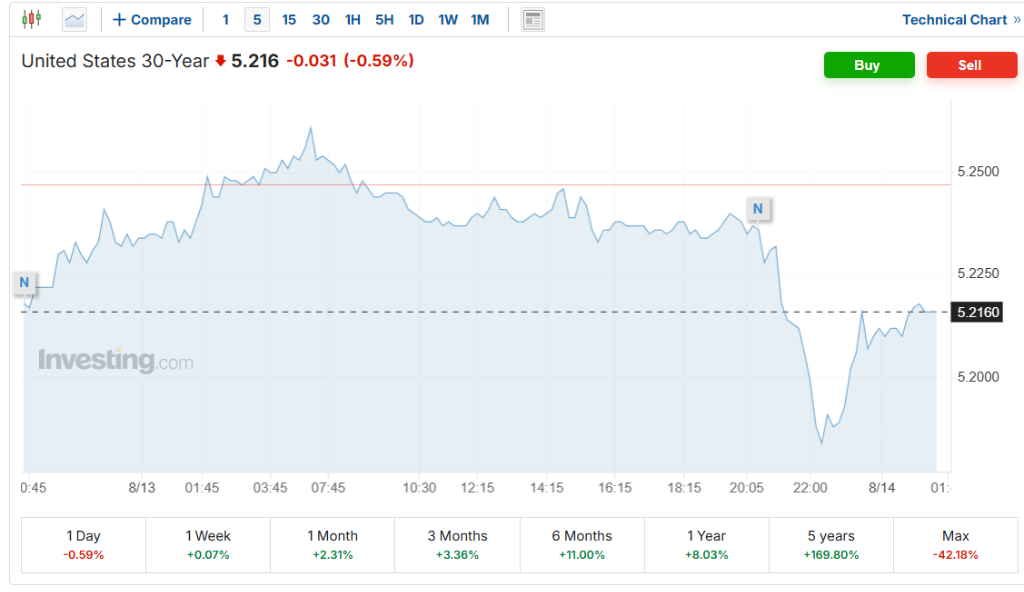
The two auctions consecutively set multi-year records, and their market impact has extended beyond the auctions themselves: The 30-year Treasury yield closed about 4 basis points lower on the day, but the spread between 5-year and 30-year Treasury yields widened further to its widest level since May, with the yield curve continuing to steepen. This suggests that pressure on the long end has not dissipated due to a single day’s fluctuation.
Michal Stanczyk, portfolio manager on Allspring Global Investments’ global fixed income team, stated, “If investors continue to demand higher compensation for inflation and fiscal risk premiums, long-end yields could push even higher, breaking through the 5% threshold.”
Demand Isn’t Collapsing, But the Structure Is Diverging
The headline numbers from Thursday’s 30-year auction weren’t terrible. The bid-to-cover ratio was 2.39 times, higher than the 2.36 times average of the previous six comparable auctions. Absolute demand hasn’t visibly shrunk.
However, the change in buyer composition is noteworthy. Indirect bidders, which reflect demand from overseas institutions like foreign central banks, saw their allocation drop to 66.8%, down from July’s near-record 77.7% and below the 67.0% average of the previous six auctions. Primary dealer allocations rose to 11.5%, up 150 basis points from July and higher than the recent average of 10.6%. Since primary dealers typically serve as buyers of last resort, their increased share coupled with the decline in indirect bidder participation suggests that some of the gap in demand from end investors was absorbed by dealers.
Wednesday’s 10-year auction painted a slightly different picture. The 0.1 basis point tail was more limited, and primary dealer allocations declined, indicating that end investors still retained some capacity to absorb supply. However, the 4.683% high yield itself was the highest in nearly two decades. Gennadiy Goldberg, head of U.S. rates strategy at TD Securities, said, “The strong absorption of supply suggests demand is indeed there—it just has its price.”
Fiscal Supply and Term Premiums Are Dominating the Long End
The persistently high long-end yields can no longer be explained solely by expectations of Federal Reserve policy.
Following the July CPI report, market expectations for a September Fed rate hike have cooled somewhat. Traders now price in roughly a 35% probability of a September hike, down from around 50% earlier this week. Yet 10-year and 30-year Treasury yields have not followed the cooling of monetary policy expectations lower. Instead, they continue to hover at multi-year highs, and the yield curve has actually steepened further.
市场 analysts point out that widening fiscal 定义cits, increased Treasury supply, and rising term premiums are becoming independent variables driving long-end yields. A Barclays team led by Demi Hu wrote in a research note, “As the market relies more heavily on price-sensitive investors, the same amount of Treasury supply may require larger yield concessions to complete issuance.”
The current U.S. debt load stands at roughly $31 trillion, double its 2018 level. Fitch Ratings on Thursday affirmed the U.S. sovereign rating at “AA+” with a stable outlook, but warned that the 2026 fiscal deficit relative to the size of the economy would widen further due to tax cuts and tariff rebate measures. As of this fiscal year, U.S. interest expenses have accumulated to $1.17 trillion, a year-over-year increase of 15%.
Debate Over Issuance Strategy: Can the Shift Toward Shorter Durations Be Sustained?
Facing pressure on the long end, the Treasury Department quietly adjusted the language in its quarterly refunding statement last week, changing “expects to keep coupon and floating rate note auction sizes unchanged” to “expects to consider adjustments over the next few quarters,” a shift the market interprets as authorities reserving room for potentially cutting long-dated debt issuance.
Market expectations are widespread that if the Treasury increases fixed-income security issuance, the focus will be on medium- to short-dated tenors spanning 2 to 7 years. This would be an extension of the existing strategy to shorten duration—authorities have already tilted issuance toward short-term bills of one year or less to avoid high long-end yields, though this simultaneously raises refinancing risk.
John Fath, managing partner at BTG Pactual Asset Management US LLC, questioned the sustainability of this strategy: “I think the only clear solution is for the U.S. government to tighten its budget. Concentrating issuance at the short end can only go so far; beyond that, it becomes what I would call irresponsible.”
From Treasuries to Mortgages, Cost Pressures Transmit to the Real Economy
The impact of rising long-term Treasury yields has extended into the broader economy. As the pricing benchmark for U.S. financial markets, Treasury yield movements directly affect borrowing costs across corporate bonds, residential mortgages, and other financing avenues. Last week, the average 30-year fixed-rate mortgage in the U.S. rose to 6.69%, the highest level since July 2025.
Matt Wrzesniewsky, head of fixed income client portfolio management at Vanguard, believes the current elevated yield levels offer investors “another entry opportunity.” Vanguard expects 10-year Treasury yields to remain within the 4.25% to 4.75% range and prefers adding rate exposure through intermediate tenors rather than 30-year long bonds.
In the near term, the completion of these two auctions demonstrates that market absorption capacity still exists. But the very fact that 30-year Treasuries were issued at a yield of 5.216% sends a clear signal: Against the backdrop of widening deficits, increased supply, and inflation uncertainty, the U.S. government’s long-term borrowing costs are at heights rarely seen this century. The demand performance in upcoming rounds of medium- and long-dated auctions will serve as a key observation window for judging whether this trend evolves further.
Related: After three consecutive years of reducing stock positions, Buffett finally made his move
Author: Azuma (@azuma_eth) After the U.S. stock market closed on August 9 (Beijing time), Berkshire Hathaway released its Q2 2026 earnings report. The report showed that Berkshire’s total Q2 2026 revenue reached $101.808 billion, up approximately 10% year-over-year, with net income attributable to shareholders at $25.667 billion, more than doubling from the same period last year (up approximately 107%). Both operating profit and net income significantly exceeded market expectations. But the more signal-worthy point in the report is that Berkshire Hathaway finally ended its stock-selling streak that had lasted over three years (14 consecutive quarters), shifting back to net buying. Holding $400 Billion in Cash, Berkshire Finally Makes Its Move According to the earnings report, Berkshire Hathaway purchased approximately $23.47 billion in stocks in Q2, while selling only $3.69 billion,…
























 简体中文
简体中文  English
  繁體中文
繁體中文