Original Link: https://x.com/gemchange_ltd/status/2028904166895112617
Compilation, Annotation, and Rewriting: Mr.RC, Founder of insiders.bot (@insidersdotbot), Former President of @0xUClub
Quantitative Trading is a Foundational Skill for Every Trader in 2026
Last week, I was invited by the Hong Kong University Artificial Intelligence and Management Association (@camo_hku) to share insights on money-making methods in the Agent era. The biggest takeaway from the entire event was one thing:
The AI Era = The Era of Technological Democratization
In the past, quantitative trading was the exclusive domain of a few institutions. Now, countless studios and even individuals are participating in creating quantitative strategies and achieving sustained profits. In other words, if you still don’t understand the essence of quantitative trading, you will face a significant disadvantage in the market.
In today’s world where OpenClaw is prevalent, anyone can make money through quantitative trading. But this requires two prerequisites.
- First, infrastructure. This is precisely what we are trying to achieve at @insidersdotbot by building Agent and algorithm-native trading platforms, databases, and Skills. The official version of Agent-based backtesting functionality will also be part of this ecosystem.
- 第二, and most important for individuals, is architectural capability and strategy design ability. A strategy doesn’t need to be 100% accurate, but it must be unique, sophisticated, and capable of capturing significant opportunities that others are unaware of.
As long as you have your own unique strategy + powerful underlying infrastructure, then, empowered by Vibe Coding, you are not far from financial freedom.
When it comes to learning strategy and architecture, this original article by @gemchange_ltd is the most complete “Quantitative Trading Knowledge Map” I have seen so far. Using prediction markets as a starting point, it clearly explains every piece of the puzzle needed to become a top Quant (Quantitative Trader) in the correct learning sequence.
I believe that after reading it, even a beginner can understand how to start quantitative trading and how to design your own strategy.
If you are a prediction market trader, this is a must-read article.
If you are a trader of other assets, many of the ideas in this article are universal, and I believe you will find it immensely useful.
The original article is very hardcore and academic. To make it understandable for any user new to Polymarket, or even those without any mathematical background, I have done extensive rewriting and supplementation. I assume you know nothing about complex mathematics, added 20 fully Chinese diagrams, and used the most down-to-earth language, relatable analogies, and practical examples to break down every concept for you.
If you want to make money consistently in prediction markets instead of being a gambler, this article is your starting point.
By the way, this article is structurally optimized for Agents. Just like the insiders.bot platform is optimized for both human and AI traders. So, feel free to feed this article to your OpenClaw, Manus, Claude, or any other AI, and start building your quantitative model immediately.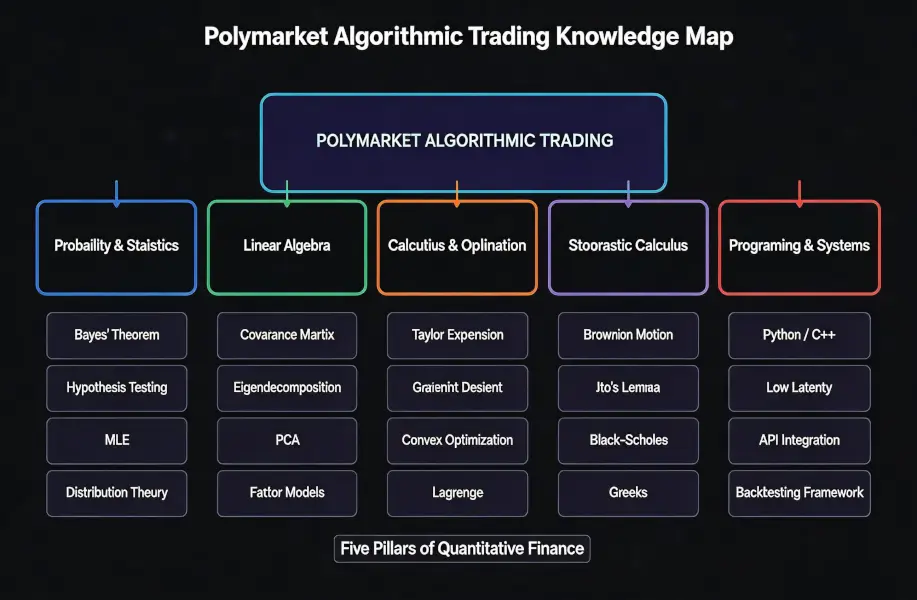
Prologue: Are You Trading or Gambling?
Let me ask you a question first.
You see a contract on Polymarket where the YES price for “Trump wins the election” is $0.52. You think his probability of winning is higher, so you spend $520 to buy 1000 YES shares.
You think you are trading. But in reality, you are just gambling. Because you haven’t answered these questions:
- How did you calculate your 52%?
- Is your source of information better than other participants in the market?
- If a piece of news comes out tomorrow, how should your probability estimate be updated?
- What position size should you buy so you don’t get liquidated “in case you’re wrong”?
These questions cannot be answered by “feeling.” They require mathematics.
In 2025, the entry-level Quant salary at top quantitative firms (Jane Street, Citadel, HRT) ranged from $300K to $500K. Financial hiring in AI and machine learning grew 88% year-over-year. This isn’t because these companies love mathematicians. It’s because mathematics can genuinely make money through more accurate valuation models.
And Polymarket happens to be a trading market that perfectly integrates all the core concepts of quantitative finance: Probability Theory, Information Theory, Convex Optimization, Integer Programming—all are applicable.
Chapter 1: Probability, the Sole Language of an Uncertain World
Most people have a huge misconception about quantitative trading. They think quantitative trading is “stock picking,” having unique insights about a particular event.
That’s not it at all.
The essence of quantitative trading = Pure mathematics.
More specifically, what you are looking for is:
- Statistical correlations
- Pricing inefficiencies
- Structural advantages.
These advantages exist because the market is a complex system composed of humans, and humans always make systematic errors.
In the world of quantitative finance, all problems can ultimately be reduced to one question: What are the odds, and how much of an edge do I have with these odds?
So first, you need to deeply understand the nature of “probability.”
Conditional Thinking: Farewell to Absolute Right and Wrong
Ordinary people like to think in terms of absolute right and wrong. An event either happens or it doesn’t.
But a Quant’s way of thinking is conditional.
They ask: Given certain known information, what is the likelihood of this event happening?
“Probability given certain known information” is conditional probability.
In plain terms: When you get a new clue, how does the original probability change?
Sounds a bit convoluted? Let’s look at a practical example on Polymarket.
Suppose you are trading a contract on “whether a certain token will rise today.” Historical data shows that the probability of this token rising daily is 60%. This is the base rate. However, if today the token’s trading volume exceeds its historical average, its probability of rising becomes 75%.
That 75% conditional probability is the real “signal.” The isolated 60% is just noisy background data.
Let’s take a more intuitive example. The probability of rain is 30%. But what if the sky is already covered with dark clouds? The probability of rain might become 85%. “Dark clouds covering the sky” is your conditional information, updating your probability estimate from 30% to 85%. This is the essence of conditional probability.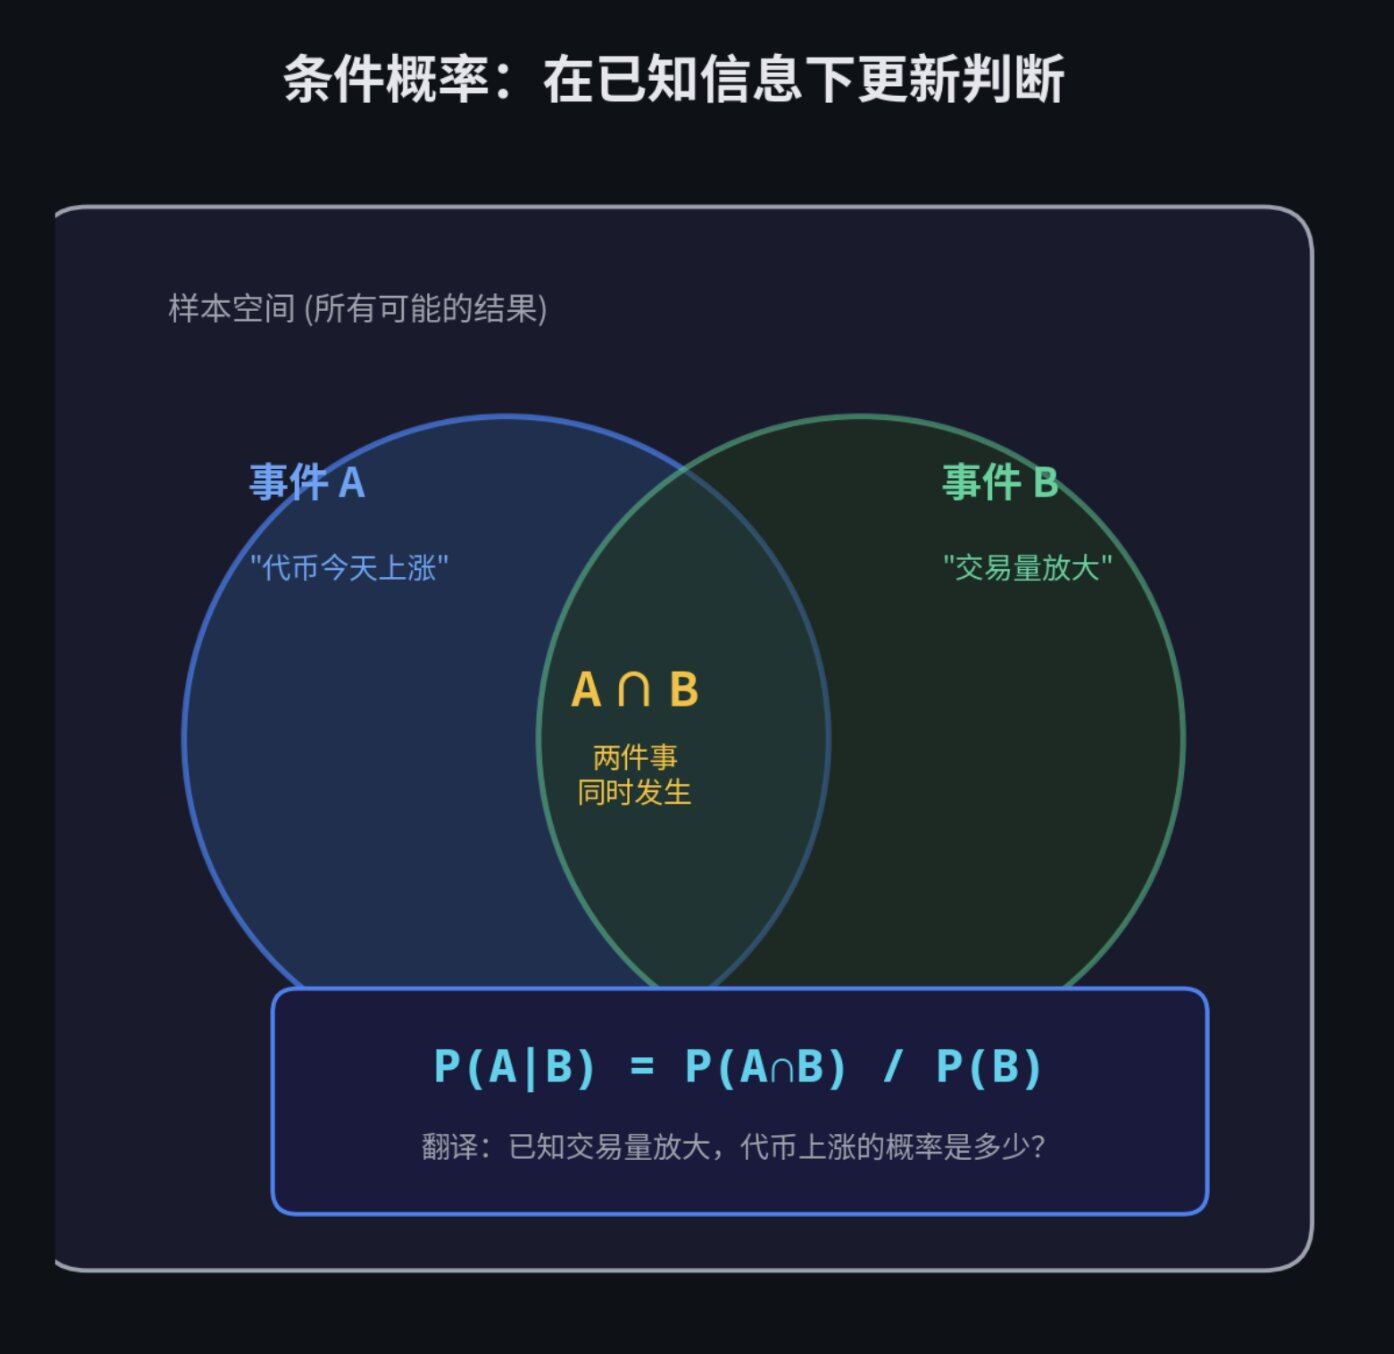
Bayes’ Theorem: How to Update Your Beliefs in Real-Time
Bayes’ Theorem is the soul of quantitative trading. It answers the question: When you obtain new data, how should you update your prior belief?
Its formula is:
P(A|B) = P(A∩B) / P(B)
- P(A|B): Probability of A happening given that B has occurred
- P(A∩B): Probability of both A and B happening
- P(B): Probability of B happening
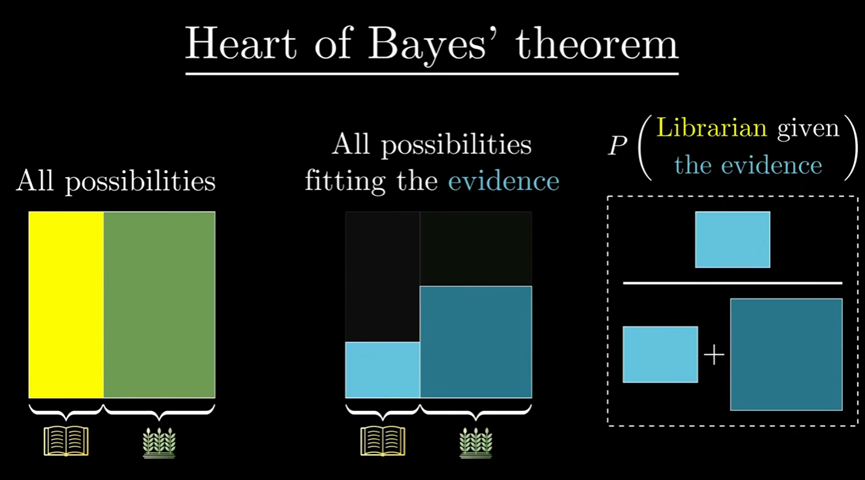
The logical essence of Bayes’ Theorem is this:
- You start with a prior estimate (e.g., I think there’s a 50% chance this event happens).
- Suddenly, you see a new piece of evidence (e.g., a piece of positive news comes out).
- You ask yourself two questions: If this event were truly going to happen, how likely is it that this news would appear? If this event were not going to happen at all, how likely is it that this news would appear?
- Based on the answers to these two questions, you adjust your prior estimate (e.g., from 50% to 58%).
Let’s understand this with a Polymarket scenario.
Your model calculates that the fair price for a certain market should be $0.50 (meaning you think the probability of the event is 50%). This is your prior belief.
Suddenly, breaking news comes out. Economic data is 3% better than expected.
Using Bayes’ formula, you can precisely calculate your new belief. Suppose it calculates to 58%. Then your new fair price is $0.58.
In the market, whoever can complete this probability update the fastest and most accurately will make most of the money. This is why quantitative teams spend millions of dollars building low-latency systems. Not because they like speed, but because being 0.1 seconds faster can mean tens of thousands of dollars more.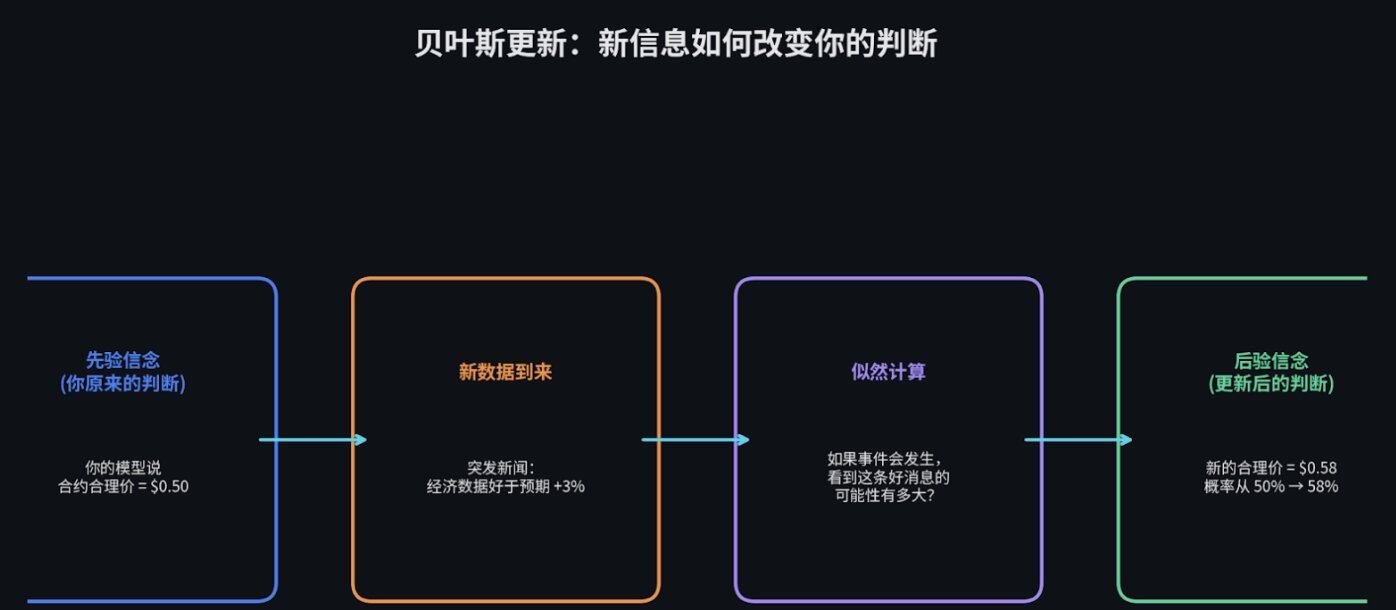
If you want to build a solid foundation, go read Harvard’s free “Introduction to Probability,” the first 6 chapters are enough. Then try writing a Python script to simulate flipping a coin 10,000 times, and see with your own eyes how the Law of Large Numbers works.
Expected Value and Variance: Your Two Best Friends
In trading, two numbers are more important than anything else.
Expected Value (EV), your degree of conviction.
If a trade has a positive expected value, it means that as long as you repeat it enough times, you will make money in the long run.
Variance, your risk.
It tells you how much volatility you will experience before reaching that profitable “long run.”
For example. Suppose you have a strategy with an expected profit per trade of $2, but a standard deviation of $50. This means that although you “on average” make $2 per trade, the outcome of a single trade can fluctuate wildly between losing $100 and making $100. If your capital is only $200, you might get liquidated after three consecutive losses before the “long run” ever arrives.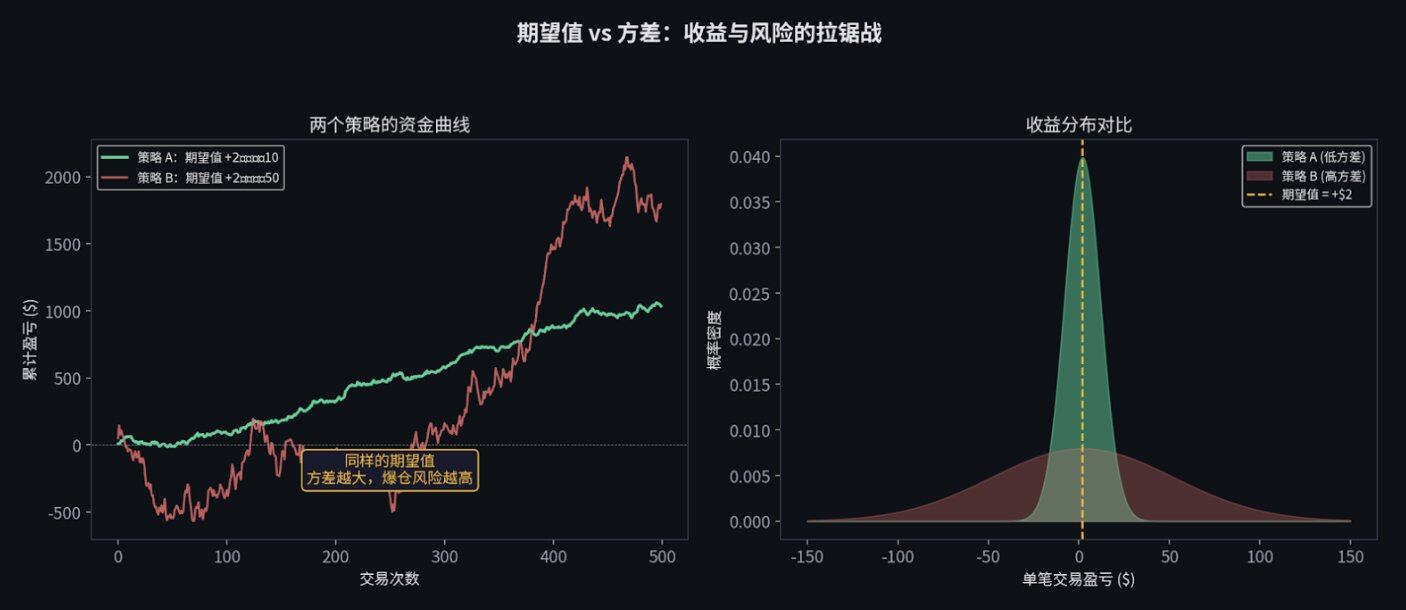
Kelly Criterion: Scientifically Determining Bet Size
Now that we know expected value and variance, when faced with a good opportunity, how much should I actually buy? Go all-in?
Absolutely not. Here we need to introduce the Kelly Criterion.
The Kelly Criterion is specifically designed to tell you: Given a certain win rate and odds, what percentage of your total capital you should bet to make your money grow the fastest, while also avoiding ruin.
If it calculates to 20%, it means you should bet at most 20% of your total capital.
In practice, because our estimates of win rates often have errors (you think you have a 60% win rate, but it might actually be 55%), top Quants typically use “Half Kelly,” which is betting only half of the amount calculated by the Kelly formula. This significantly reduces capital volatility while preserving most of the growth speed.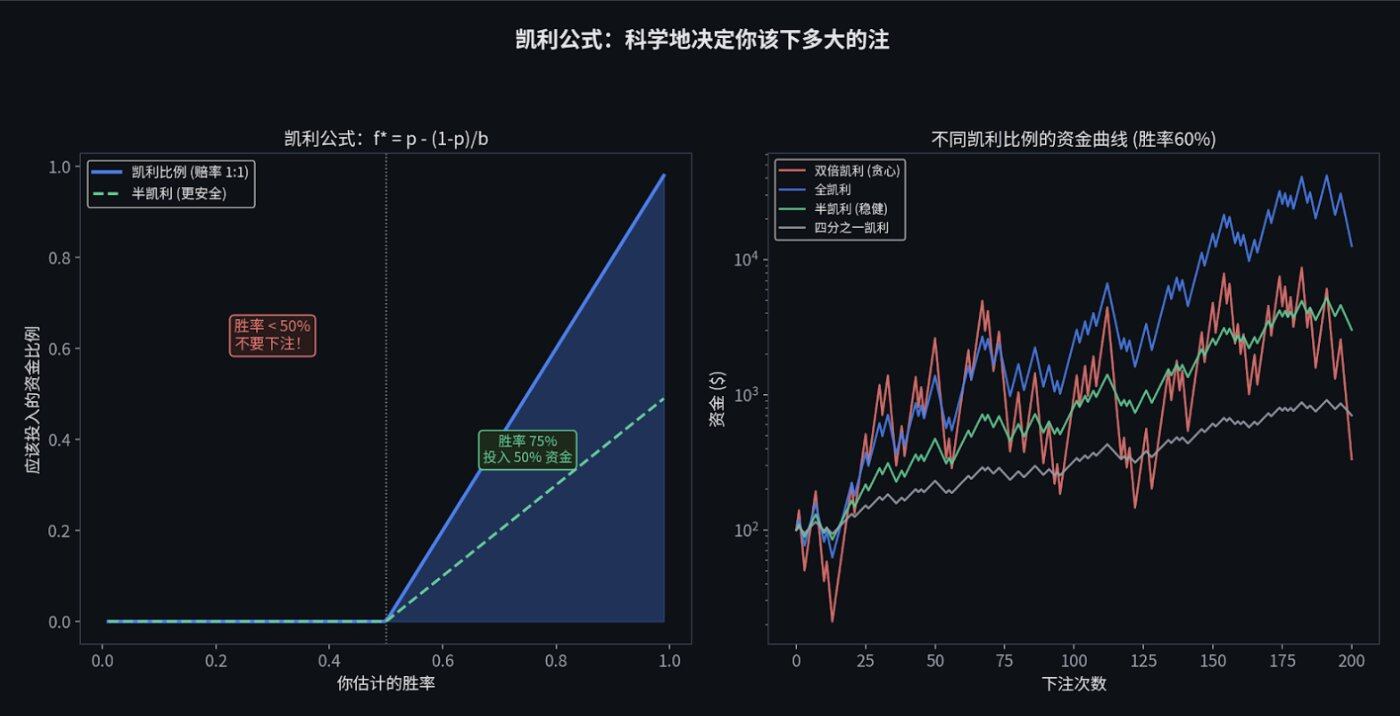
Chapter 1 Homework (Approx. 2 hours/day, 3-4 weeks to complete):
1. Reading: Read “Introduction to Probability” by Blitzstein & Hwang (Harvard provides a free PDF version, link: http://probabilitybook.net[[1]](https://stat110.hsites.harvard.edu/)).
2. Programming Exercise 1: Simulate 10,000 coin flips and use charts to visually verify the “Law of Large Numbers.”
3. Programming Exercise 2: Implement a Bayesian updater: Input prior probability and likelihood function, output posterior probability.
python
import numpy as np
import matplotlib.pyplot as plt
# Law of Large Numbers: As the number of experiments increases, the running mean converges to the true probability
np.random.seed(42)
flips = np.random.choice([0, 1], size=10000, p=[0.5, 0.5])
running_avg = np.cumsum(flips) / np.arange(1, 10001)
plt.figure(figsize=(10, 4))
plt.plot(running_avg, linewidth=0.7)
plt.axhline(y=0.5, color='r', linestyle='--', label='True Probability')
plt.xlabel('Number of Coin Flips')
plt.ylabel('Running Mean')
plt.title('Visual Demonstration of the Law of Large Numbers')
plt.legend()
plt.savefig('lln.png', dpi=150)
print(f"Mean after 10,000 flips: {running_avg[-1]:.4f} (True value: 0.5000)")
Chapter 2: Statistics = Your Noise Detector
Once you’ve learned the language of probability, the next step is to learn to “listen to the data.”
This is statistics.
The first lesson statistics teaches us is: The vast majority of things that look like “signals” are actually noise.
Hypothesis Testing and the Multiple Comparisons Trap
Suppose you write a trading bot, and backtest data shows it can make 15% per year. Is this real, or just luck?
At this point, you need to calculate a p-value: If this strategy is actually garbage (pure guessing), what is the probability that it could coincidentally achieve a 15% return? Statistics can tell you how small this probability is (e.g., less than 5%).
However, there is a huge trap here called the Multiple Comparisons Problem.
Imagine you have 1,000 monkeys each throw 100 darts. Purely by chance, there will always be a few monkeys that hit the bullseye consecutively, looking like “dart masters.” But you wouldn’t hire them as investment managers, right?
Writing trading strategies is the same. If you use a computer to automatically generate 1,000 random strategies and run them on historical data, purely by chance, about 50 strategies will appear to make a lot of money.
Every newbie entering the field severely overestimates the “effective strategies” they discover. I can responsibly tell you, the first 10 strategies you write are 德菲nitely those lucky monkeys.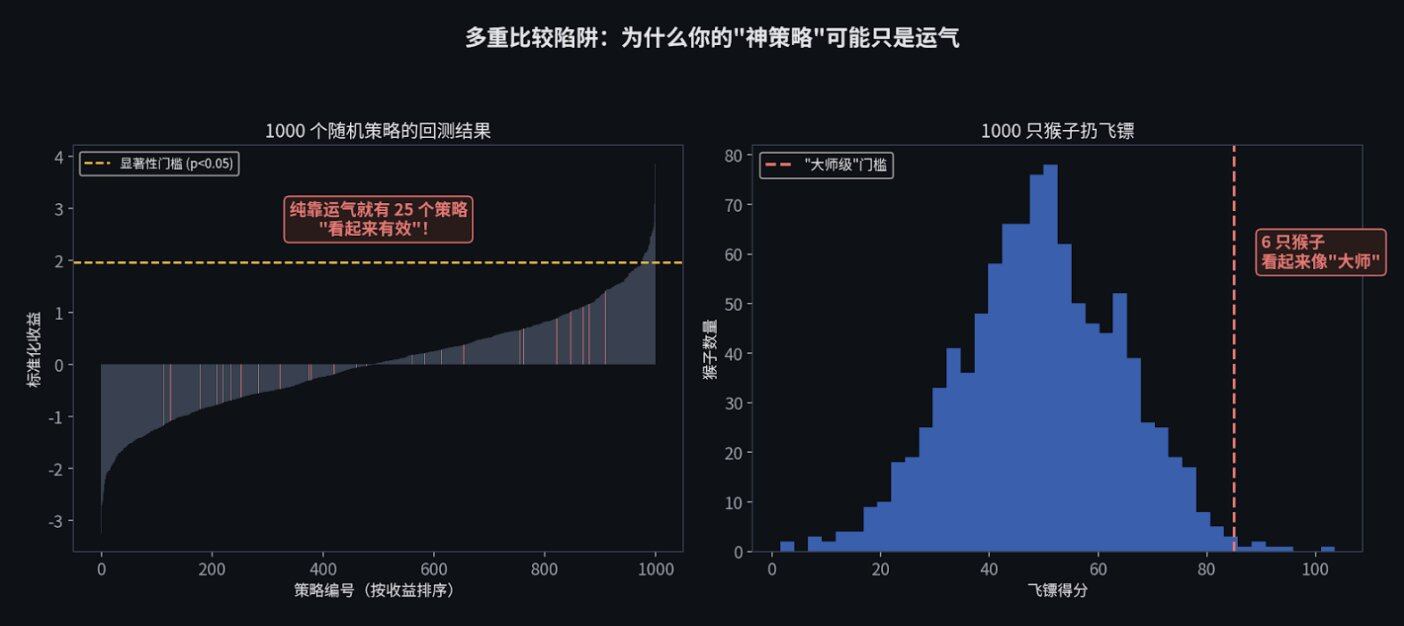
What’s the solution? You need to use Bonferroni correction to raise your significance threshold, or


本文源自網路: In 2026, How Can Ordinary People Engage in Quantitative Trading