Bitcoin Bears Tighten Their Grip, Can the $60,000 Defense Line Hold? | Guest Analysis
Building on this, this week’s report will further deconstruct the current price structure, update market forecasts and operational plans, and provide a complete review of last week’s trade execution.
Summary of This Week’s Core Trading Views:
• HYPE’s market forecast and short-term trading strategy for this week. (Detailed in Part 1)
• In-depth deconstruction of HYPE’s current price structure (hourly timeframe). (Detailed in Part 2)
• BTC’s market forecast and medium/short-term trading strategy for this week. (Detailed in Part 3)
• BTC trade review. (Detailed in Part 4)
市場 Validation of Last Week’s Core Views:
• HYPE Short-term Trade Performance: Executed one short-term long trade (1x leverage) on HYPE last week, achieving a return of approximately 5.25%. (Detailed in Table 1)
• BTC Short-term Trade Performance: Executed one short-term short trade (1x leverage) on Bitcoin last week, achieving a return of approximately 6.17%. (Detailed in Table 2)
• BTC Medium-term Trade Performance Validation: Following the established medium-term strategy, continued holding the short position opened at $89,000 (1x leverage) last week. As of last week’s close (~$66,962), the profit is approximately 24.76%, with a maximum intra-period profit of about 32.58%.
• BTC 市場 Forecast Validation: In last week’s article, we clearly stated that the market would maintain a consolidation and adjustment pattern, observing the battle between bulls and bears near the channel’s lower boundary (formed from the February 6th low). The current market movement validates our previous forecast.

I. HYPE: Market Forecast and Short-term Trading Strategy
1. HYPE Market Forecast for This Week: We believe the current market structure still maintains a daily timeframe uptrend. The price is currently in a pullback confirmation phase following the breakout of Wave I’s peak (the February 3rd high of $38.41). This week, focus on the effectiveness of the $36–$38 support zone. If the pullback confirmation is successful, the market will continue its upward trend.
2. HYPE Short-term Trading Strategy for This Week:
• Based on the forecast of an upward structure, adhere to the principle of “follow the trend, buy on dips”.
• Use the 30-minute/60-minute timeframe as the operational cycle, strictly adhere to stop-loss discipline; utilize 30% of the position to seek “spread” opportunities based on support and resistance levels.
3. HYPE Upside Risk Warning: Although HYPE’s movement shows independence, it cannot completely detach from Bitcoin’s broader environment. If Bitcoin shows significant subsequent adjustment, it may affect HYPE’s rebound momentum.
II. HYPE: Short-term Trade Review and Price Structure Deconstruction
1. HYPE Short-term Trade Review (1x Leverage): (03.23–03.29)
We strictly followed the plan and, combined with trading signals captured by our self-built Spread Trading Model 和 Momentum Quantification Model, executed a short-term (long) trade on HYPE last week, successfully profiting 5.25%.
• Summary of HYPE Short-term Trade Details: (Leverage*1x)
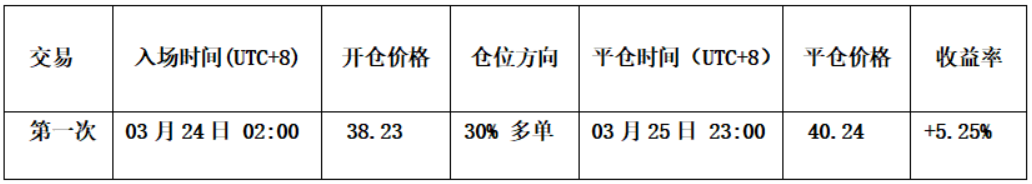
Table 1
• Entry Decision: This entry decision (see Figure 1) was based on meeting three bullish conditions. First, we judged at the time that the previous hourly adjustment was highly likely to end near endpoint 34. Second, the Spread Quantification Model triggered a strong bottom signal (red dot + white dot). Third, the Momentum Quantification Model issued a bottom divergence signal. Accordingly, we opened a 30% long position at $38.23.
• Exit Decision: Based on the Spread Quantification Model triggering a top bearish signal (white dot); the Momentum Model issuing a top divergence signal; and the candlestick pattern forming a “strong top reversal” signal. These three signals formed a technical confluence, so we executed a full exit near $40.24.
• Trade Summary: This operation successfully profited approximately 5.25%.
HYPE_60-minute Candlestick Chart (Momentum Quantification Model + Spread Trading Model):
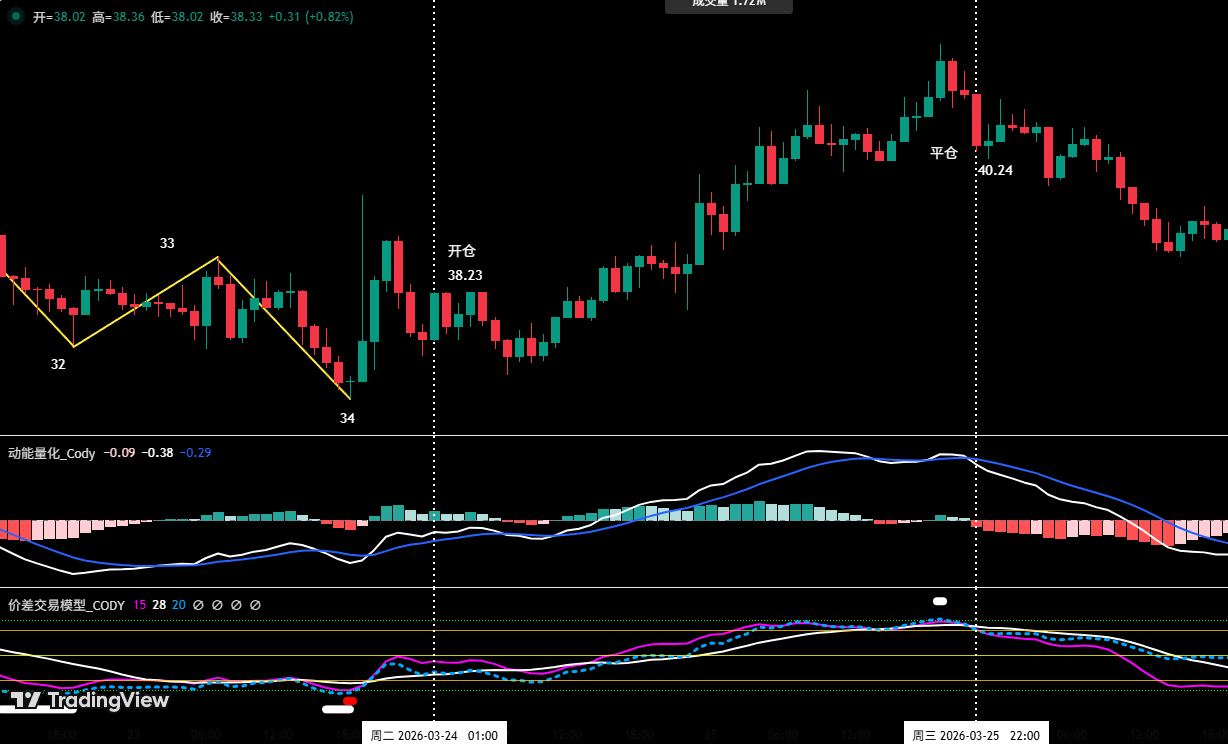
Figure 1 (Short-term Trade Illustration)
2. In-depth Analysis of HYPE’s Current Price Structure (Using 1-hour as Analysis Cycle)
• As shown in (Figure 2), reviewing HYPE’s hourly movement from the 16th to the 22nd, the price successfully formed a bearish pivot (Pivot C). We initially forecasted the low might form near endpoint 32 (around $37.52), but the actual movement showed the low appeared at the lower endpoint 34 (around $36.79), about $0.73 lower than forecasted.
• Breakdown of HYPE’s Internal Hourly Structure Last Week: (03.23–03.29)
a. As shown in (Figure 2), starting from endpoint 34, HYPE’s movement last week evolved into a complex consolidation structure consisting of 8 segments: 34-35, 35-36, 36-37, 37-38, 38-39, 39-40, 40-41, 41-42. As of analysis time, segment 41-42 is in progress.
b. Segment 34-35 constitutes the upward structure.
c. Segments 35-36, 36-37, 37-38, 38-39, 39-40, 40-41, 41-42 constitute the adjustment structure. Among them, the 5 segments 36-37, 37-38, 38-39, 39-40, 40-41 overlap with each other, jointly forming a bearish pivot (i.e., Pivot D).
d. The market is currently running the departure segment (41-42). As (Figure 2) shows, compared to the entry segment (35-36), the departure segment has formed a momentum divergence signal. If the divergence signal persists after the departure segment concludes, the probability of price moving upward is high.
HYPE_1-hour Candlestick Chart:
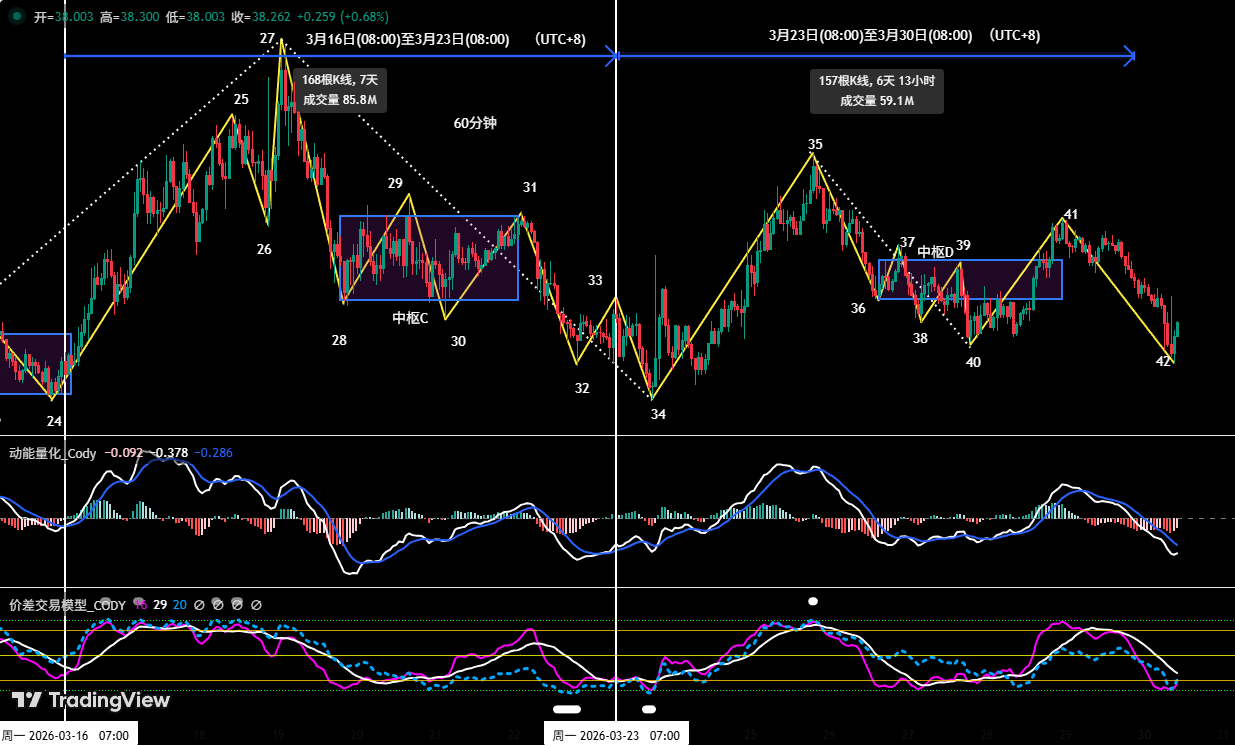
Figure 2
III. Bitcoin: This Week’s Market Forecast and Trading Strategy
1. In-depth Analysis of Bitcoin’s Current Price Structure (Using 4-hour as Analysis Cycle)
• Based on the movement after the February 6th low (~$60,000).
• Maintain the previous core analytical framework: In the February 16th Weekly Review, we explicitly stated that Bitcoin’s upward move starting from the February 6th low is in nature an oversold rebound within the larger-degree Wave C adjustment, specifically the C-2 wave, to be followed by a C-3 wave adjustment.
• Condition for C-3 Wave Formation: If Bitcoin price breaks below the February 6th low (~$60,000), the C-3 adjustment wave is confirmed.
• Current BTC Chart Interpretation: As shown in (Figure 3), on the 4-hour analysis cycle, Bitcoin effectively broke below the short-term ascending trendline formed from the February 24th low last week. It has fallen near the lower boundary of the ascending channel formed since the rebound from the February 6th low and is consolidating narrowly around this level. A breach of this level could lead to a retest of the $60,000 level.
• In-depth Analysis of BTC’s Hourly Price Structure: As shown in (Figure 3), on the 4-hour analysis cycle, Bitcoin’s correction from the March 17th high around $76,000 evolved into a 5-segment adjustment structure: 13-14, 14-15, 15-16, 16-17, 17-18. Among them, segments 14-15, 15-16, 16-17 form a bearish pivot (Pivot B). The subsequent departure segment (17-18) has fallen near the ascending channel’s lower boundary. Currently, only the Spread Trading Model has triggered a bottom warning signal (white dot) at this level. Therefore, the price shows weak consolidation here, repairing the oversold condition of 4-hour technical indicators.
Bitcoin _4-hour Candlestick Chart:
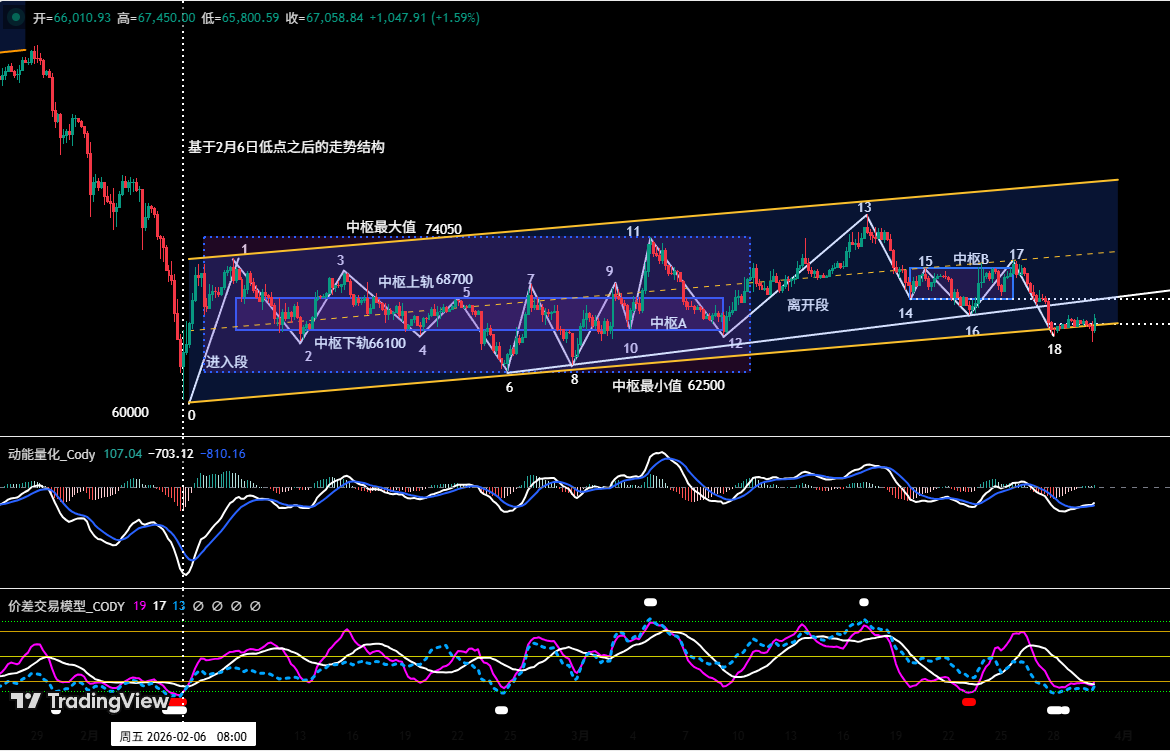
Figure 3
2. This Week’s Core View: Maintain consolidation and adjustment pattern, observe the battle between bulls and bears near the channel’s lower boundary (from the February 6th low).
3. Core Resistance Levels:
• First Resistance Zone: $69,500–$72,000 area (previous consolidation range)
• Second Resistance Zone: $74,500–$76,000 area (near the November 2025 low)
4. Core Support Levels:
• First Support: $65,000–$66,000 area (previous important support zone)
• Second Support: $60,000–$62,500 area (near the February 6th low)
• Third Support: Around $57,400
5. This Week’s Trading Strategy (Excluding Sudden News Impact): (03.30–04.05)
① Medium-term Strategy:
Bitcoin _ Daily Candlestick Chart: (Position Monitoring Model)
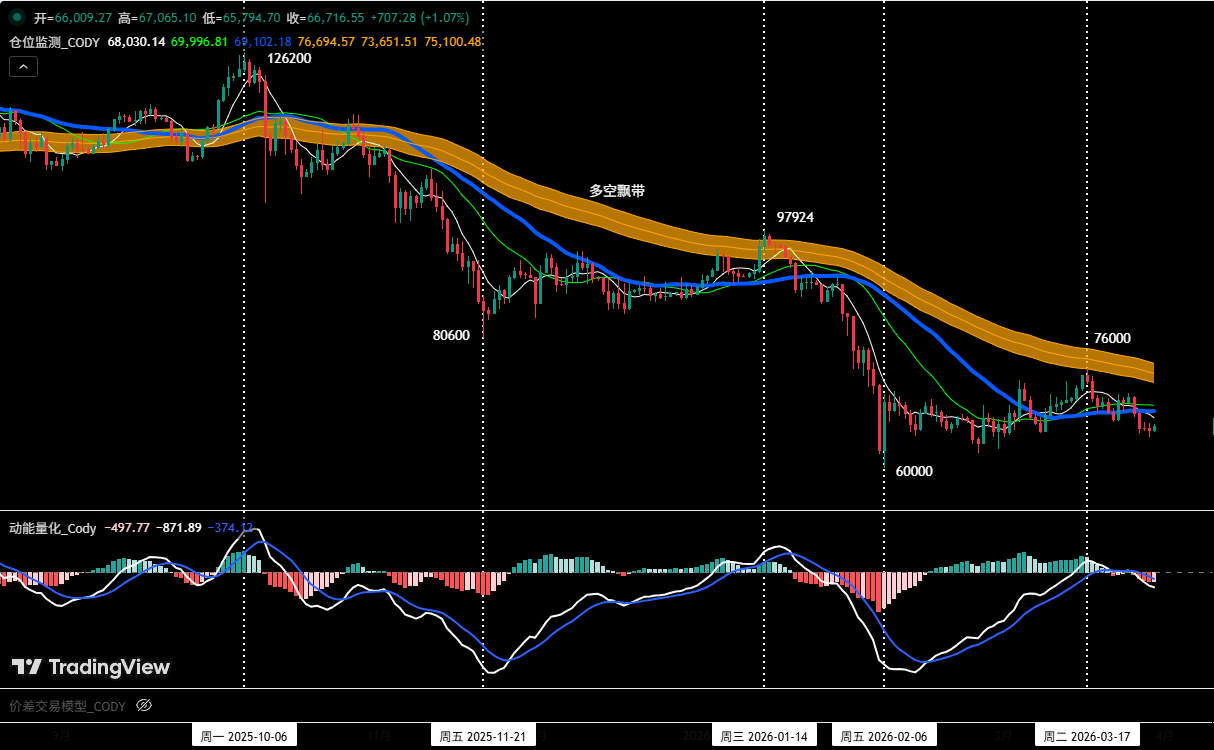
Figure 4
Position Monitoring Model: As shown in (Figure 4), the price is currently below the Bull-Bear Ribbon (yellow), and the bearish trend continues. Following strategy rules, we continue holding the 60% short position established at $89,000 (January 28th). If the price effectively rebounds, breaks through, and stabilizes above the Bull-Bear Ribbon, the entire medium-term position will be closed.
② Short-term Strategy: Utilize 30% of the position, set stop-loss points, and seek “spread” opportunities based on support and resistance levels. (Use 30-minute/60-minute as the operational cycle).
③ Based on the forecast of a medium-term bearish market trend, adhere to the “follow the trend and short” principle. To dynamically respond to complex market evolution and signals from our self-built trading models, we have prepared two short-term operational plans, A and B:
• Plan A: Sell on rallies encountering resistance.
• Entry: When the price rallies to the $69,500–$72,000 zone, triggers resistance signals, and combines with model top signals, a 30% short position can be established.
• Risk Control: Initial stop-loss for shorts set above $74,500.
• Exit: When the price falls near important support levels combined with model signals, gradually close positions to take profits.
• Plan B: Follow-through breakdown short.
• Entry: When the price effectively breaks below the $65,000–$66,000 zone and combines with model top signals, a 30% short position can be established to follow the trend.
• Risk Control: Initial stop-loss for shorts set above $67,500.
• Exit: When falling to support levels combined with model signals, gradually close positions to take profits.
IV. Bitcoin: Trade Review
1. Short-term Trade Review: (See Table 2)
We strictly followed the operational plan and, based on trading signals from our self-built Spread Trading Model and Momentum Quantification Model, completed one short-term (short) trade last week, achieving a profit of 6.17%.
① Summary of Bitcoin Short-term Trade Details: (Leverage*1x)

Table 2
② Short-term Trade Review: (See Figure 5)
• Entry: When the price rallied near $72,000 and encountered resistance, the Spread Trading Model simultaneously triggered a top warning signal (white dot), forming a short-selling confluence with the Momentum Quantification Model. Based on this signal overlay, we established a 15% short position at $70,777.
• Exit: When the price stabilized near $65,000 and the Spread Trading Model triggered a strong bottom warning signal (red dot + white dot), we closed the entire position near $66,408.
• Summary: This trade successfully profited approximately 6.17%.
Bitcoin _60-minute Candlestick Chart: (Momentum Quantification Model + Spread Trading Model)
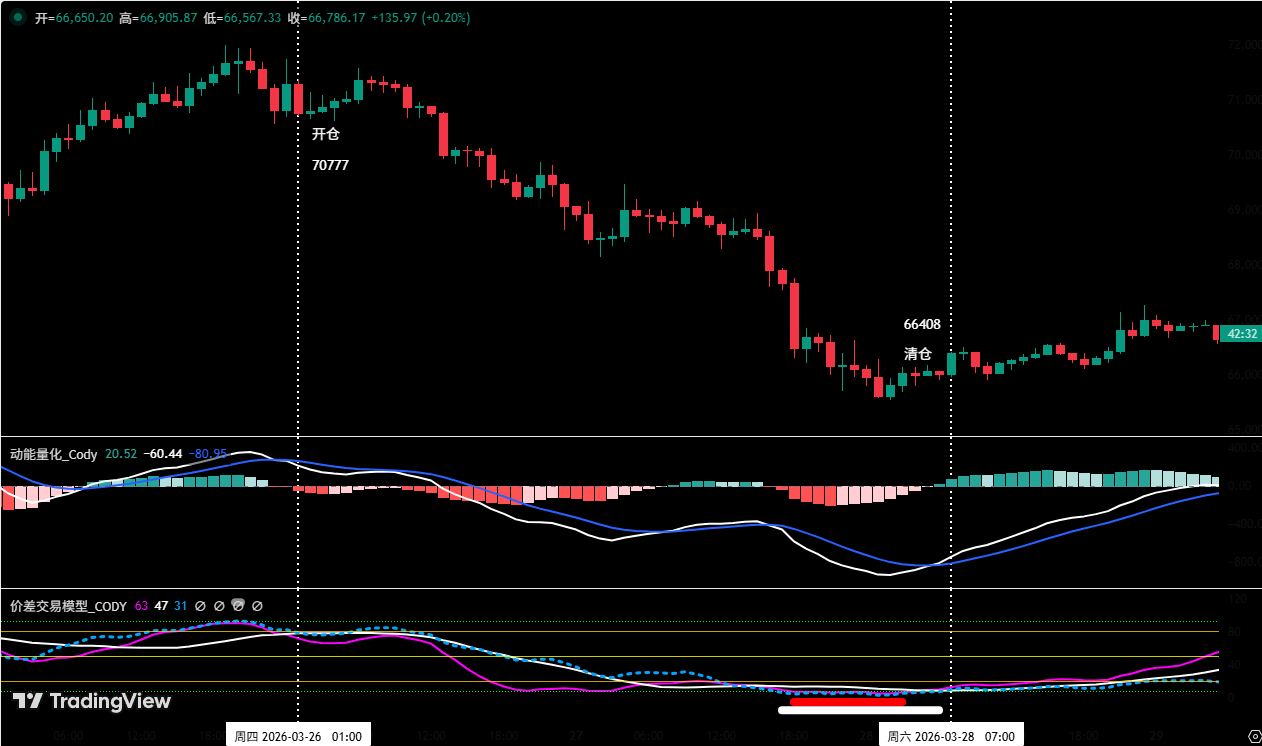
Figure 5 (Short-term Trade Illustration)
2. Medium-term Trade Review:
Medium-term Strategy: Continue holding the 60% short position established near $89,000 (January 28th). As of last week’s post-market close (closing price ~$66,962), the profit is approximately 24.76%.
V. Special Notes:
1. Upon Entry: Immediately set the initial stop-loss level.
2. When Profit Reaches 1%: Move the stop-loss to the entry price (breakeven point) to ensure capital safety.
3. When Profit Reaches 2%: Move the stop-loss to the 1% profit level.
4. Continuous Tracking: Thereafter, for every additional 1% profit, move the stop-loss up by 1% accordingly, dynamically protecting and locking in profits.
Financial markets change rapidly. All market analysis and trading strategies require dynamic adjustment. All views, analytical models, and operational strategies mentioned in this article are derived from personal technical analysis, intended solely for personal trading log purposes, and do not constitute any investment advice or operational basis. Markets involve risks, investment requires caution. Please do not make decisions based on this content.
本文源自網路: Bitcoin Bears Tighten Their Grip, Can the $60,000 Defense Line Hold? | Guest Analysis
Related: Will a 5% U.S. Treasury Yield Be the “Breakdown Signal” for Bitcoin?
Original Compilation: AiddiaoJP, Foresight News Bitcoin has been one of the strongest-performing assets during the US-Iran war. However, as the bond market shows signs of being “out of control,” Bitcoin’s upward momentum is beginning to show signs of exhaustion. Key Takeaways: If the US-Iran war prolongs, the yield on the US benchmark Treasury could rise by 200 basis points. Historical experience suggests that oil-related conflicts tend to push up inflation and suppress risk appetite. Based on this, Bitcoin’s price could potentially fall below $50,000 in 2026. Oil Supply Shock Could Push US Treasury Yields Above 5% Since the US and Israel launched attacks on Iran on February 28, the yield on the benchmark 10-year US Treasury has climbed to around 4.42%, reaching a nine-month high. Monthly performance of US 2-year,…