Pump.fun Stands Alone in the Billion-Dollar Club: The “Oligopoly Game” of the Post-Meme Era
On March 8, Pump.fun’s cumulative revenue surpassed $1 billion, becoming the first platform on Solana to reach this milestone and solidifying its position as the most prominent money printer in the MEME sector. However, after the hype subsided, the question is no longer just “who profited the most,” but rather how much business these platforms, which started with MEMEs, actually have left.
Looking at the leading ecosystem projects—Pump.fun, GMGN, Four.meme, Axiom, as well as Photon, BullX, and BONK—the answer is becoming increasingly clear: MEMEs haven’t disappeared, but the business is increasingly concentrating at the top, and the divergence between chains and platforms is becoming more pronounced.
Pump.fun: The “Absolute Oligarch” Across Bull and Bear 市場s, Struggling to Solidify Billions in Profits
If the last wave of MEME frenzy was a non-stop gold rush, then Pump.fun was undoubtedly the most profitable toll booth in that gold rush town. Public data shows that as of March 2026, Pump.fun’s cumulative total revenue has exceeded $1 billion. Of this, 2024 contributed approximately $321 million, which further expanded to about $664 million in 2025. Starting in 2026, the MEME industry faced a severe downturn, but Pump.fun’s impact seems relatively muted, still generating around $98.3 million in revenue to date.
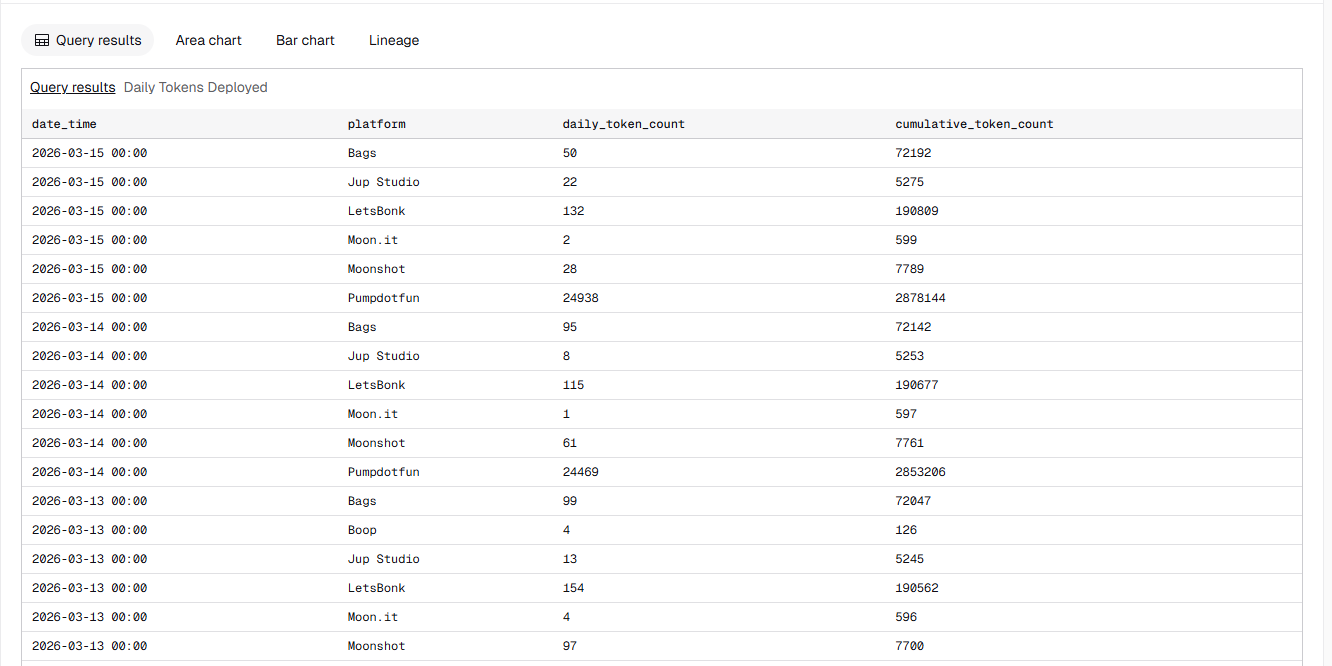
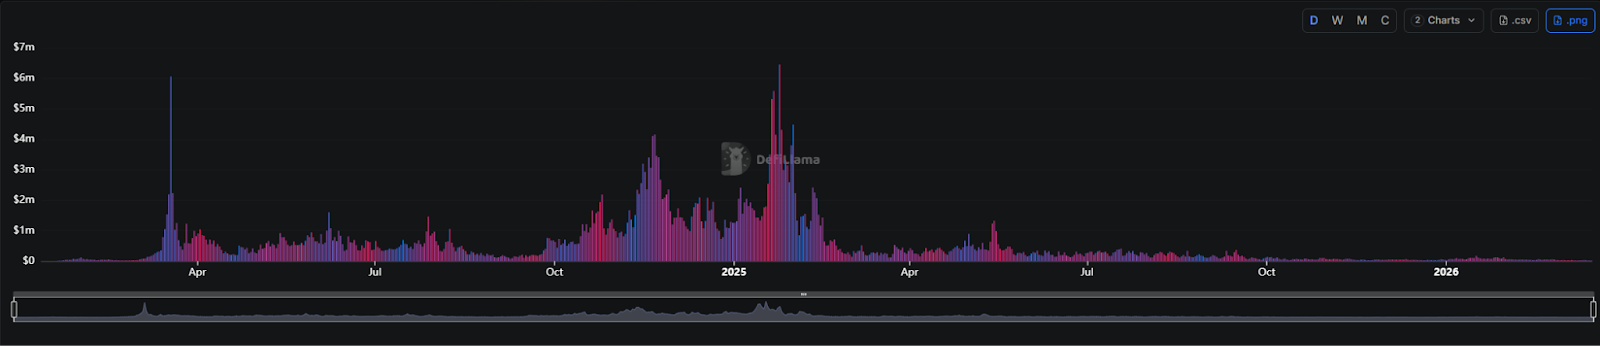
From a market structure perspective, Pump.fun’s dominance within the Solana ecosystem has further strengthened. Taking data from March 15 as an example, Pump.fun accounted for 99.1% of token creations, had a graduation rate of 94.8%, and its daily trading volume share was approximately 93%. That day, Pump.fun launched 24,938 tokens, while LetsBonk had only 132, Bags had 50, and Moonshot had 28. The daily volume of other token launch platforms is completely unable to compete with Pump.fun.
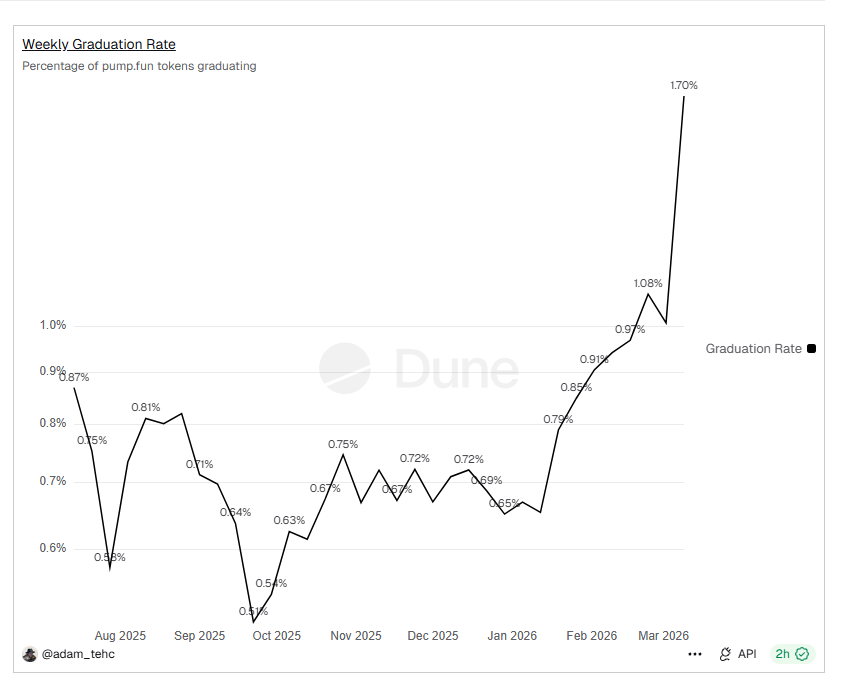
Looking back at Pump.fun’s own data, it has also maintained a peculiarly high standard. A rough calculation based on visible data from the past two weeks shows that Pump.fun currently has a daily average of about 29,700 token launches, approximately 157,700 daily active wallets, a daily average trading volume of about $93.65 million, and daily revenue of about $870,000. Meanwhile, the graduation rate, long considered a weakness of the platform, has shown signs of recovery, recently even surging to around 1.70%. Although the specific reasons behind this short-term peak are not yet confirmed, Pump.fun’s graduation efficiency is indeed recovering.
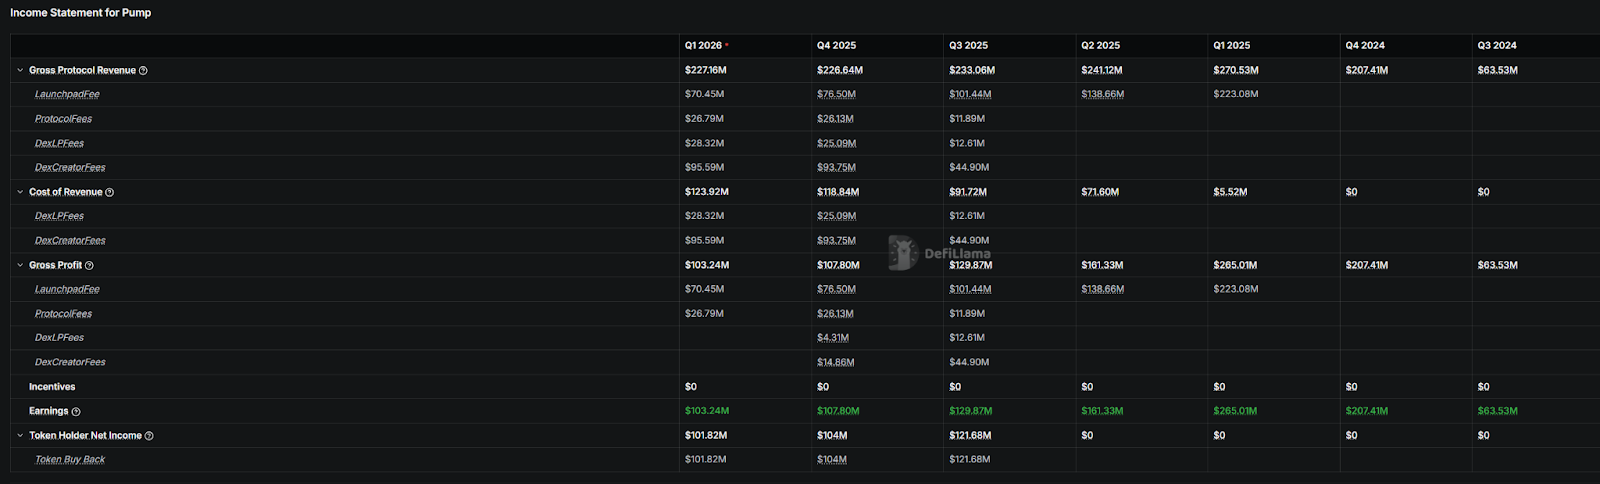
However, although fee generation remains robust, for Pump.fun, this does not mean all this revenue can be fully solidified as protocol profit. First, more than half of the fees are passed on to creators and LPs. Second, beyond creator revenue, the remaining income is also used for token buybacks. In Q1 2026, Pump.fun generated a total of $227 million in fees, of which $123 million was distributed to creators and LPs, and the remaining $100 million was almost entirely used for token buybacks.
The problem, however, is that buybacks haven’t automatically translated into price appreciation. As of March 16, the PUMP price is approximately $0.002, still about 76.21% lower than its all-time high of $0.0088. A more reasonable explanation here is that buybacks can only provide a floor and sustain the narrative, but are insufficient to reverse the overall valuation compression trend in the MEME sector. In other words, Pump.fun’s cash flow machine is still running at high speed, but the market is no longer willing to assign it a higher valuation multiple simply because it “makes money,” as it did during the last hype cycle.
To summarize, for Pump.fun, the market structure remains relatively stable. Although the entire meme coin sector is experiencing a decline, it’s mostly the competitors that are dying off, which in turn strengthens Pump.fun’s dominance. If this market experiences another surge, Pump.fun is likely to capture even greater benefits.
GMGN: Quarterly Revenue Grows Fivefold Sequentially, BSC Emerges as the “New Traffic Darling”
GMGN’s revenue experienced another explosive growth spurt in Q1 2026. Total revenue for Q1 2026 reached $25.31 million, a nearly fivefold increase compared to $5.64 million in Q4 2025. This quarter’s revenue also became the second-highest quarterly revenue in GMGN’s history (only lower than $40.81 million in Q1 2025).
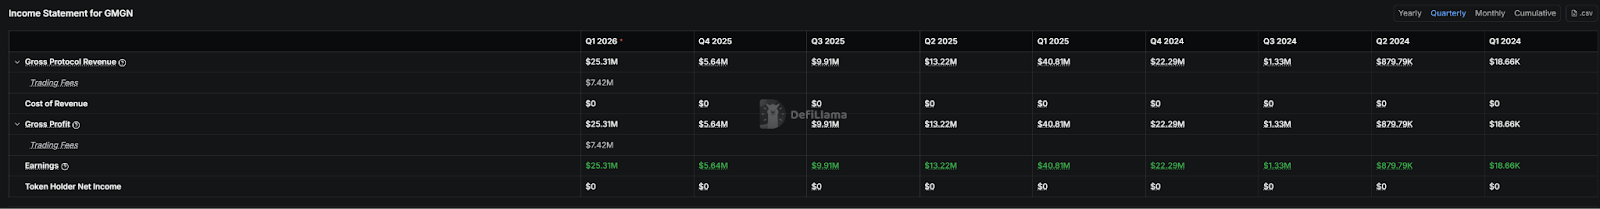
A closer look at this revenue structure reveals that it is primarily driven by the BSC chain. Starting in October 2025, GMGN’s trading volume on BSC began to significantly exceed that on Solana, and by 2026, this trend had stabilized. To date, the trading share on BSC via GMGN is nearly three times that on the Solana chain.
Looking at overall trading volume, GMGN’s user activity and trading volume saw some improvement in Q1 2026, though the magnitude of this increase is not as high as the revenue change suggests. Therefore, from this perspective, GMGN’s Q1 2026 revenue increase is real, but the explosive growth might largely be a statistical issue with DeFiLlama (BSC chain revenue data was empty before October 2025).
However, this growth was mainly fueled by a surge in MEME trading volume on BSC in January, which generated $16.34 million in cross-chain revenue that month. This number dropped to $5.18 million in February and is about $3.77 million so far in March. The overall level for Q1 this year is close to that of the same period in 2025.
Four.meme: The “Flagship” on BSC, Daily Revenue Now a Fraction of Its Peak
If Pump.fun has captured most of the traffic on Solana launch platforms, then on BSC, the closest equivalent role is played by Four.meme.
DeFiLlama data shows that as of March 16, Four.meme’s protocol revenue for Q1 2026 has reached $16 million, significantly lower than the $54.24 million in Q4 2025. However, looking at the monthly revenue changes this year, there has been a slight recovery.
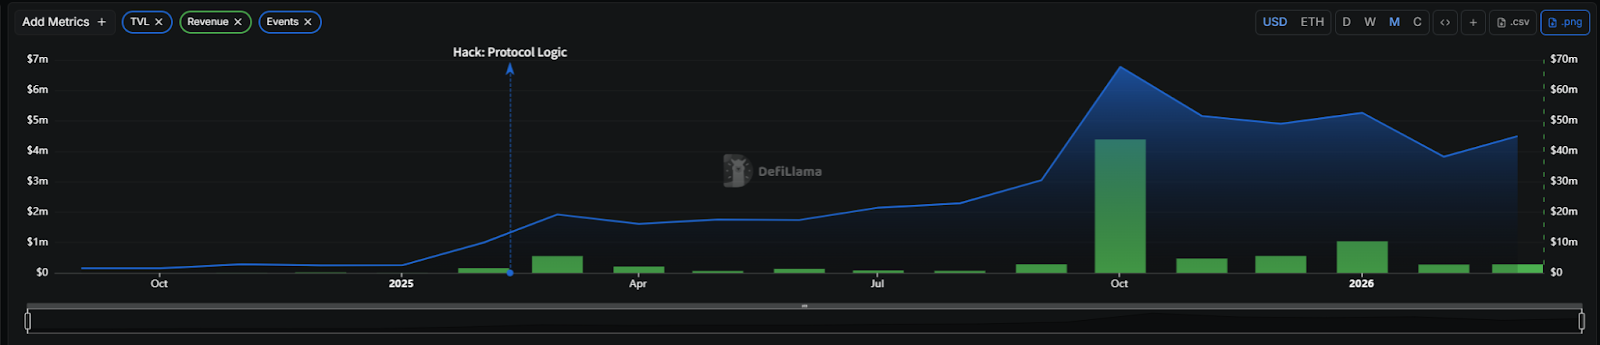
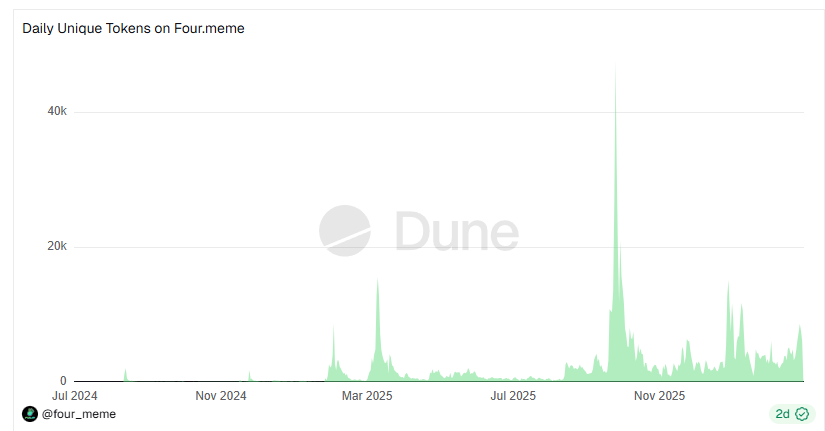
According to visible data from the last 10 days tracked by Dune, Four.meme averages about 4,858 daily token launches, approximately 5,749 daily users, and only about 25.7 tokens actually listed on the DEX Pancake daily. The short-term graduation rate has further compressed to around 0.53%. Looking at these data changes, the current Four.meme is also operating at a low level. Compared to its peak daily revenue of $4.22 million in October 2025, current revenue has dropped to the $200,000-$300,000 range.
For comparison, recent two-week estimates for Pump.fun show it still averages about 29,700 daily token launches and approximately $93.65 million in daily trading volume. Clearly, as the main battlegrounds for MEME coins on Solana and BSC respectively, there is a significant gap in scale and token quality between Four.meme and Pump.fun, reflecting the development status of MEMEs on these two chains.
Axiom: Farewell to High Growth, Stuck in a Persistent Volume Contraction Quagmire
If GMGN’s growth in Q1 2026 was more like catching the BSC rotation wave, then Axiom’s situation is almost the opposite.
According to DeFiLlama data, to date, the protocol’s revenue for Q1 2026 is approximately $29.03 million, higher than GMGN’s $25.31 million for the same period.
However, Axiom’s current problem is that its business is in a state of continuous decline. Based on DeFiLlama’s quarterly revenue data, Axiom’s protocol revenue reached $133 million and $150 million in Q2 and Q3 2025 respectively, but fell back to $60.66 million in Q4 2025, and is $29.03 million so far in Q1 2026. Compared to the most frenzied period last year, the business volume has clearly contracted. Comparing this with GMGN reveals that although both are in a post-peak decline phase, GMGN’s revenue still experiences periodic rebounds, while Axiom seems unable to regain its momentum.
For Axiom, it is no longer just a tool reliant on MEME hype explosions, but more like a mature trading machine tested through multiple market cycles. Compared to GMGN, which still talks about growth elasticity, Axiom’s potential for imagination seems to be shrinking.
Photon, BullX, and BONK: The “Stragglers” After the Tide Recedes
Compared to GMGN, which still sees rebounds, and Axiom, which maintains its top-tier scale, the revenue curves of Photon, BullX, and BONKbot have more clearly entered a downward trajectory in 2026.
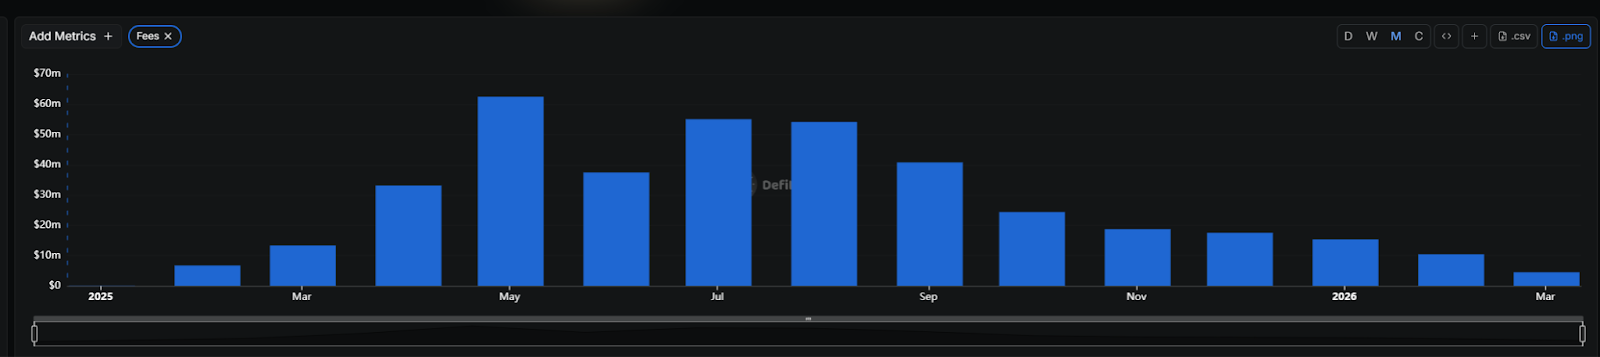
According to DeFiLlama data as of March 16, Photon’s cumulative revenue is approximately $438 million, but its quarterly revenue has declined from $122.8 million in Q1 2025, to $32.31 million in Q2, $18.99 million in Q3, $5.29 million in Q4, and is only $4.52 million so far in Q1 2026, showing a near-stepwise decline.
BullX’s cumulative revenue is about $203 million, but it also experienced rapid contraction. Quarterly revenue dropped from $87.37 million in Q1 2025 to $14.25 million in Q2, $3.86 million in Q3, $878,000 in Q4, and is only $491,000 so far in Q1 2026.
BONKbot’s decline is relatively less steep but has also clearly receded. According to DeFiLlama data, its cumulative revenue is about $93.57 million. Its quarterly revenue was $12.61 million in Q1 2025, then fell to $3.40 million in Q2, $2.85 million in Q3, $1.85 million in Q4, and is $1.84 million so far in Q1 2026.
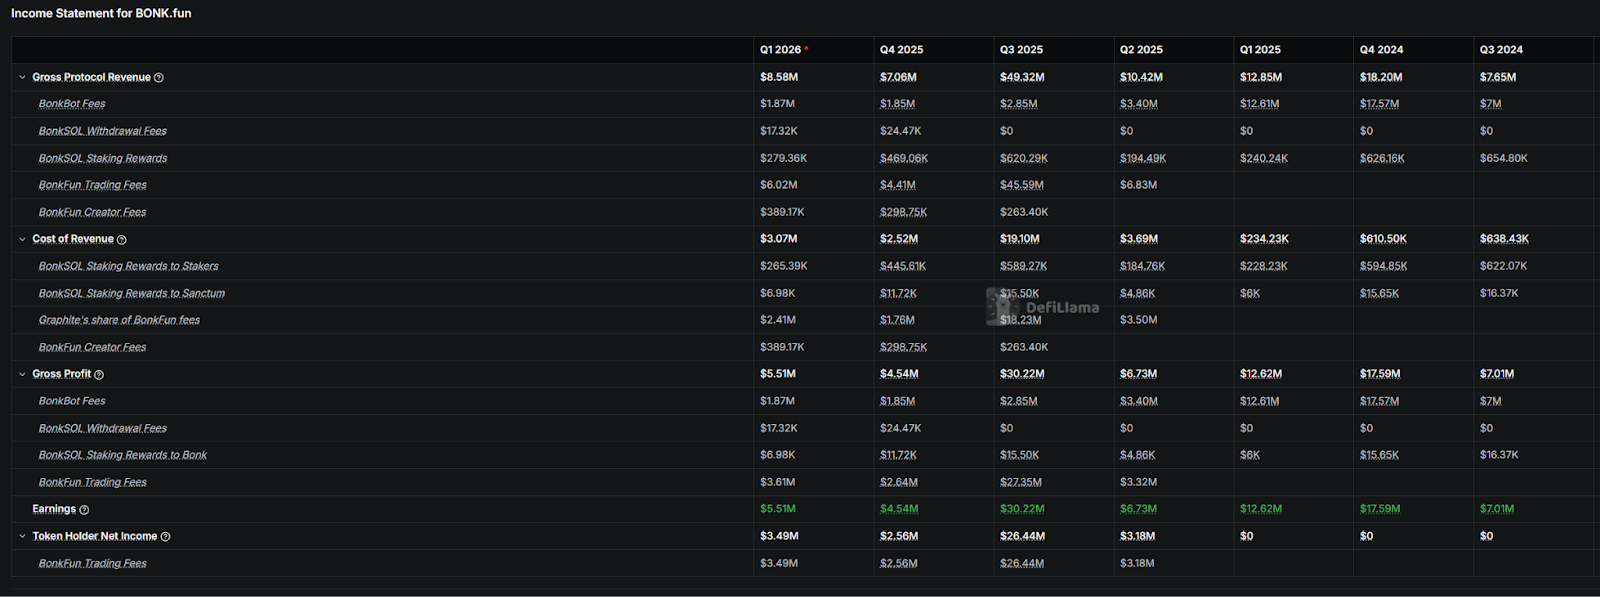
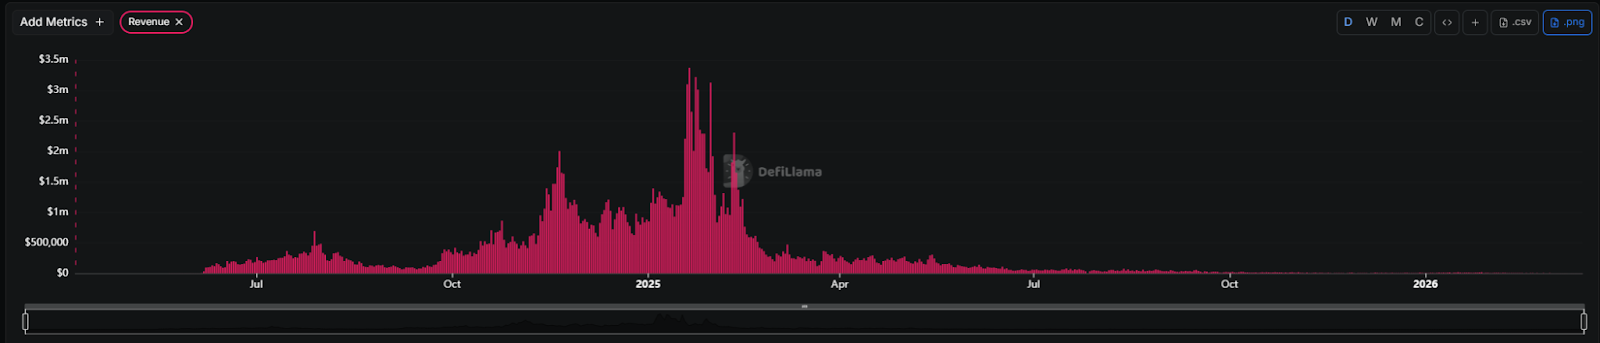
However, the BONK ecosystem itself hasn’t simultaneously fizzled out. To date, BONK.fun’s protocol revenue for Q1 2026 is approximately $8.51 million, already higher than the $7.06 million in Q4 2025. Of the current quarter’s revenue, about $6 million comes from Bonk.Fun and approximately $1.84 million from BonkBot.
Looking at this MEME coin survival race, it’s not hard to draw a conclusion: the MEME sector is not heading towards extinction, but the era of chaotic competition is completely over, with the shakeout happening faster than anyone imagined.
After the tide recedes, the platforms that truly remain are no longer just the fastest runners, but those that have built a complete closed loop encompassing launch, trading, liquidity, and fee generation. If the next wave of MEME sentiment starts again, they are most likely the ones to reap the benefits first.
本文源自網路: Pump.fun Stands Alone in the Billion-Dollar Club: The “Oligopoly Game” of the Post-Meme Era
Related: Decoding Trump’s “War Playbook”: A Complete Signal Guide for Investors
Original Author: @KobeissiLetter Original Compilation: Peggy, BlockBeats Editor’s Note: Amid escalating tensions in Iran and market volatility, investors are most prone to fall into emotional interpretations of the news itself. However, from a longer-term perspective, the multiple trade conflicts, geopolitical frictions, and policy games surrounding the Trump administration often follow a similar pattern: first establishing pressure through public rhetoric and deterrence, then gradually escalating actions, and finally returning to the negotiating table after risks and bargaining chips have sufficiently accumulated. This article attempts to start from this “conflict-escalation-pricing-negotiation” framework to outline the decision-making patterns of the Trump administration over the past year or so, breaking it down into a set of observable market rhythms. For financial markets, the real key is not just the event itself, but how the market…