In such a market environment, we continue to strictly execute our strategy according to the established trading system: on one hand, we persistently track the evolution of HYPE’s Wave III main advance structure; on the other hand, we engage in short-term spread trading and medium-term trend position management centered around BTC’s range-bound pattern.
This week’s report will provide a systematic review and analysis of last week’s market structure, trade execution, and potential market evolution paths for this week, along with corresponding trading strategy references.
Core Summary of the Trading Weekly Report:
• Deep Deconstruction of HYPE’s Multi-Cycle Price Structure: Weekly Tracking. (See Part One for details)
• Verification of HYPE Short-Term Trading Results: HYPE completed one short-term long position operation (1x leverage) last week, successfully achieving a profit of approximately 18.44%. (See Table 1 for details)
• Verification of BTC Strategy Execution (Short-term) Results: Bitcoin followed the established short-term strategy last week, completing one short-term short position operation (1x leverage), successfully achieving a profit of approximately 2.01%. (See Table 2 for details)
• Verification of BTC Strategy Execution (Medium-term) Results: Bitcoin followed the established medium-term strategy last week, continuing to hold the short position established at $89,000 (1x leverage). As of last week’s close (approximately $72,831), the profit is about 18.17%, with a maximum profit during the period of about 32.58%.
• Verification of Core View (Short-term): Bitcoin continued to maintain a weak range-bound consolidation pattern last week. The current price action is in line with expectations.
• Bitcoin’s Price Movement Forecast and Medium/Short-term Trading Strategies for This Week.
I. HYPE: Price Structure Analysis and Short-Term Operation Review
1. Continuous Tracking of HYPE 市場 Dynamics and Investment Opportunities
• Weekly Review on February 23: First hinted that HYPE might be entering an investment window, noting the price was in a Wave II correction phase and predicting the potential start of a Wave III main advance.
• Weekly Review on March 3: Determined that the low of $25.60 on February 24 might be the starting point of Wave III, confirming the trend reversal point.
• Weekly Review on March 9: Pointed out that the price had effectively broken through multiple moving average resistance on the daily chart, subsequently entering a retracement and consolidation phase, which is a process of momentum accumulation, expecting a rapid rise after its completion.
2. Overview of HYPE Daily Chart Price Structure: (Based on price action since January 21)
• Wave I (Impulse Wave): From the low of $20.46 on January 21 to the high of $38.41 on February 3, lasting 14 days, with a maximum gain of 87.73%.
• Wave II (Corrective Wave): From the high of $38.41 on February 3 to the low of $25.60 on February 24, lasting 20 days, with a maximum decline of 33.35%.
• Wave III (Main Advance Wave): From the low of $25.60 on February 24 to present, reaching a new high of $38.85 on March 14, successfully breaking above the Wave I peak of $38.41, confirming the establishment of Wave III. So far, the wave has lasted 20 days, with a maximum gain of 51.76%, and the main advance trend is continuing.
3. HYPE Hourly Chart Sub-Structure: (Based on price action since March 8)
HYPE_60-minute K-line Chart
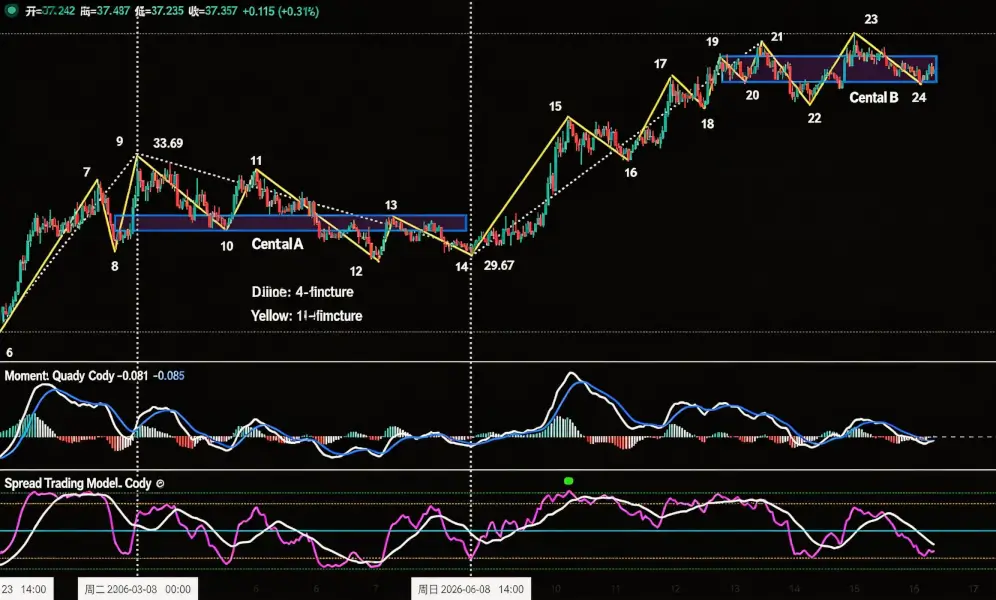
Figure 1
• Review of HYPE Hourly Chart Structure (03.02~03.08): In the March 9 weekly review, we considered the hourly-level correction starting March 2 could be divided into 5 corrective segments: 9-10, 10-11, 11-12, 12-13, 13-14. Analysis showed a clear bottom divergence signal when comparing the entry segment (9-10) with the exit segment (13-14). Therefore, we judged a high probability that the correction ended at endpoint 14 (approx. $29.67).
• The rally starting from the March 8 low (endpoint 14) can be internally divided into a 10-segment structure from endpoint 14 to 24. These 10 segments (i.e., 14-15, 15-16, 16-17, 17-18, 18-19, 19-20, 20-21, 21-22, 22-23, 23-24) constitute an upward impulse wave. As of the time of analysis, this upward structure is still ongoing.
• Central Pivot (Zhongshu) Construction: Within the latest 10-segment structure, segments 19-20, 20-21, 21-22, 22-23, 23-24 are currently constructing an upward central pivot structure.
4. Core View for This Week: The current price action is within the Wave III trend. After the central pivot construction is complete, the key to subsequent price action lies in observing whether the price can effectively break free from the gravitational pull of this pivot. High probability of continued range-bound consolidation this week.
5. HYPE Short-Term Operation Review (1x Leverage): (03.09~03.15)
Last week, based on trading signals from our self-constructed spread trading model and momentum quantification model, combined with the prediction of the Wave III main advance, we completed one short-term (long) operation, successfully profiting 18.44%.
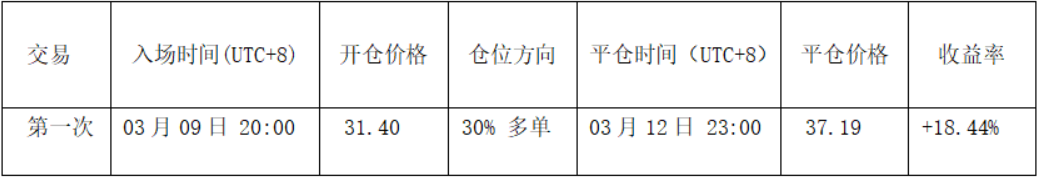
Table 1
• Entry Decision (See Figure 2): This entry decision integrated triple verification from trend, structure, and quantitative signals: First, judging that the hourly correction structure had ended at endpoint 14 (~$29.67); subsequently, the price effectively broke above the resistance of the previous platform’s upper rail (~$31.33); simultaneously, based on bottom resonance signals from the spread quantification model and momentum quantification model, we opened a 30% long position at $31.40.
• Exit Decision: Based on top resonance signals from the spread quantification model and momentum quantification model, and the price approaching the Wave I peak near $38.41, we closed the position near $37.19.
• Trade Summary: This operation successfully captured the Wave III rally opportunity, achieving a profit of approximately 18.44%.
HYPE_60-minute K-line Chart
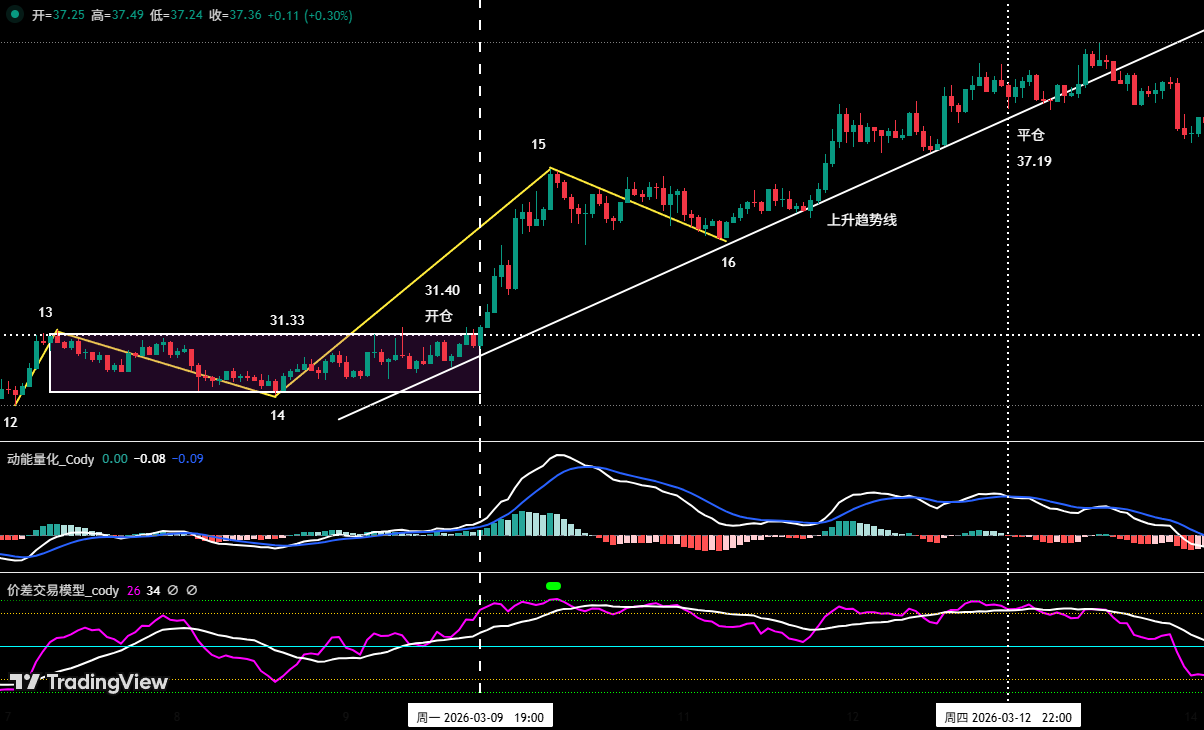
Figure 2 (Short-Term Trade Illustration)
II. Bitcoin: Price Structure Analysis and Long/Short-Term Operation Review
1. Short-Term Trading Strategy Review: (See Table 2)
We strictly followed trading signals from our self-constructed spread trading model and momentum quantification model, combined with market movement predictions, and completed one short-term (short) operation last week, achieving a trading profit of 2.01%.
① Summary of Bitcoin Short-Term Trade Details: (Leverage*1x)
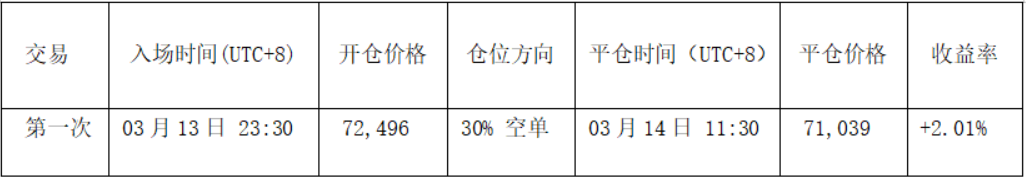
Table 2
② Short-Term Trade Review: (See Figure 3)
• Entry: The price rebounded to around $74,500 and encountered resistance. Simultaneously, the spread trading model triggered a strong top warning signal (green dot in the chart), and both models showed shorting resonance signals. Therefore, we established a short-term 30% short position at $72,496.
• Exit: The price fell to around $70,500, and the spread trading model triggered a bottom warning signal (red dot in the chart). Therefore, we closed the entire position near $71,039.
Bitcoin 30-minute K-line Chart: (Momentum Quantification Model + Spread Trading Model)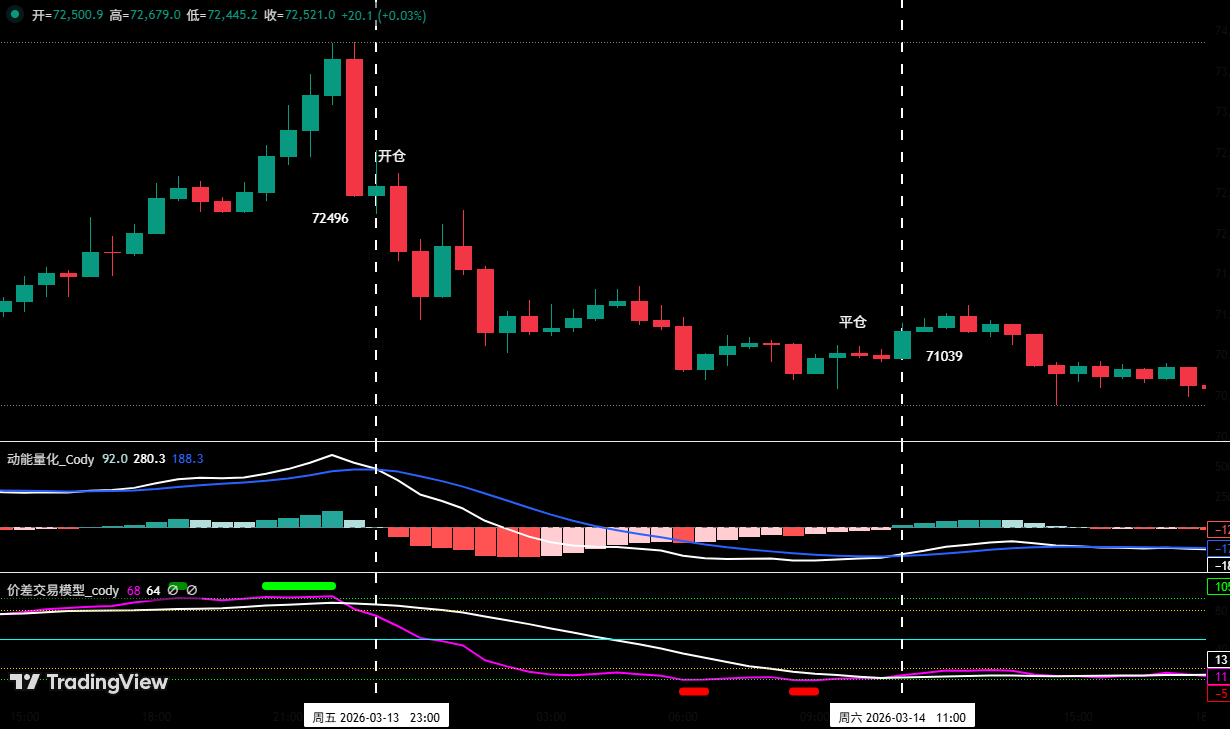
Figure 3 (Short-Term Trade Illustration)
2. Medium-Term Trading Strategy Review:
Medium-Term Strategy: Continue holding the 60% short position established near $89,000 (January 28). As of last week’s post-market close (closing price approx. $72,831), the profit is approximately 18.17%.
III. Bitcoin: Weekly and Daily Technical Indicator Analysis
Combined with market movements, the author conducts an in-depth analysis of multiple Bitcoin technical indicators from the perspectives of multi-model and multi-dimensional analysis based on a self-constructed trading system.
1. Analysis from the Weekly Chart Level, as shown in (Figure 4):
Bitcoin Weekly K-line Chart: (Momentum Quantification Model + Sentiment Quantification Model)
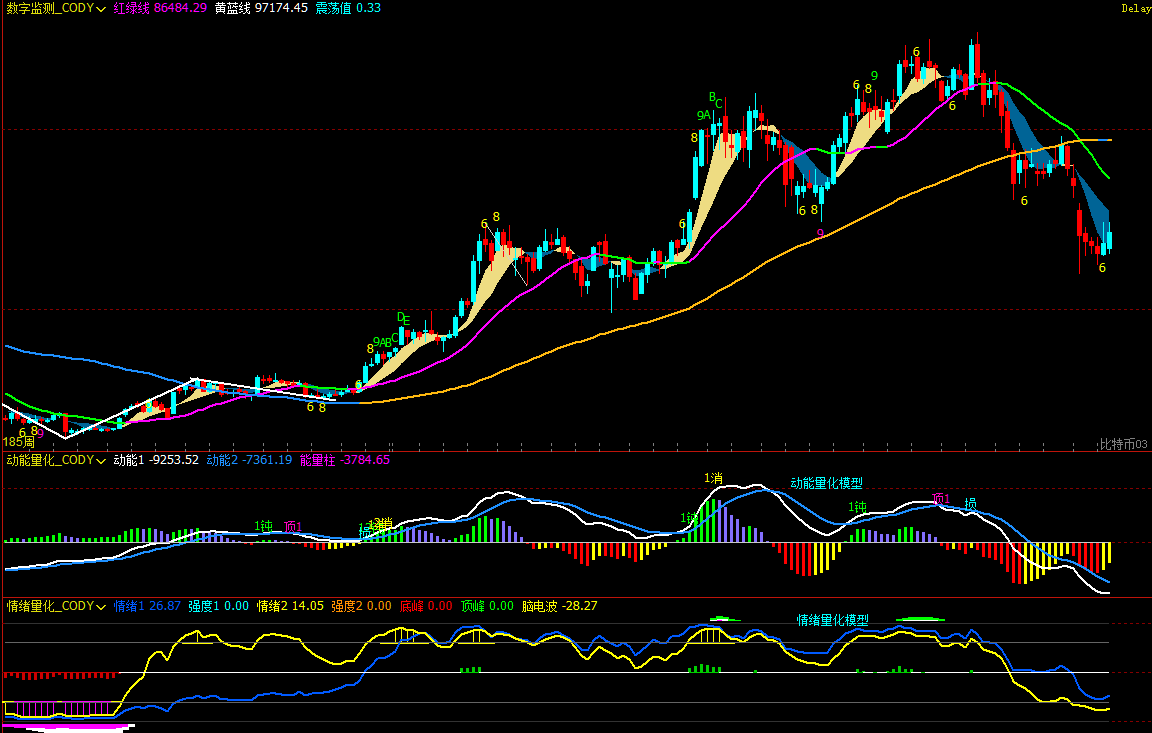
Figure 4
• Momentum Quantification Model: Technical indicators show the momentum lines declining synchronously, with the white momentum line showing signs of flattening. The negative energy bars are gradually shortening, with no divergence signals appearing.
• Sentiment Quantification Model: Blue sentiment line value 26, intensity zero; Yellow sentiment line value 13, intensity zero; peak value is 0.
• Digital Monitoring Model: Moving averages show a bearish alignment. Last week closed with a large bullish candle, gaining about 10.39%. The price stood above the 7-week moving average for the first time; no bottom digital monitoring signals appeared.
Comprehensive Analysis: Judging from the data of the three models above, last week’s market rebound was significant, with concentrated release of bullish momentum, repairing multiple technical indicators and alleviating oversold conditions. However, we believe the bearish trend on Bitcoin’s weekly chart has not reversed. The large bullish candle from last week requires further observation to confirm its sustainability.
2. Analysis from the Daily Chart Level: As shown in (Figure 5)
Bitcoin Daily K-line Chart: (Momentum Quantification Model + Sentiment Quantification Model)
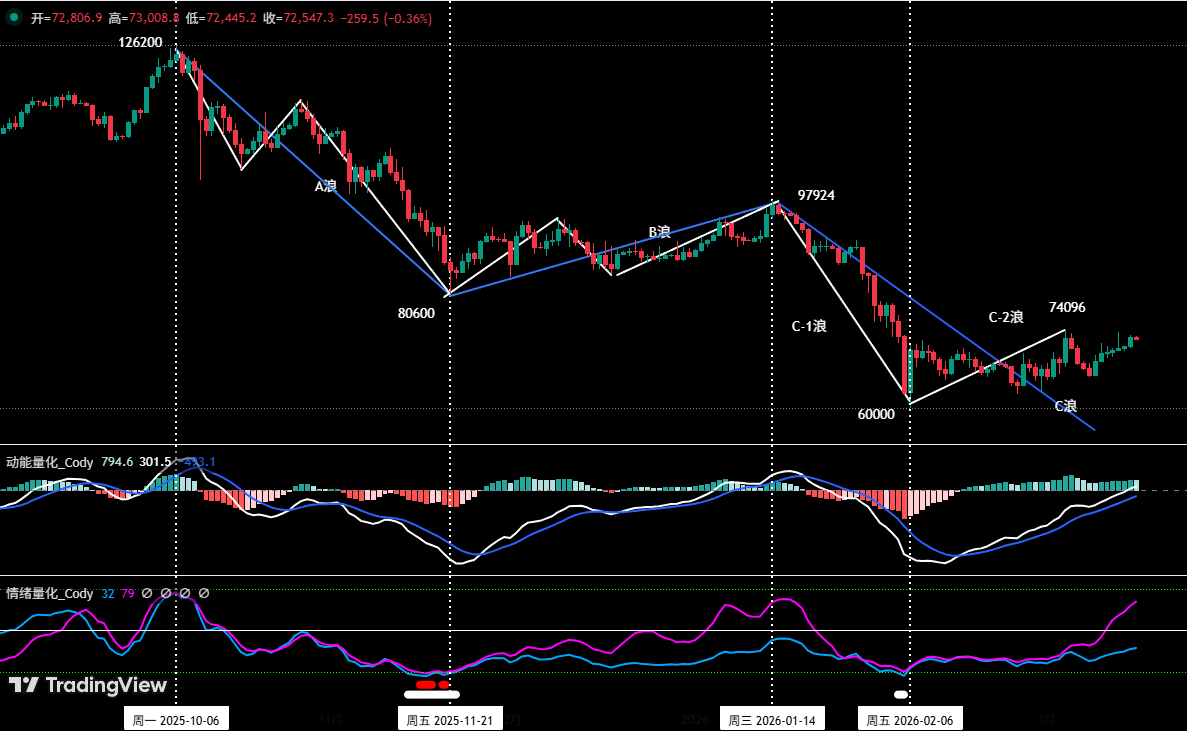
Figure 5
• Momentum Quantification Model: Last week’s overall price action showed a “volatile upward” pattern. Momentum lines are rising synchronously below the zero axis, with the white momentum line crossing above the zero axis for the first time. Positive energy bars are gradually strengthening, but the force is weak.
• Sentiment Quantification Model: As of last week’s daily close, blue sentiment line value 31, intensity zero; purple sentiment line value 75, intensity zero, with the purple line rising significantly.
Comprehensive Analysis: Combining momentum and sentiment quantification model analysis, we believe: Although last week’s daily chart consecutively closed with 7 bullish candles, showing strong short-term rebound momentum, daily trading volume did not increase correspondingly. The overall movement still falls within the scope of an oversold rebound and has not broken out of the range-bound consolidation pattern. The daily bearish trend continues. Subsequent focus should be on the battle between bulls and bears around the key demarcation line (zero axis).
IV. This Week’s 市場 Forecast: (03.16~03.22)
1. Bitcoin’s Upward Central Pivot Construction (Based on price action since the February 6 low): (Updated Weekly)
Bitcoin 4-hour K-line Chart
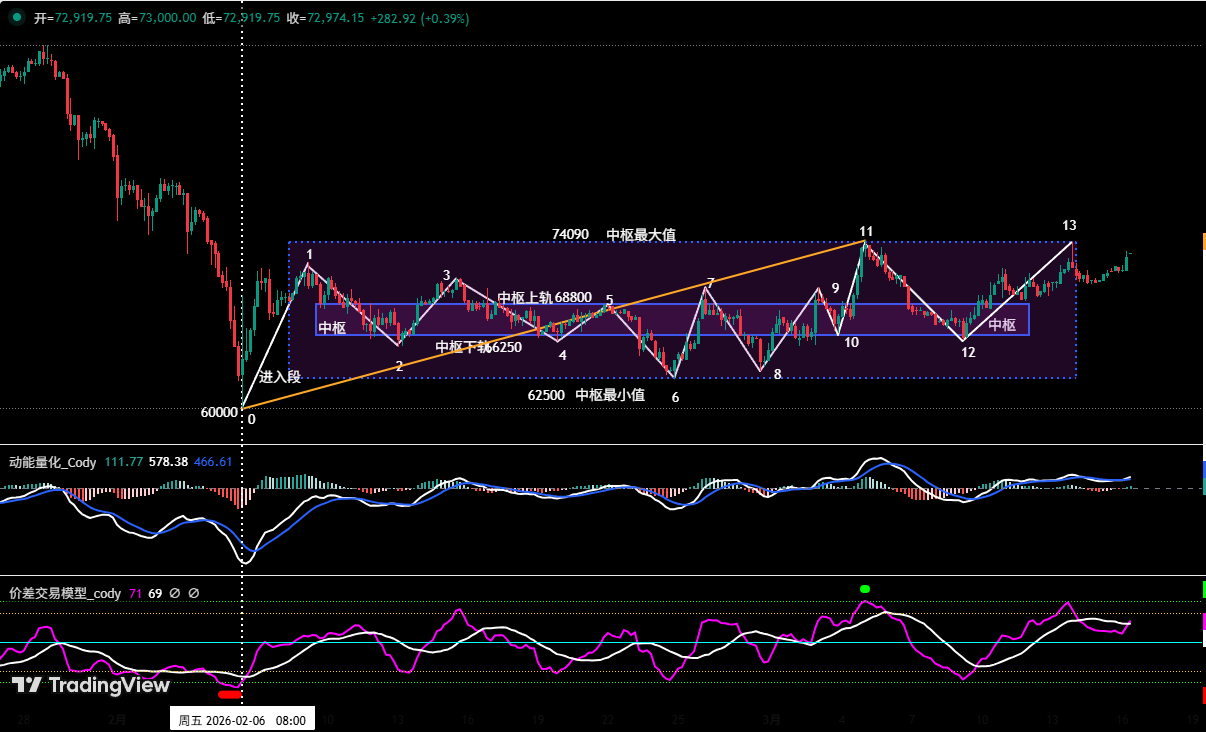
圖6
Using Bitcoin’s 4-hour chart as the analysis period:
• Central Pivot Construction: As shown in (Figure 6), last week primarily ran the 12-13 segment price structure. Currently, the upward central pivot is under construction. Its highest resistance level has moved up to around $74,090, and the lowest support level is around $62,500; the pivot’s upper rail is around $68,800, and the lower rail is around $66,250.
2. Judgment on the End of the C-2 Wave Rebound:
• Maintain the previous core analytical framework: The rally in Bitcoin starting from the February 6 low (~$60,000) is, in nature, a C-2 wave oversold rebound within a larger-degree C wave correction, to be followed by a C-3 wave corrective move.
• Basis for C-2 Wave Rebound End: If the price effectively breaks below the central pivot lower rail support around $66,250 during a correction, and subsequent pullbacks fail to reclaim that level, it constitutes a third-type selling point in Chan theory. This signal indicates strong selling momentum, potentially damaging the rebound structure, significantly increasing the likelihood that the C-2 wave rebound has ended.
3. Core View for This Week: Maintain the $62,500~$74,500 range-bound consolidation pattern, observing the battle between bulls and bears near the upper and lower edges of the range; Pay special attention to price action after an effective break below the central pivot lower rail (~$66,250). Strategically, firmly execute the operational principle of “reducing positions (longs) on rallies, controlling risk.”
4. Core Resistance Levels:
• First Resistance Zone: Around $74,500 (Near previous important lows)
• Second Resistance Zone: $79,500~$80,600 area (Near November 2025 lows)
5. Core Support Levels:
• First Support Level: Around $65,000 (Previous important support area)
• Second Support Level: $60,000~$62,500 area (Near February 6 low)
• Third Support Level: Around $57,400
V. This Week’s Trading Strategies (Excluding Sudden News Impact): (03.16~03.22)
1. Medium-Term Strategy: (See Figure 7)
Bitcoin Daily K-line Chart: (Position Monitoring Model)
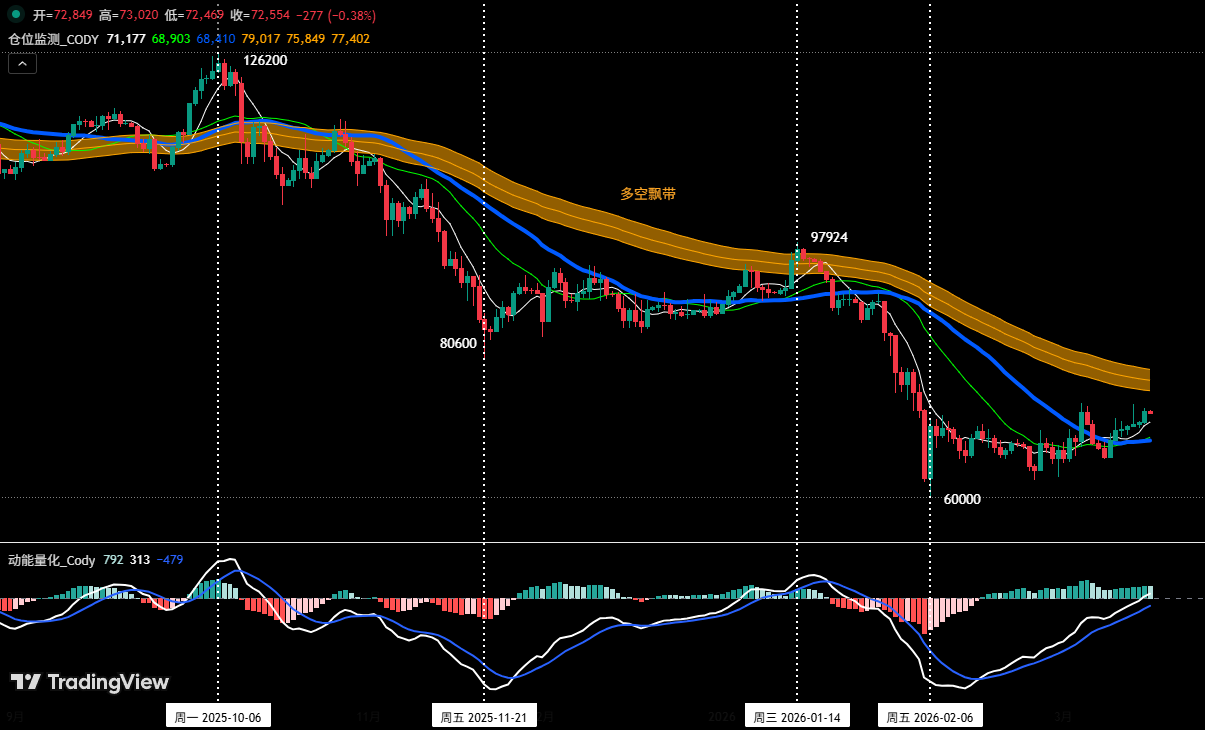
Figure 7
Position Monitoring Model: Currently, the price is below the Bull-Bear Ribbon (yellow). Therefore, continue holding the 60% short position established at $89,000 (January 28).
• If the price rebounds and effectively breaks above $74,500, reduce the medium-term position to 40%.
• If the price rebounds, effectively breaks above and stabilizes above the Bull-Bear Ribbon, clear all medium-term positions.
2. Short-Term Strategy: Utilize 30% of capital, set stop-loss points, and look for “spread” opportunities based on support and resistance levels. (Using 30-minute/60-minute charts as the operation cycle).
3. Since the market’s medium-term direction is bearish, to dynamically respond to complex market evolution and signals from our self-built trading models, we have formulated two short-term operation plans, A and B:
• Plan A: Sell on rallies encountering resistance.
• Entry: When the price continuously rebounds to around $74,500, triggering resistance signals combined with model top signals, a 30% short position
本文源自網路: BTC Rebound Still a Correction, HYPE Main Uptrend Begins | Guest Analysis
Original compilation: Luffy, Foresight News According to company documents and informed sources, four days before Donald Trump’s presidential inauguration last year, a deputy of an Abu Dhabi royal family member secretly signed an agreement with the Trump family to acquire a 49% stake in their startup cryptocurrency venture for $500 million. The buyer paid half upfront, with $187 million transferred directly to Trump family entities. This deal with World Liberty Financial, previously unreported, was signed by the president’s son, Eric Trump. Documents show an additional at least $31 million was directed to entities linked to the family of the company’s co-founder, Steve Witkoff, who had been appointed as the U.S. Middle East envoy just weeks earlier. Sources say the investment was backed by Sheikh Tahnoon bin Zayed Al Nahyan, an…