Polygon’s (MATIC) price broke out from a long-term descending resistance trend line that existed since the December 2021 all-time high.
價格也已達到長期水平區間的頂部。會不會爆發或被拒絕?
MATIC 突破長期阻力位
每週時間框架技術分析顯示,MATIC 自 2022 年 6 月以來一直在上漲。在 2023 年 10 月創造更高的低點後,它加快了上漲速度。
上週,MATIC 價格突破了存在近 800 天的下降阻力趨勢線。更具體地說,該趨勢線自 2021 年 12 月歷史高點以來一直存在。在此之前,MATIC 價格曾多次嘗試突破但未成功(紅色圖示)。
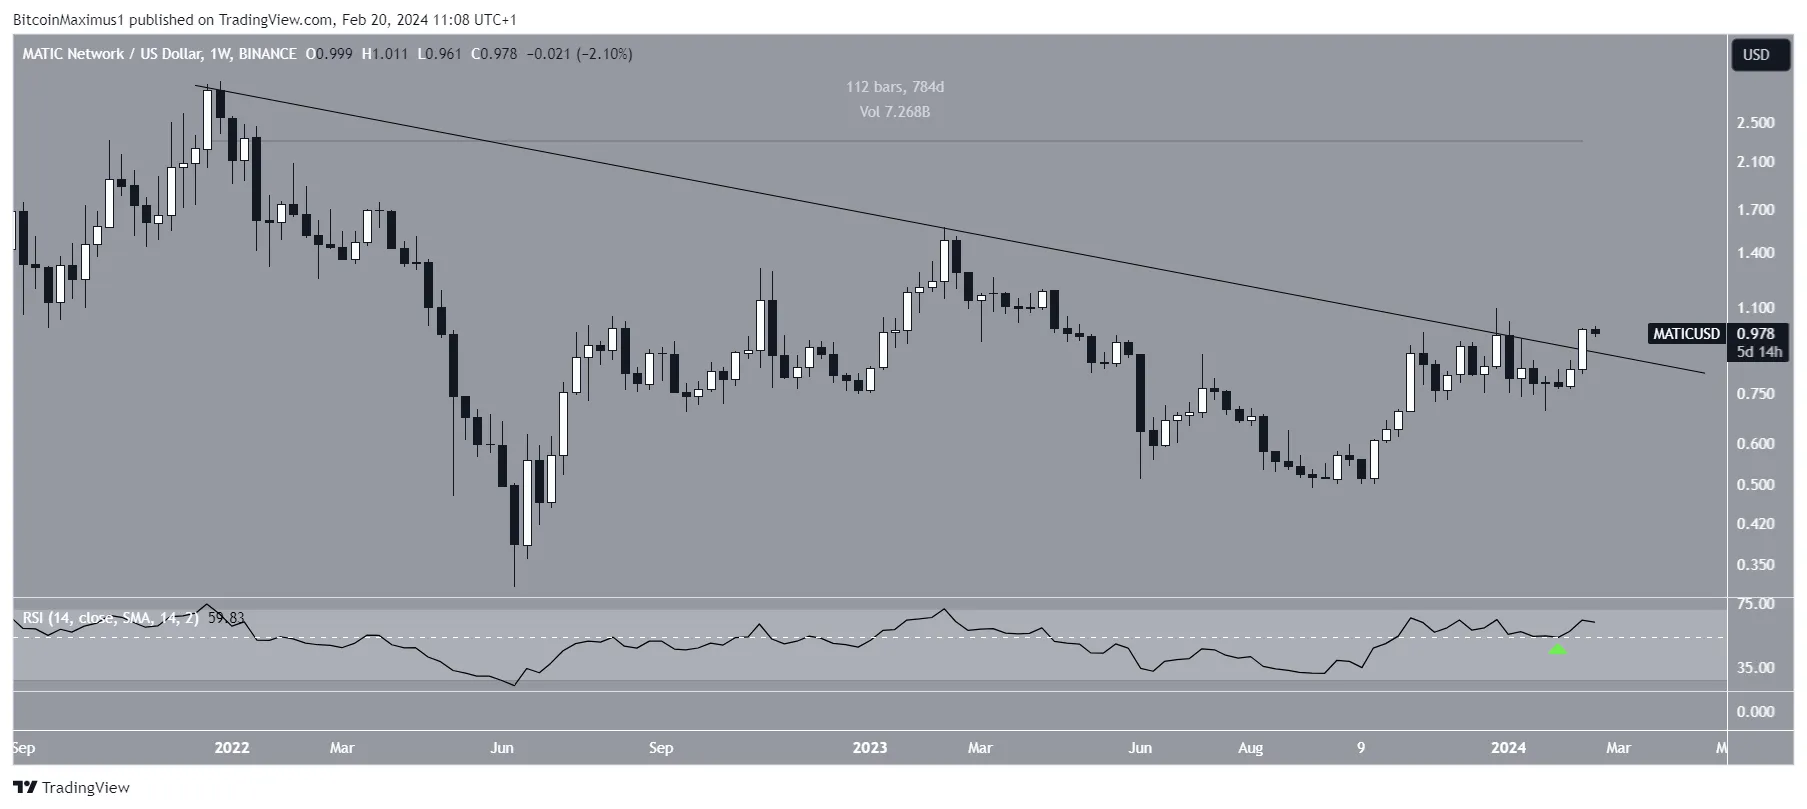
每週相對強弱指數(RSI)給予看漲訊號。市場交易者使用 RSI 作為動量指標來識別超買或超賣狀況,並決定是否累積或出售資產。
讀數高於 50 且呈上升趨勢表示多頭仍具有優勢,而讀數低於 50 則表示情況相反。當價格突破時,該指標在 50 處反彈,使突破合法化。
分析師怎麼說?
Cryptocurrency traders and analysts on X positively view the future MATIC trend.
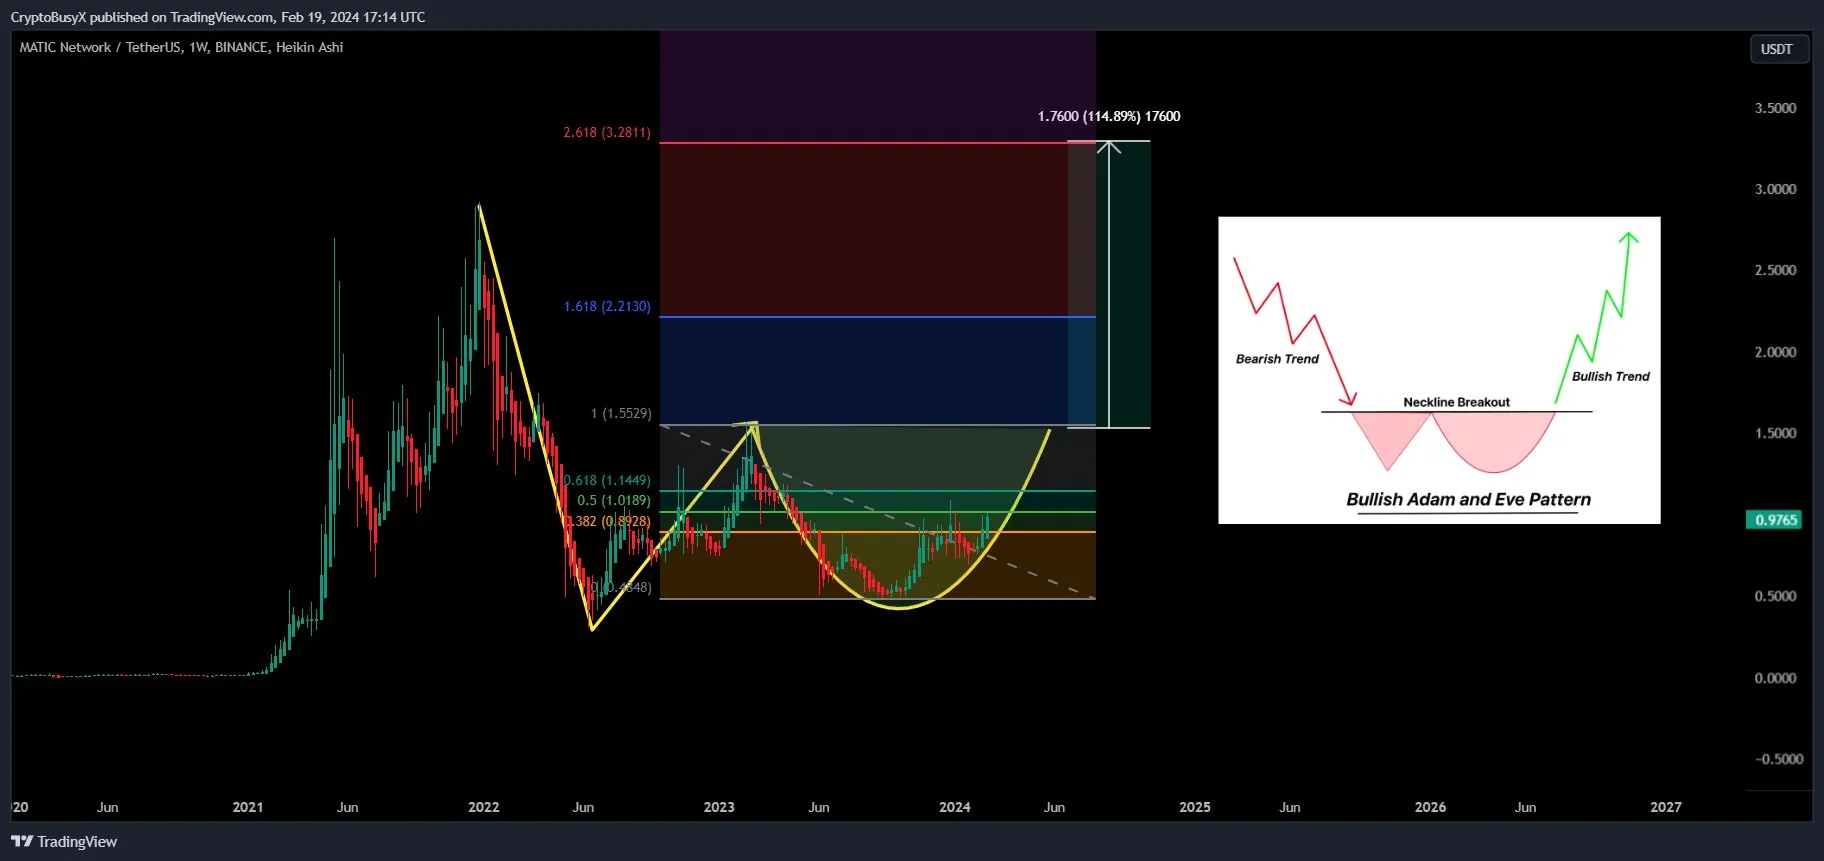
CryptoBusy 認為,由於杯柄模式,MATIC 將增加到 $3。
NFT Cryptomaniac 也有同樣的信念。
“Nothing new here! I’ll let you know if anything changes, otherwise you just close your eyes and open it at $1.80-$1.90-$2.00 depending on the fomo.” He stated
接下來,Don Of Charts 表示 MATIC 價格很快就會達到下一個阻力位 $1。
MATIC價格預測:價格能否達到$2?
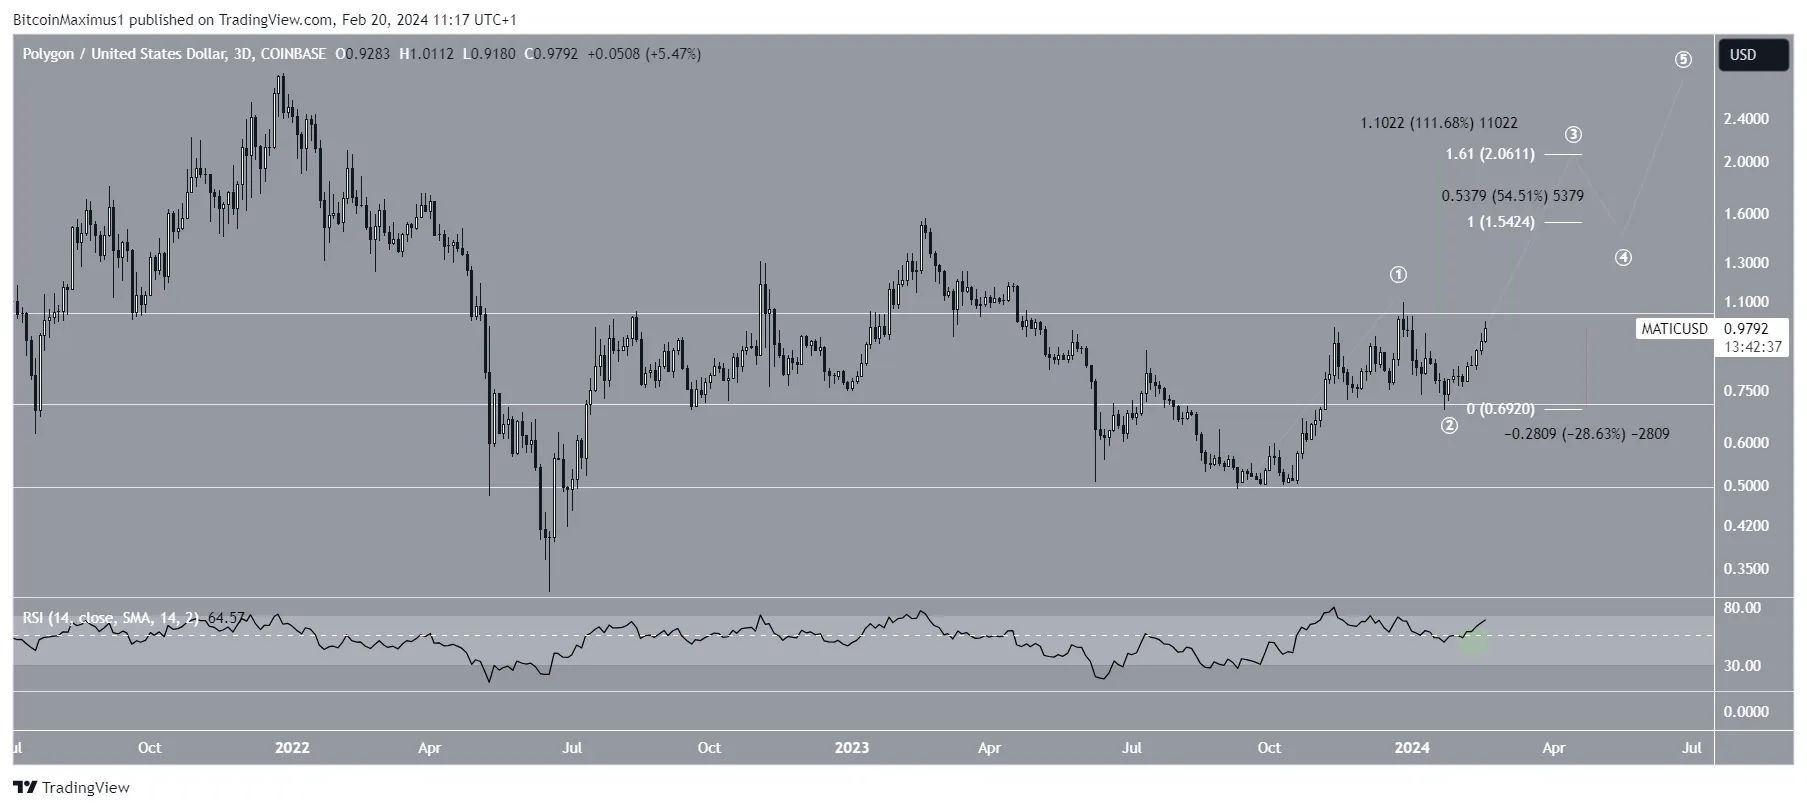
3 天時間框架的分析也給出了看漲的數據,支撐了周線的分析。這是因為價格走勢、波浪計數和 RSI 讀數。
價格走勢表示 MATIC 正在接近長期區間(白色)的頂部 $1。該系列自 2022 年 7 月起就已存在。
The wave count suggests a breakout will transpire. Technical analysts utilize the Elliott Wave theory to ascertain the trend’s direction by studying recurring long-term price patterns and investor psychology. The most likely count indicates that MATIC is in wave three of a five-wave upward movement.
最後,3 日 RSI 支撐突破,因為它最近突破了 30。
給予第一波和第三波 1:1 的比例將導致高於目前 MATIC 價格的 $1.55、55% 高點。若第三浪延伸至第一浪長度的1.61倍,則可達到$2.05,較目前價格上漲110%。
儘管 MATIC 價格預測看漲,但如果拒絕區間高點,可能會引發 30% 下跌至區間中間 $0.70。
對於 BeInCrypto‘s latest crypto market analysis, click here.


好項目