How far is this U.S. stock bull market from the peaks of historical bubbles?
Original source: Wall Street CN
Goldman Sachs’ chief U.S. equity strategist’s latest assessment shows that current market euphoria has risen to the 86th percentile historically, approaching but not yet reaching the extreme levels seen at the peak of the 2000 internet bubble and the 2021 bull market.
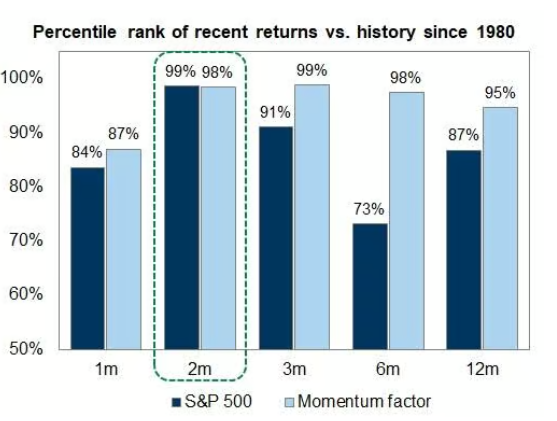
Over the past two months, the S&P 500 index surged 15% before Friday’s pullback, a gain ranking at the 99th percentile in historical data since 1980. In his latest report, Goldman Sachs Chief U.S. Equity Strategist Ben Snider pointed out, although none of the four historical signals of a bull market peak—speculative frenzy, deteriorating growth, massive stock issuance, and Fed tightening—are fully present yet, each is closer to the trigger threshold than it was a few months ago.
For the market, this assessment implies that the current bull run still has room to run, but risks are accumulating. Snider explicitly stated, “We are not there yet,” while also warning that the market does not need to reach extreme investor euphoria to decline, and historical patterns may not necessarily repeat in this cycle.
The Ferocity of the Rally: The Strongest Volatility-Adjusted Rebound in 50 Years
The speed of this rebound has already left its mark on history. According to Goldman Sachs data, the S&P 500 rose 15% in about two months, with a return/volatility ratio relative to realized volatility approaching 4, the highest level in over 50 years.
Artificial intelligence is the core theme driving this market. AI concept stocks, momentum factors, and major indices have all rallied simultaneously, forming a high degree of resonance.
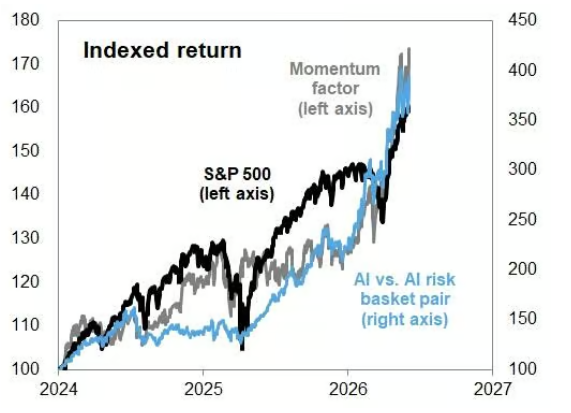
Snider notes that unlike similar momentum-driven rallies in the past (such as late 1999 and late 2021), the primary support for this upswing comes from recent significant upward revisions in earnings expectations, rather than pure sentiment bubbles. This, to some extent, gives this rally a more solid fundamental foundation.
Euphoria Indicator: 86th Percentile, Below Two Historical Peaks
To quantify current market sentiment, Snider constructed a comprehensive assessment framework covering four major categories and a total of nine indicators. Historical data shows that at the peak of the 2000 internet bubble, the median ranking of these indicators was at the 100th percentile historically; at the 2021 bull market peak, it was at the 95th percentile. The current reading is at the 86th percentile—above the historical average, but still with a clear gap from the two previous extreme peaks.
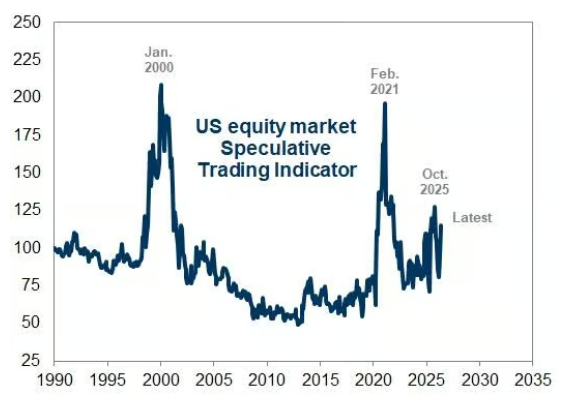
Specifically, Goldman Sachs’ speculative trading indicator has risen in recent months but remains below the levels seen at the end of 2025 and far below the peaks of 2000 and 2021. Among various speculative trading activities, trading volume in high-valuation stocks has expanded significantly recently, while trading activity in loss-making stocks has been relatively modest. Additionally, trading volume in stock call options and retail margin debt are both trending upward, indicating rising investor sentiment.
Notably, the breadth of this rally is extremely narrow, but it has not yet reached the extreme concentration seen during the internet bubble era.
Four Risk Signals: Not Triggered Yet, But the Distance is Shrinking
Goldman Sachs’ analytical framework attributes the end of historically high-valuation, high-concentration bull markets to four factors: speculative frenzy, deteriorating growth outlook, extreme expansion in stock issuance, and Fed policy tightening. Snider notes that none of these four conditions currently fully match the current environment, but each is closer to the warning line than at the start of the year.
IPO activity is warming up, putting pressure on the stock issuance side; rising input costs are compressing corporate profit margins, posing a potential threat to the growth outlook; interest rate market pricing has begun to reflect a higher probability of Fed rate hikes, although Goldman Sachs economists believe actual rate hikes are unlikely.
Snider also emphasizes that a market decline does not require extreme investor euphoria as a prerequisite, and the euphoric characteristics seen at past bull market peaks may not necessarily reappear in the same form in this cycle. This means that even if current indicators have not yet reached historical extremes, investors should not view this as a sufficient guarantee of a safety margin.
Overall, Goldman Sachs’ assessment offers a cautious but not pessimistic judgment: the euphoria level of this bull market is “getting closer” to the historical peak range, but has not yet arrived. The key support for this judgment is that the current rally still has improved earnings expectations as its fundamental backing, rather than being purely sentiment-driven. However, with momentum factors remaining strong, market concentration high, and some risk signals quietly heating up, Snider’s report is essentially a reminder to investors: the window is still open, but it is slowly closing.
Эта статья взята из интернета: How far is this U.S. stock bull market from the peaks of historical bubbles?
Related: Tesla 2026 Q1 Earnings Released, Long-Term Bets Intensify
1. The “Decency” of Profit and Cash Flow On paper, Tesla’s Q1 delivered results capable of soothing the secondary market: Core Performance: Revenue of $22.387 billion, GAAP net profit of $477 million. Margin Recovery: GAAP gross margin rebounded to 21.1%, a rare bottoming-out recovery after multiple price wars. Cash Position: Free cash flow of $1.444 billion, with cash reserves at quarter-end nearing $45 billion. Core Logic: The profit improvement wasn’t driven by economies of scale (deliveries actually declined), but by “formulaic” structural optimization. This impressive margin recovery directly impacted the secondary market, allowing investors to position themselves in real-time via TSLA Perpetual Contracts to capture trading opportunities from the volatility. 2. From Currency Tailwinds to Software Harvesting The earnings presentation attributed the margin expansion meticulously, which can be broken down…