Bitcoin Approaches the $80,000 Watershed, HYPE Shows Signs of Potential Reversal | Exclusive Analysis
If you’ve been on the sidelines waiting, I believe that patience is justified. This week is still not the time to chase longs. Whether the price can truly secure this level requires time to verify, and the risk of a “one-day trip” fakeout remains high. Before the structure is confirmed, the cost of hasty entry often outweighs the regret of missing out.
However, I also don’t want to avoid another possibility: If Bitcoin does achieve an effective breakout and holds steady this time, then these months of consolidation might be coming to an end. At that point, we will actively deploy long positions and follow the trend.
Core Trading Views Summary for This Week:
- Analysis of BTC’s Multi-Timeframe Structure (Details in Part 1)
- BTC Price Forecast and Mid/Short-Term Trading Strategy for This Week (Details in Part 2)
- In-depth Analysis of HYPE’s Hourly Structure (Details in Part 3)
- HYPE Price Forecast and Short-Term Trading Strategy for This Week (Details in Part 4)
- Last Week’s Trade Review: HYPE Short Long Position Yield ~5.77% (Details in Part 5)
Therefore, the core of this week revolves around one question – Can Bitcoin truly break through $80,000 to $81,000? Let’s break it down layer by layer, from the daily chart down to the hourly level.
1. Analysis of Bitcoin’s Multi-Timeframe Structure
1.1 BTC Daily Level Structure Analysis: (Based on price action following the low on February 6, 2026)
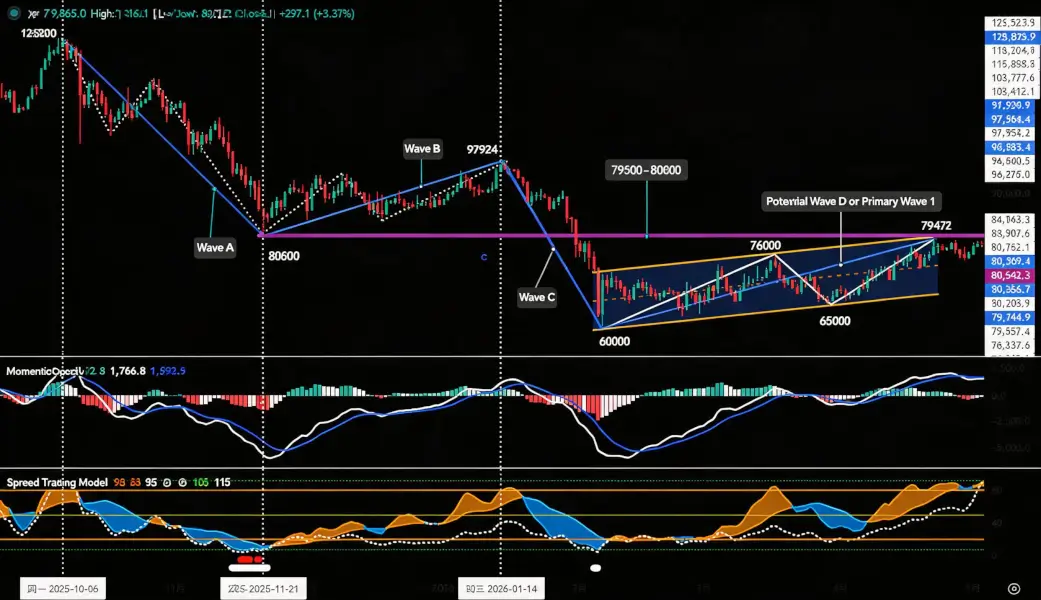
Figure 1
As shown in Figure 1, Bitcoin is currently at the critical price zone of $79,500 to $80,600 (marked in purple). This zone has become the market’s core “watershed.” The effectiveness of its resistance will directly determine the nature and subsequent direction of the rebound that started from the February 6 low of $60,000.
Here are the two core path analyses:
Path 1: Effective Breakout and Stabilization, Increasing Probability of Trend Reversal
- Trigger Condition: The price effectively breaks through and stabilizes above this zone, with upward momentum (in both price and time) continuing to expand.
- Technical Judgment: This could mean the daily-level adjustment since the October 2025 high ($126,200) ended at the February 6 low (~$60,000), and the market trend may have fundamentally reversed.
- Outlook: This rebound can be seen as the starting point of a potential Major Wave I (impulsive wave). It might be followed by a Major Wave II (corrective wave) pullback, but a high probability exists that the correction will conclude above $60,000.
Path 2: Failed Uptrend, Increasing Risk of a Bearish Continuation Pattern
- Trigger Condition: The price encounters resistance at this zone, characterized by a “one-day trip” or “fakeout” before quickly retreating.
- Technical Judgment: The nature of this rebound is more likely a Wave D bounce within a potential downtrend, rather than a trend reversal.
- Outlook: Following the bounce, a Wave E correction is expected, with a higher probability of breaking below the previous low of $60,000.
Summary: Simply put, this price zone is a litmus test for market sentiment. Holding above it opens up bullish potential, while failure likely means a deep retracement. The outcome of the tug-of-war between bulls and bears in this zone will путеводитель the core direction for the next phase and is a key reference for identifying potential shifts in market structure.
2. In-depth Analysis of BTC’s Hourly Level Structure: (Analysis based on 4-hour timeframe)
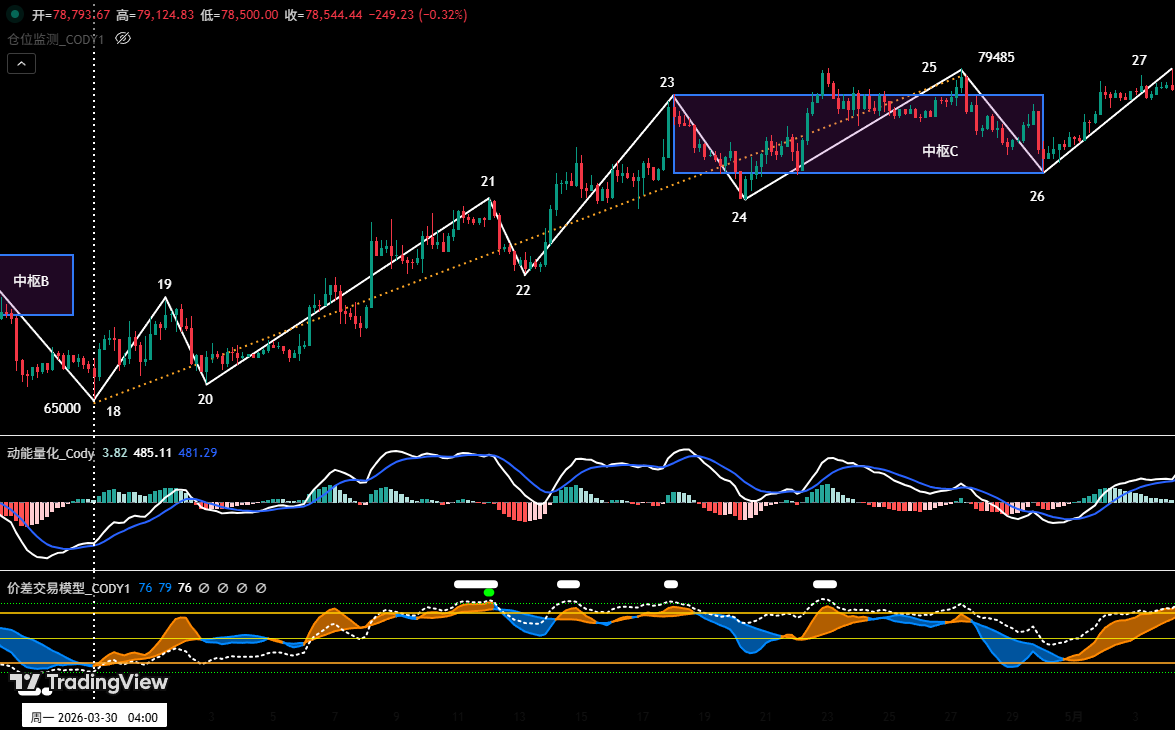
Figure 2
As shown in Figure 2, the daily-level rebound from the March 30 low of $65,000 can be subdivided into nine segments on the 4-hour chart: 18-19, 19-20, 20-21, 21-22, 22-23, 23-24, 24-25, 25-26, and 26-27. Among these, segments 23-24, 24-25, and 25-26 overlap, forming a “consolidation zone C.” Currently, the market is running the exit segment (segment 26-27).
Because consolidation zone C is a bullish consolidation zone, the forecast is that the price corresponding to endpoint 27 of the exit segment will break the previous high of $79,485 and likely challenge $80,600.
2. Bitcoin Price Forecast and Trading Strategy for This Week
1. BTC Price Forecast for This Week:
Core View: This week, the price will likely test the resistance near $80,600. Focus on whether it can effectively break the key resistance zone of $79,500 to $80,600. Although easing geopolitical tensions provide short-term upward momentum, under macro pressure and structural market contradictions, the market is more likely to exhibit a wide-range consolidation pattern here.
2. Key Resistance Levels:
- First Resistance Zone: $79,500 – $81,000 (Near the November 2025 low)
- Second Resistance Zone: $83,500 – $84,500 (Previous high-volume consolidation area for longs and shorts)
3. Key Support Levels:
- First Support Level: ~$78,500 (Near the upper rail of the consolidation zone)
- Second Support Zone: $73,500 – $75,000 (Previous important support level)
- Third Support Zone: $69,500 – $70,500 (Previous important support level)
4. Trading Strategy for This Week (Excluding unexpected news impact)
① Medium-Term Strategy:
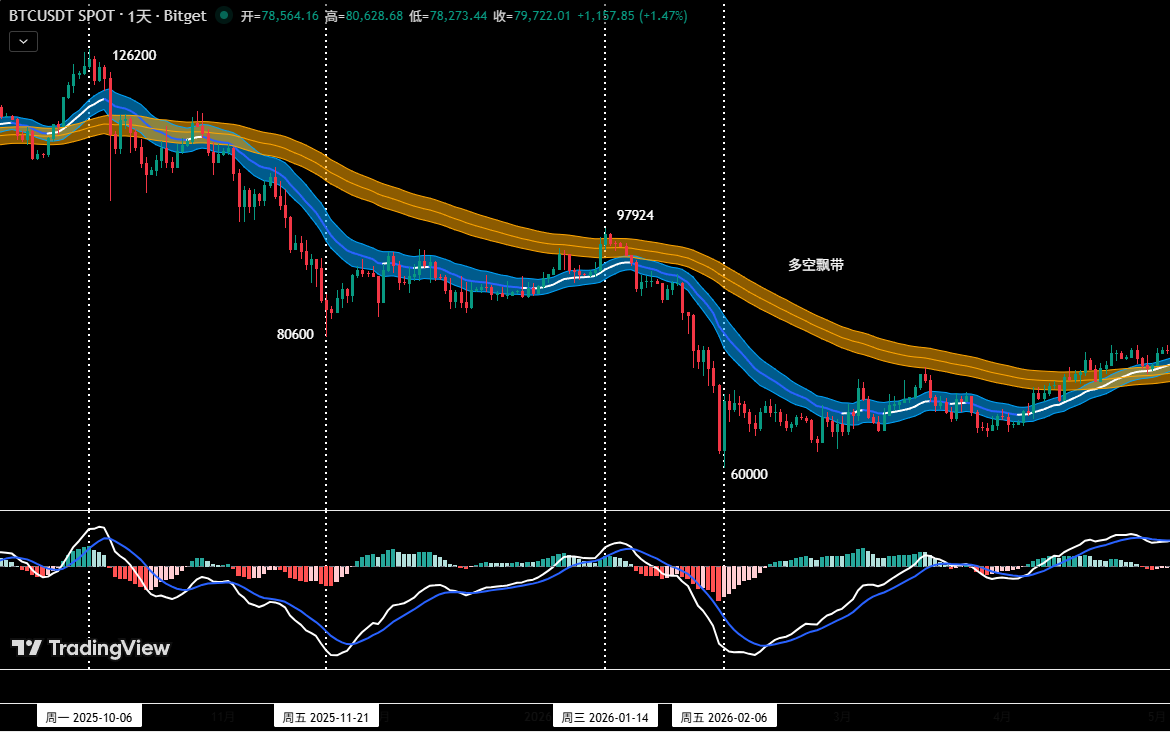
Figure 3
Position Monitoring Model: As shown in Figure 3, based on trading rules, while Bitcoin has broken the upper band of the long-short indicator but its validity is unconfirmed, the medium-term strategy is to maintain a cash position this week and wait. We recommend waiting for a clear breakout result before entering, avoiding chasing highs or selling at lows.
② Short-Term Strategy: Use 30% of capital, set stop-loss, and look for “spread” opportunities based on support and resistance levels. (Using 30-min/60-min charts as operating timeframe)
③ A/B Operation Plans: Currently, Bitcoin is about to challenge the $79,500 to $80,600 core zone, and intraday volatility will intensify. For short-term operations, to dynamically adapt to complex market changes, prudent investors should abandon subjective predictions. Instead, they should rely on objective structural analysis and quantitative model signals to prepare and strictly execute two specific operation plans (A and B) in advance.
Plan A: Effective Breakout and Stabilization. Follow the trend and go long on dips.
- Entry: When the price effectively breaks and holds above the $79,500 to $80,600 zone, combined with a bottom signal from the quantitative model, establish a 30% long position.
- Risk Control: Initial stop-loss set below $78,500.
- Exit: When the price approaches a major resistance level, combined with model signals, gradually close positions to take profit.
Plan B: Effective Breakdown of Support. Go short on bounces.
- Entry: When the price effectively breaks below support near $75,000, combined with a top signal from the model, establish a 30% short position.
- Risk Control: Initial stop-loss set above $76,500.
- Exit: When the price falls to a key support level, combined with model signals, gradually close positions to take profit.
After discussing Bitcoin, let’s talk about HYPE.
In my view, the current structure shows quite classic reversal signals – upward momentum is notably weakening, and the rebound strength is narrowing. Of course, the structure isn’t finalized yet. If it can effectively break the previous high of $45.76, then the uptrend isn’t over, and it will likely follow Bitcoin’s strength. After all, if BTC successfully holds that platform, overall market sentiment will lift, and HYPE is unlikely to be immune.
But until the breakout is confirmed, my advice is: for those already holding positions, set your take-profit levels well to protect existing profits; for those without positions, continue to wait and observe, no need to rush to chase. Let the structure speak, then we decide.
3. In-depth Analysis of HYPE’s Structure
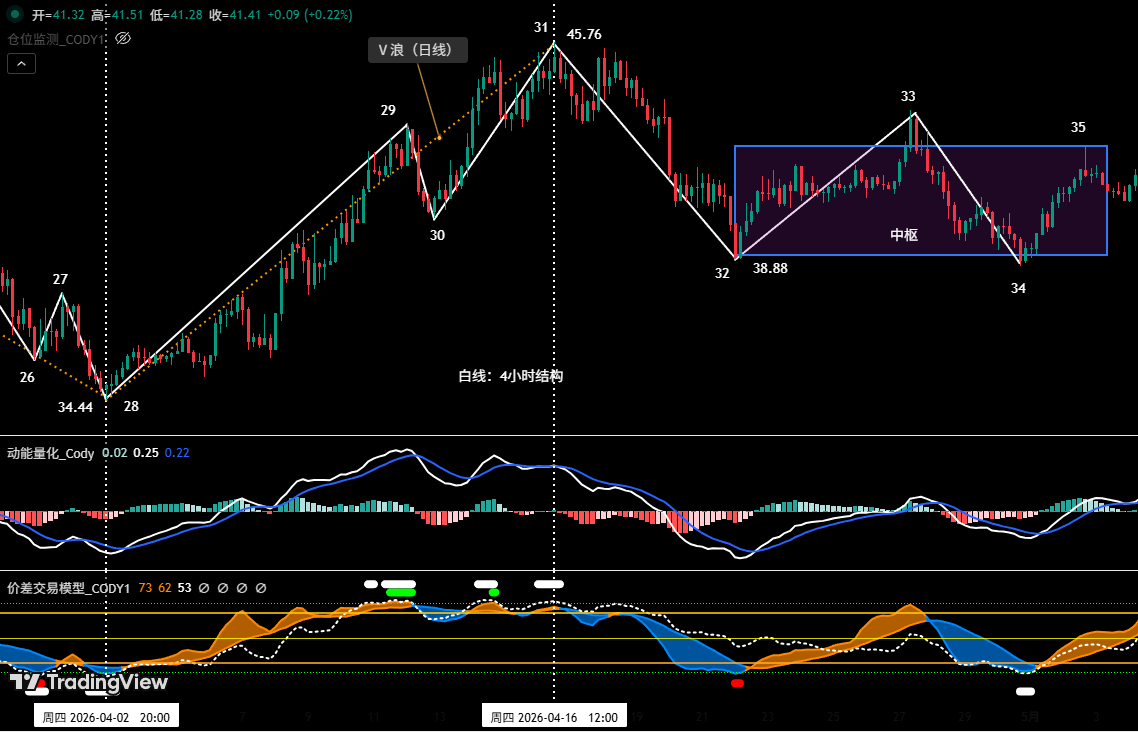
Figure 4
1. As shown in Figure 1, the corrective move from the April 16 high of $45.76 can be subdivided into four segments on the 4-hour chart: 31-32, 32-33, 33-34, and 34-35. Segments 32-33, 33-34, and 34-35 overlap, forming a “bearish consolidation zone.” Currently, the market is running segment 34-35.
2. The 4-hour chart shows HYPE’s current trend exhibiting classic reversal signals. Specifically, during the corrective segment (endpoint 32), the price broke below the previous low (endpoint 30, $40.17). Subsequently, the rebound segment (endpoint 33) failed to make a new high (i.e., break endpoint 31, $45.76). This constitutes a potential reversal structure characterized by a “correction breaking the previous low and a rebound failing to make a new high.” Therefore, technical analysis suggests that the daily uptrend starting from the April 2 low of $34.44 likely ended at the high of $45.76. The market is currently in a daily-level correction phase. If the price subsequently breaks effectively below the key support near $38, this conclusion will be further confirmed. Unless the price can effectively break and hold above the previous high of $45.76 in subsequent action, this bearish structure will be invalidated, and only then might the trend reverse.
4. HYPE Price Forecast and Short-Term Trading Strategy for This Week
1. HYPE Price Forecast for This Week:
Core View for HYPE This Week: Focus on whether the ongoing segment 34-35 can effectively break the previous high of $45.76.
2. HYPE Short-Term Trading Strategy for This Week:
- Based on the forecast that HYPE’s overall trend has turned into a “correction or consolidation,” short-term trading should adhere to the principle of “follow the trend, go short on rallies.”
- Using signals from our proprietary quantitative model, operate on the 30-min/60-min timeframe with 30% capital to capture entry opportunities.
- Entry Strategy: This week, if the segment 34-35 rebound shows signs of resistance (endpoint 35 must be below $45.76), and this coincides with top signals triggered by our two models, consider entering a short position. Position size must be controlled below 30%, strictly adhering to stop-loss rules.
5. HYPE Trade Review (04.27 – 05.03)
Рынок Validation of Last Week’s Strategy and Core Views:
- HYPE Short-Term Trade Outcome: Last week, HYPE completed one short-term long trade (1x leverage), yielding approximately 5.77%. (Details in Table 1)
- BTC Price Forecast Validation: In last week’s article, we pointed out that the current price faces dual resistance from the daily channel upper band and the $79,500 to $80,600 core zone, judging a direct breakout to be difficult. The current market action has validated our previous forecast.
1. Short-Term Trade Review: (See Table 1)

Table 1
2. Short-Term Trade Breakdown: (See Figure 5)
- Entry Strategy: First, the prior move completed a full corrective structure. Second, the spread trading model issued a strong early bottom warning signal (red and white dots in the chart). Third, the momentum quantitative model triggered a bullish divergence signal. Therefore, we established a 30% long position at $39.30.
- Exit Strategy: When the price rose near $42.5 and showed signs of resistance, the spread trading model triggered a top warning signal (green and white dots). Thus, we closed the entire position around $41.57.
- Summary: This trade successfully yielded approximately 5.77%.
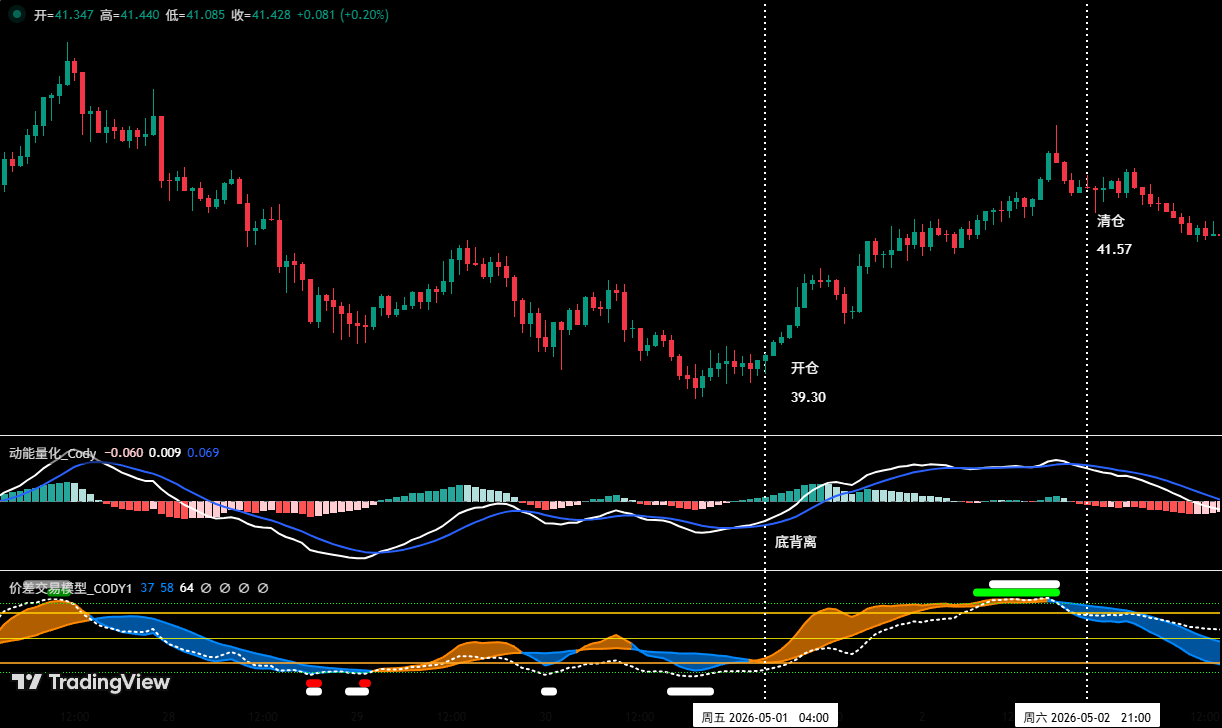
Figure 5
6. Special Reminders:
- Entry: Immediately set the initial stop-loss.
- Profit Reaches 1%: Move the stop-loss to the entry cost (breakeven point) to secure principal.
- Profit Reaches 2%: Move the stop-loss to the 1% profit level.
- Continuous Tracking: For every subsequent 1% increase in profit, move the stop-loss up by 1%, dynamically protecting and locking in profits.
Financial markets are volatile and ever-changing; all market analysis and trading strategies require dynamic adjustment. The views, analytical models, and trading strategies presented herein are based on personal technical analysis, serve solely as personal trading logs, and do not constitute any investment advice or operational basis. Рынок risk exists; invest prudently. Do not make decisions based solely on this content.
Эта статья взята из интернета: Bitcoin Approaches the $80,000 Watershed, HYPE Shows Signs of Potential Reversal | Exclusive Analysis
These questions may sound like extreme hypotheticals, but they are increasingly becoming realistic reference points for Ethereum’s protocol design. In early March, Vitalik Buterin introduced a new formulation, explicitly stating that the Ethereum community should understand itself as part of the “sanctuary technologies” ecosystem: these free, open-source technologies enable people to live, work, communicate, manage risk, accumulate wealth, and collaborate towards common goals, while maximizing their ability to withstand external pressure. This formulation may seem like an abstract upgrade in values, but when viewed in the context of Ethereum’s recent protocol evolution, it actually corresponds to very specific engineering problems: As block building becomes increasingly specialized, transaction ordering rights become more centralized, and public mempools become more vulnerable to sandwich attacks and front-running, how can Ethereum continue to uphold the…


