At the $75,000 Gamma Threshold, Both Bulls and Bears Await a Signal
Original Compilation: AididiaoJP, Foresight News
Bitcoin has rebounded to nearly $76,000, primarily driven by the return of ETF inflows and a recovery in spot buying. Short positions remain crowded, funding rates continue to be negative, while pressure in the options market has eased—all indicating an improving market environment, but it’s still too early to form firm conviction.
Основные выводы
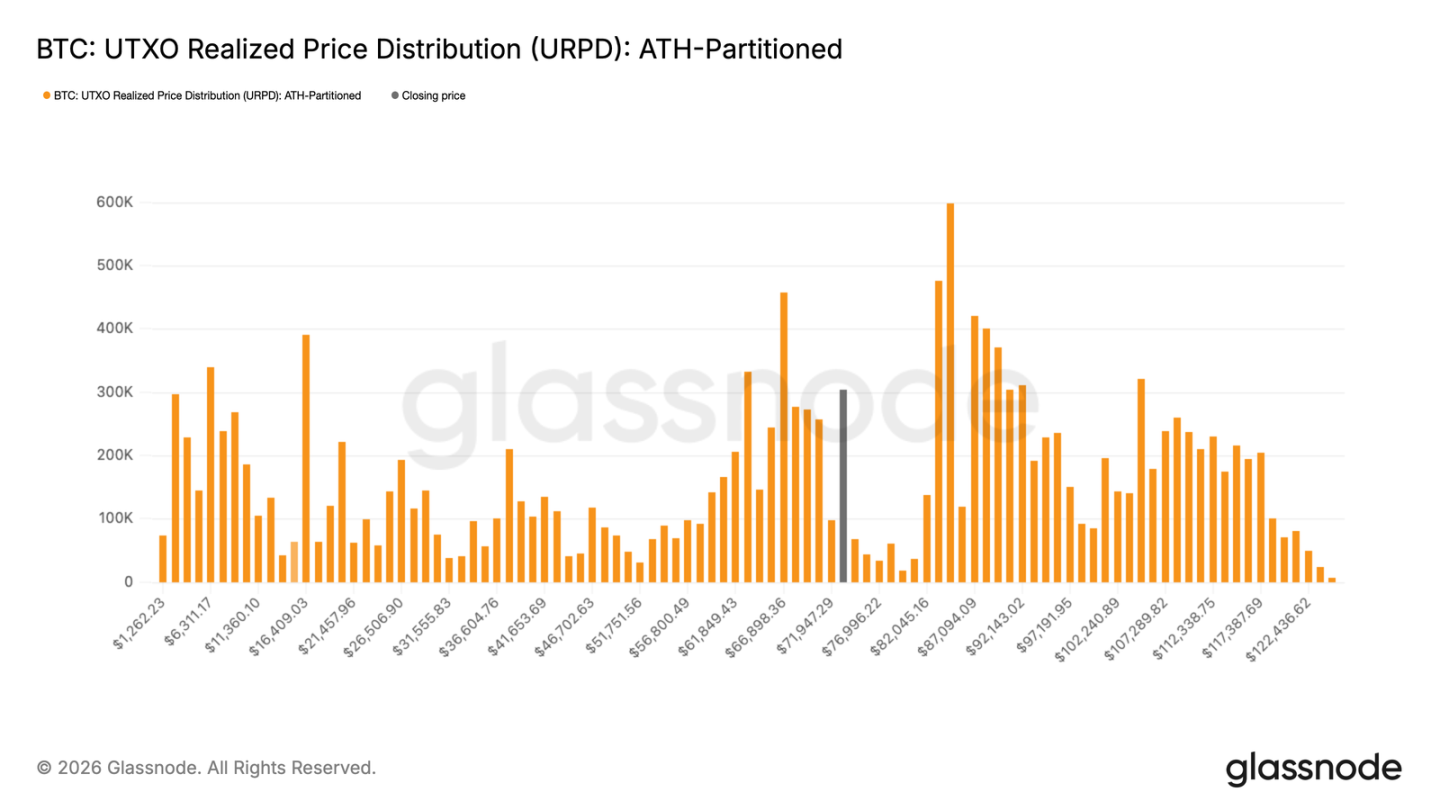
- Bitcoin has broken through $70,000 and entered the “air pocket” between $72,000 and $82,000. According to the URPD metric, there is almost no on-chain resistance until approaching the upper bound near $82,000, where significant selling pressure is expected.
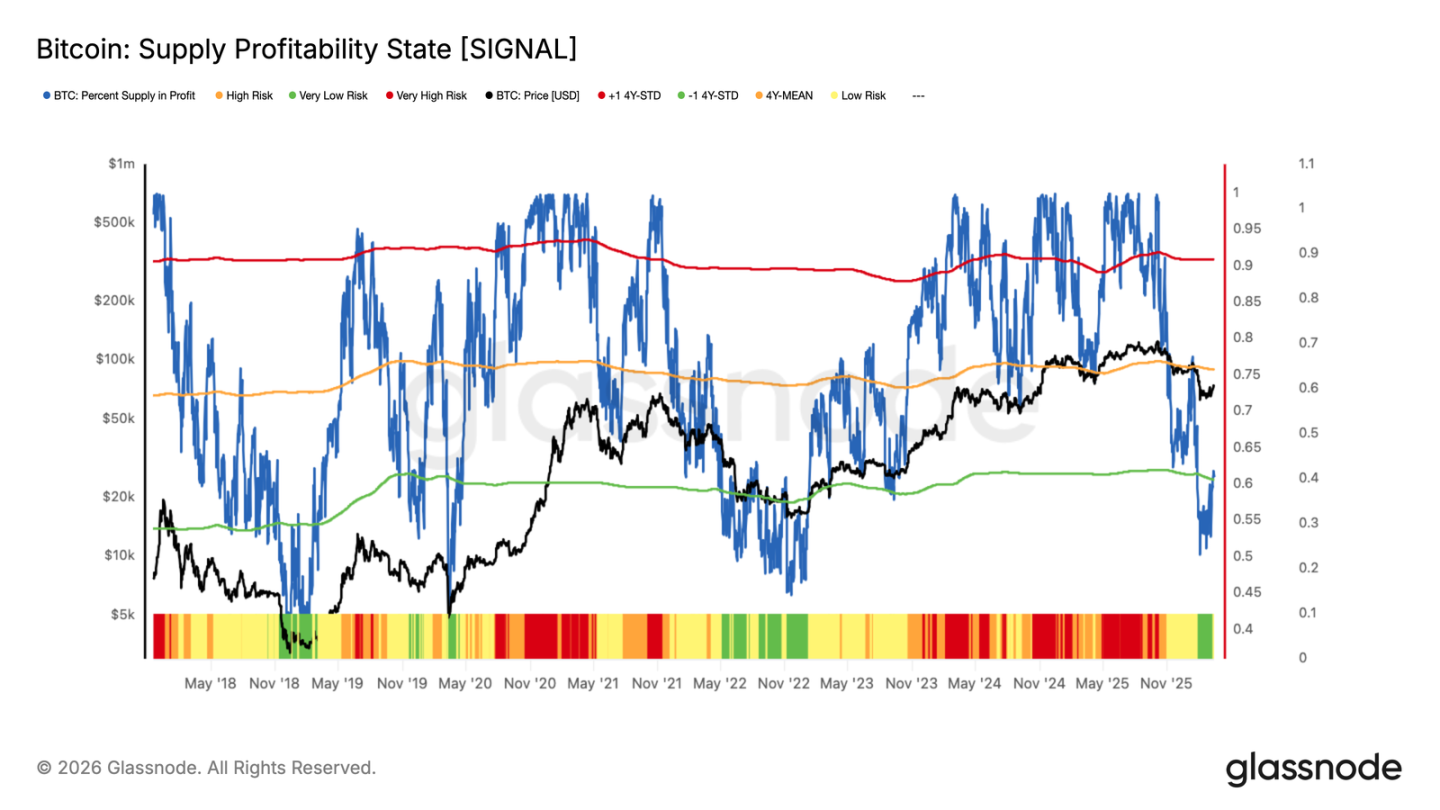
- The “Percent Supply in Profit” has recovered to around 60%. Historically, this level often corresponds to exhaustion after the first rebound from a cycle bottom. To confirm a true bull market, this indicator needs to firmly hold above 75%.
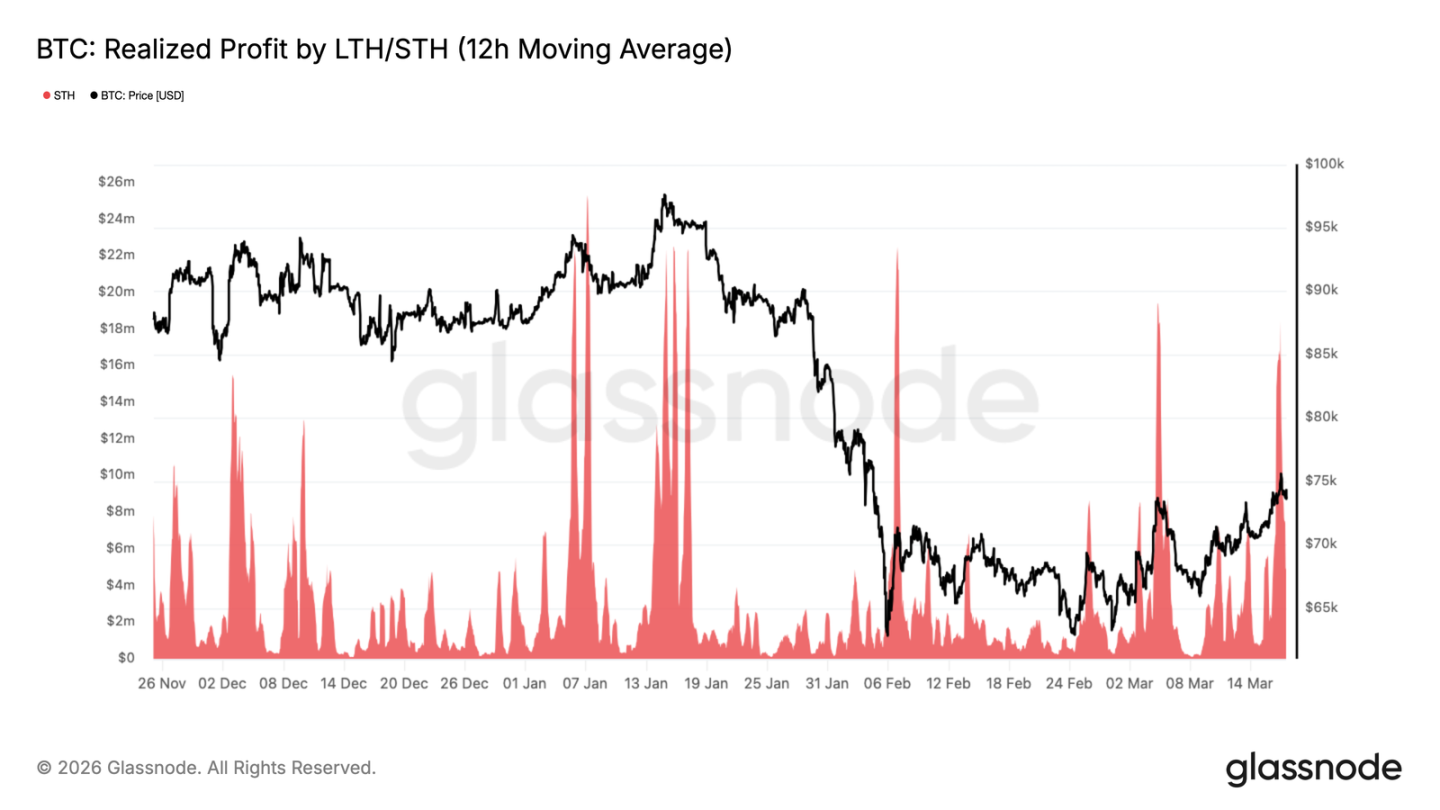
- As the price approached $74,000, the “Short-Term Holder Realized Profit” surged to $18.4 million per hour, mirroring the situation in February—short-term holders continuously selling into the rally. The key now is whether the market can absorb this selling pressure above $70,000, which is crucial for a potential push towards $78,000 to $82,000.
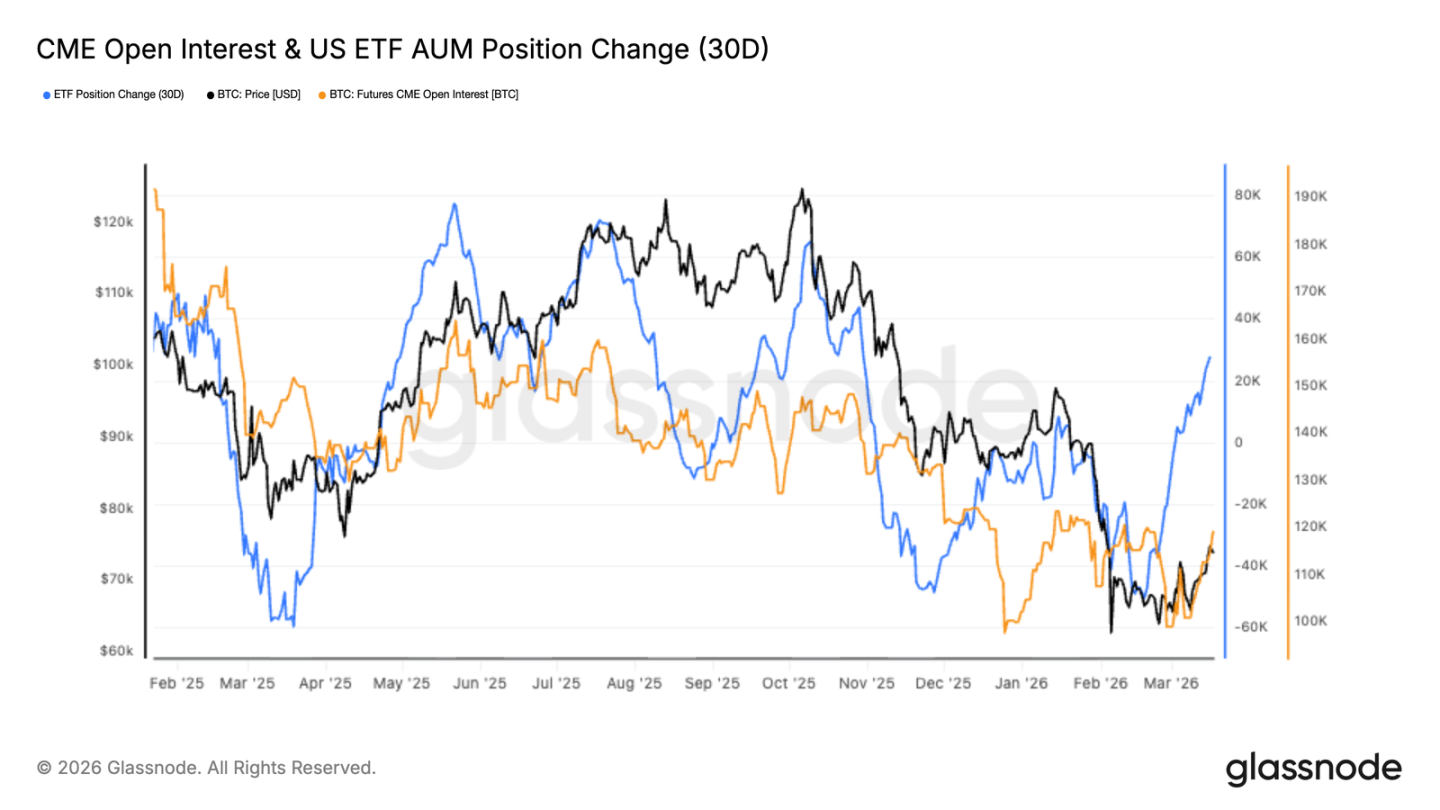
- Over the past month, ETF inflows have significantly recovered, indicating a return of institutional demand and a market once again driven by spot buying.
- Open interest in CME futures remains low, suggesting this rally is primarily fueled by spot purchases rather than leveraged buildup.
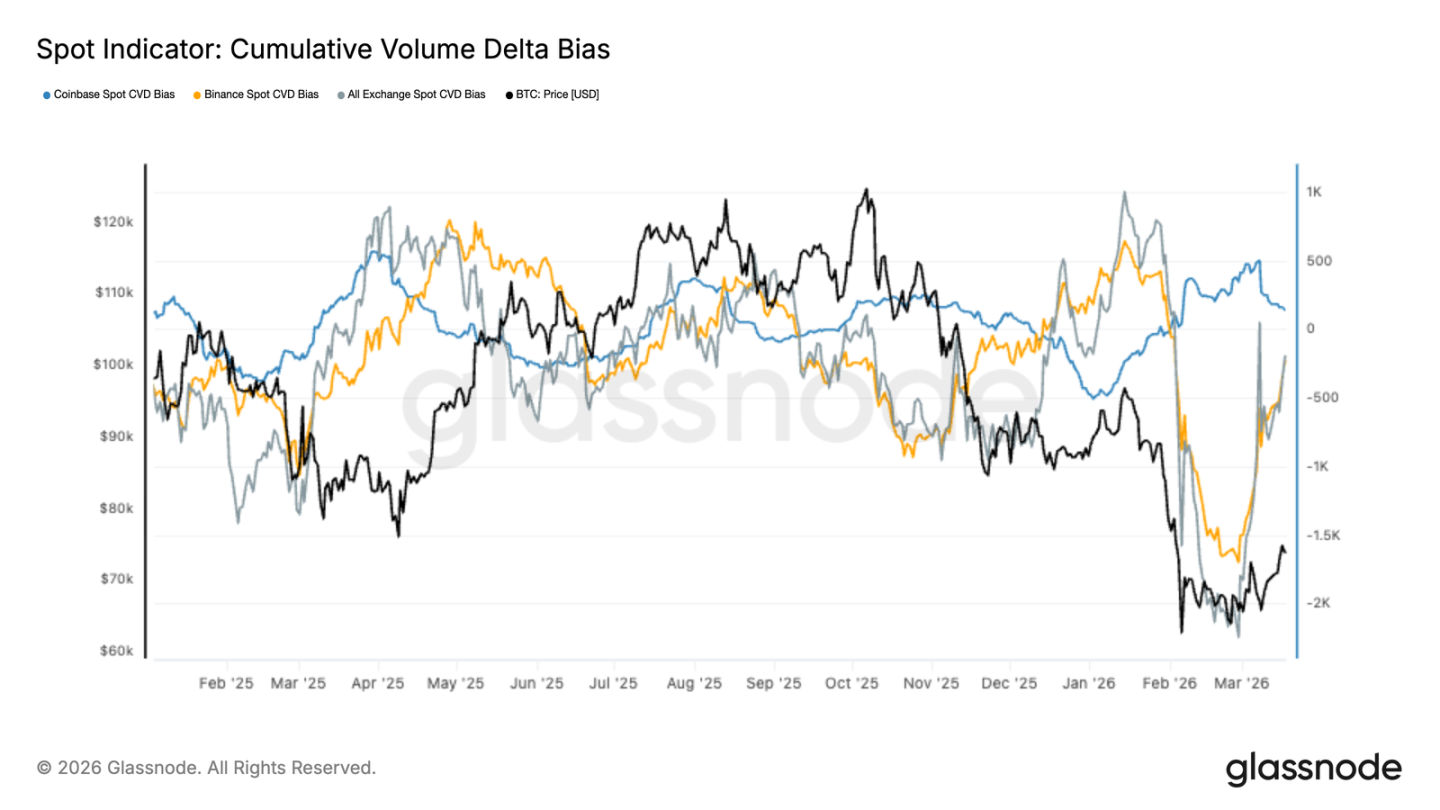
- The “Spot Cumulative Volume Delta” across major exchanges has turned upward, signaling that the previous sustained selling pressure has shifted to new accumulation.
- Spot activity on Coinbase has stabilized and warmed up—often a precursor to institutional re-entry. Selling pressure on Binance has also noticeably weakened, with the intense selling momentum seen during the decline largely gone.
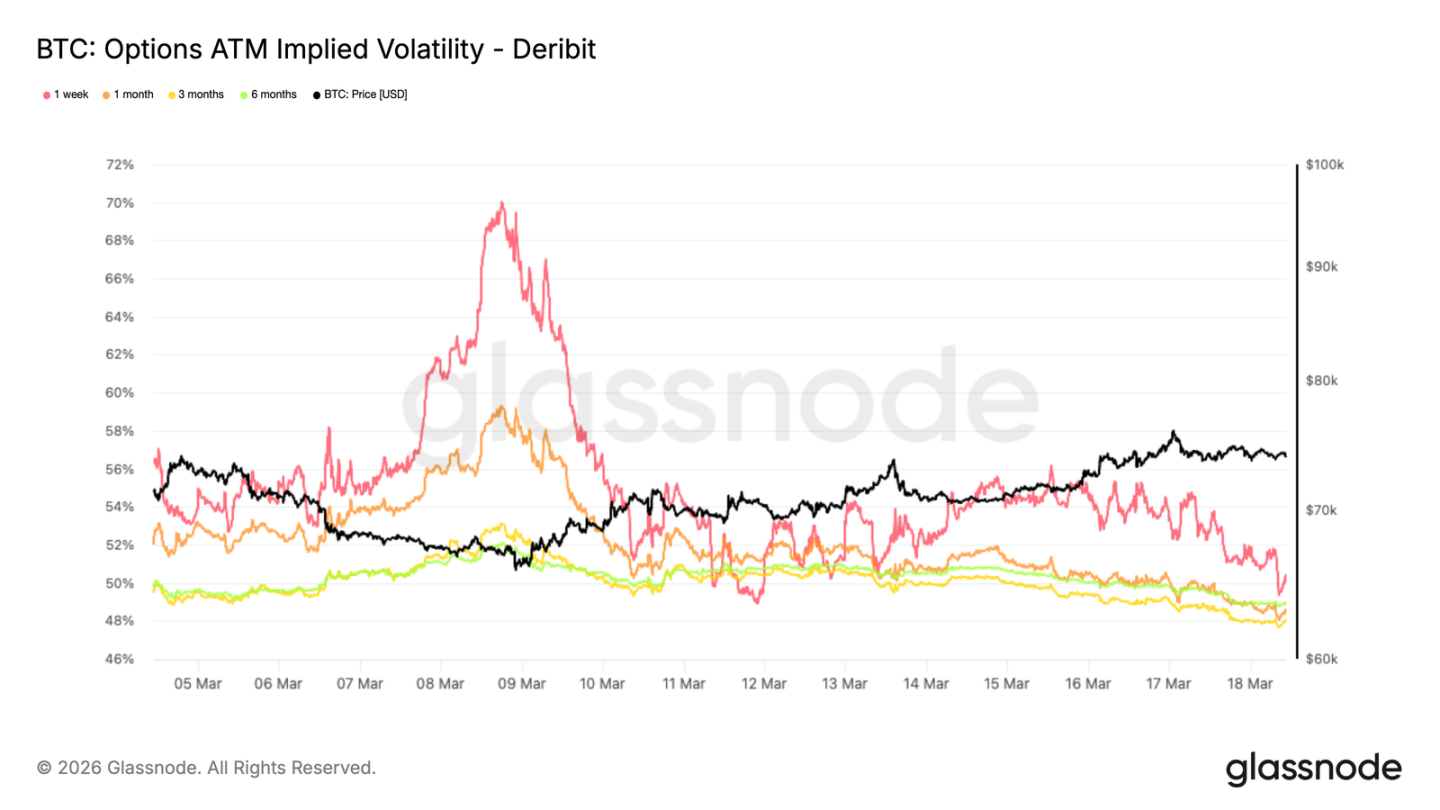
- Implied volatility across all tenors is declining, indicating reduced hedging demand and a return to normalcy.
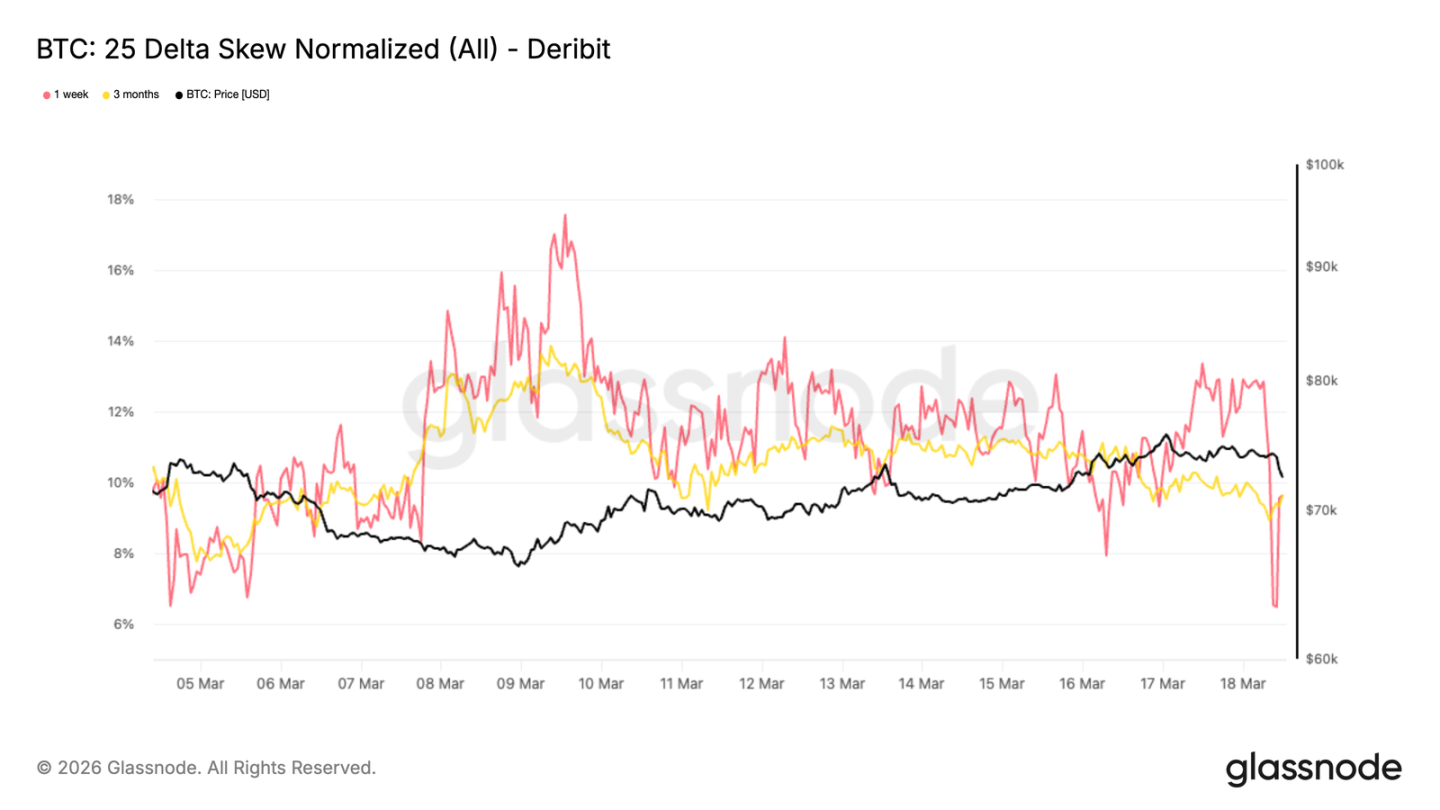
- The options skew indicator has turned slightly positive, suggesting some positioning for upside and improving sentiment.
- Рынок makers’ Gamma exposure is near neutral, meaning options are unlikely to amplify market volatility in the short term.
On-Chain Data Analysis
Finally Breaking Out of the Congestion Zone
After several weeks of struggle, Bitcoin has finally stabilized above $70,000 and is now around $74,000, decisively breaking out of the trading range from February to March. The URPD metric clearly shows this—it indicates at what prices people bought Bitcoin; where many bought becomes support or resistance.
The data shows a massive accumulation of coins between $59,000 and $72,000, primarily from positions established in February and March 2026. The price has now moved above this dense congestion zone. Further up, the zone between $72,000 and $82,000 is an air pocket with very few previous buyers, offering little resistance on the way up. This breakout occurred amidst geopolitical uncertainty and resilient external markets, suggesting investors currently view macro headwinds as temporary. Regardless of the long-term path, the short-term outlook likely involves consolidation within this $72,000 to $82,000 range.
A Single Rebound Doesn’t Prove Anything
Although it broke $70,000 and entered the $72,000 to $82,000 air pocket, one rally does not indicate a structural reversal. To gauge the market’s true health, we need to look at profitability—the “Percent Supply in Profit” metric is useful here, tracking the proportion of Bitcoin currently in a profitable state.
Historically, moving from a bear market bottom to the early stages of a bull market, this indicator typically climbs from below 60% (around -1 standard deviation) to the long-term average near 75%. This rally has pushed it to around 60%, a level that historically often marks exhaustion after the first rebound. A firm hold above 75% would suggest a real potential shift into a bull market; consolidation at current levels would align with the old script of a bear market rally.
Watching How the Market Digests Selling Pressure
Beyond looking at profitability, another crucial perspective is observing how the market absorbs profit-taking—when prices rise, some will always want to sell. If recent buyers sell, but the price isn’t pushed back into the $59,000 to $72,000 congestion zone, the odds of moving higher increase significantly. This week, as the price surged above $74,000, the 12-hour moving average of “Short-Term Holder Realized Profit” spiked to $18.4 million per hour, identical to February—back then, selling emerged immediately upon touching $70,000, preventing a breakout.
This is typical of early rebounds in a bear market: recent buyers lack conviction and tend to take profits quickly. Over the coming weeks, if the market can withstand this selling pressure and hold firmly above $70,000, the likelihood of a push towards $78,000 (the realized price mean) or even $82,000 (the upper bound of the air pocket) grows.
Off-Chain Data Analysis
Institutions Are Quietly Stepping Back In
Bitcoin’s rebound coincides with a significant recovery in U.S. spot ETF allocations—the 30-day holdings change has turned positive, reversing the previous outflow trend. This indicates genuine institutional demand is returning, with capital once again flowing into spot products.
Simultaneously, open interest in CME futures remains depressed, having only just halted its decline. This rally is primarily driven by spot buying, not leveraged speculation. Historically, this structure is healthier: prices are pushed up by real capital, not a leverage-fueled bubble.
ETF assets are growing while futures open interest remains stagnant—this suggests institutions are only beginning to re-enter. If CME open interest starts rising later, it would signal strengthening conviction and a more sustainable uptrend.
Spot Buying Has Returned
The “Spot Cumulative Volume Delta” has notably improved recently, with Binance now also shifting to net buying.
This inflection point aligns with Bitcoin’s rebound from the $60,000 lows, confirming this rally is supported by real capital, not purely derivative-driven. Coinbase’s Cumulative Volume Delta has also stabilized and turned upward—this platform typically represents institutional activity, indicating accumulation has resumed.
Data from major exchanges is improving, suggesting market depth is recovering and buyers are gaining conviction. While not yet euphoric, the market has shifted from distribution to accumulation, with the spot market once again providing a price floor—a key ingredient for a sustainable rebound.
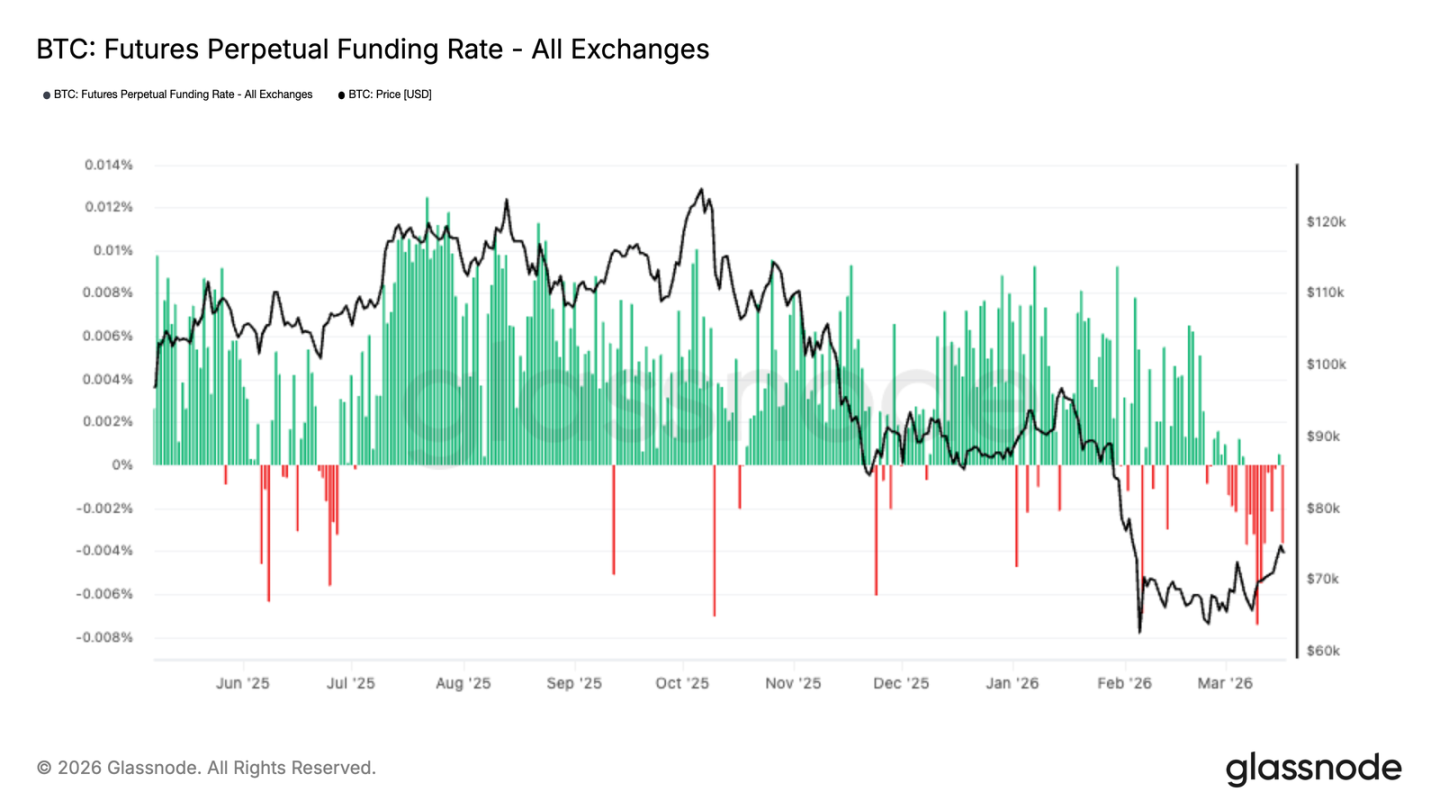
Funding Rates Show: Everyone Loves to Short
Over recent weeks, perpetual swap funding rates have fallen into negative territory—this indicates overwhelming bearish sentiment in the derivatives market. This pessimistic mood accumulated during Bitcoin’s consolidation between $60,000 and $70,000, with leveraged players generally skeptical of further upside.
Interestingly, the breakout above $74,000 occurred precisely against this backdrop of persistently negative funding. What does this imply? It suggests at least part of this rally is driven by short covering, not aggressive long buying.
This situation often indicates shorts are already crowded, ripe for a potential short squeeze. Price rises trigger short liquidations, which can further fuel the rally. While a short-term positive, for a sustained trend to emerge, funding rates need to normalize, restoring a balance between longs and shorts.
ATM Implied Volatility Retreats
Bitcoin’s volatility shock is subsiding. One-week implied volatility has dropped from around 56% at the start of the week to about 50% now, with longer tenors also down roughly 3 percentage points.
This indicates traders are less tense than before; the wave of volatility from market panic has passed. Declining implied volatility typically signals a transition from a stressed state to a relatively stable period.
The signal is clear: participants are gradually unwinding panic hedges. We’ve observed significant closing of downside protection, contributing to the drop in implied volatility and also providing a tailwind for the rebound. The market is moving towards a more balanced state. In an environment of relatively light spot and derivatives volume, options hedging can become a significant price influence—currently, the path of least resistance appears upward.
25 Delta Skew Trending Towards Neutral
Following the normalization of implied volatility, skew is also adjusting. The 25-delta skew remains negative, around -10% across tenors, down 4 to 7 percentage points from recent highs.
Negative skew means put options are still more expensive than calls—indicating continued demand for protection, with market makers reluctant to sell downside volatility too cheaply.
However, skew is slowly moving towards neutral. This shift suggests demand for downside hedging is beginning to wane, and defensive positioning is decreasing.
In other words, put options are becoming relatively less expensive. This adjustment often occurs when markets start opening up to upside potential, but macro uncertainty persists and sentiment remains cautious.
The current skew state indicates a market transitioning from panic protection to a more balanced options structure, while also preparing for potential tactical rebounds.
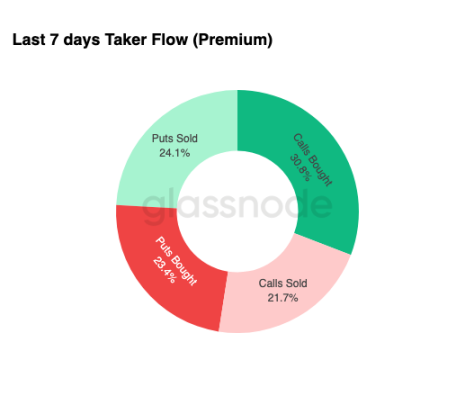
Options Flow Begins to Warm Up
Sentiment shifts are also visible in options trading. Recently, delta-positive trades accounted for 54.9%, with long call purchases making up 30.8%—traders are once again using call options to position for upside, given their limited downside risk.
Simultaneously, we’ve seen significant closing of downside protection. When traders close these positions, market makers must buy back their hedges, providing supporting buy-side flow.
These are typical characteristics of a transition phase—participants are positioning for a rebound but maintaining some defensive posture, resulting in a cautiously optimistic overall stance.
Whether this is a structural shift or just short-term speculation remains to be seen.
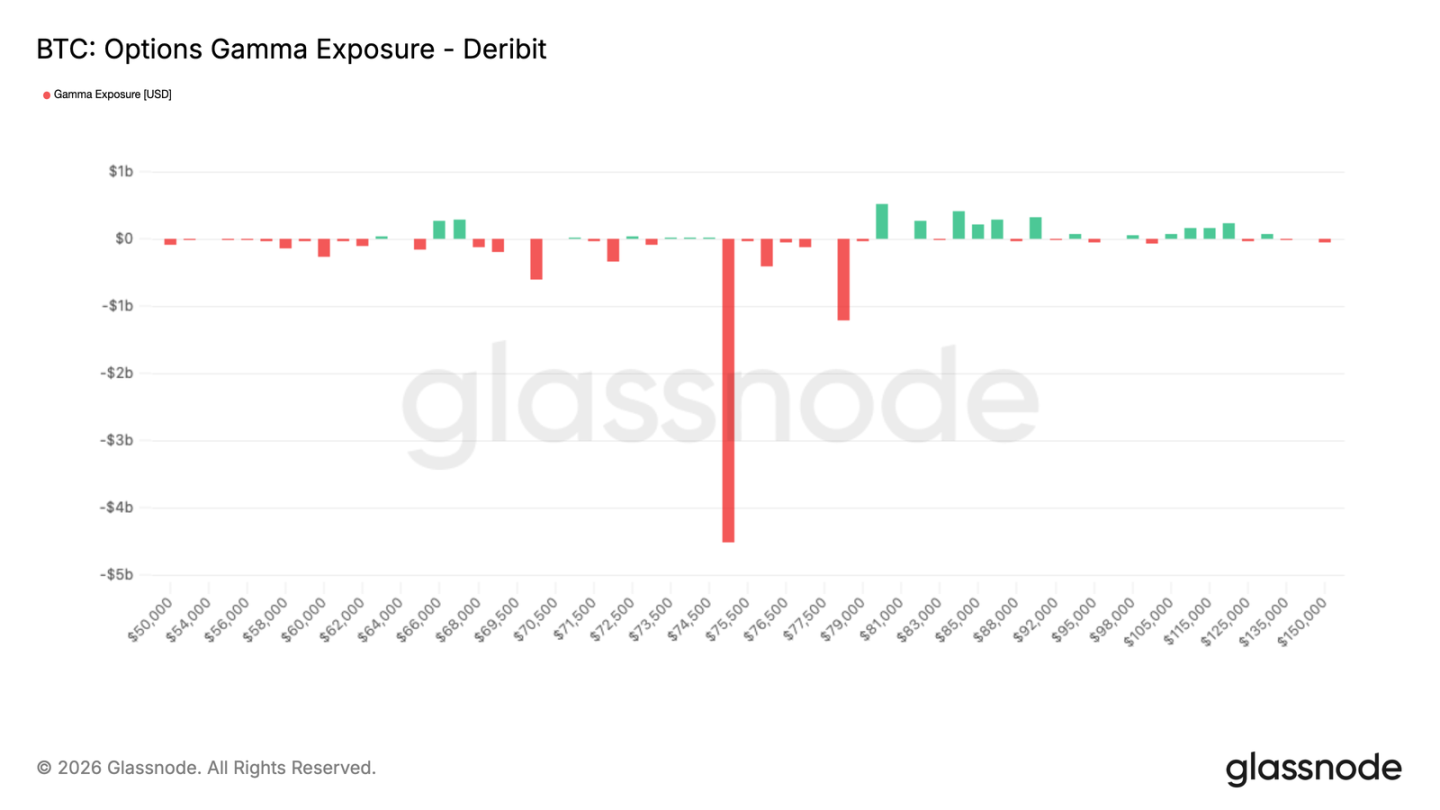
Negative Gamma Concentrated at $75,000
Finally, monitoring the most critical metric: market makers’ Gamma exposure. In thin trading conditions, market makers’ hedging activities can easily magnetize price towards key strike levels.
Currently, the only significant level is $75,000—where approximately $4.5 billion in negative Gamma is concentrated. With Bitcoin consolidating just below this level, a slight move upward could trigger market maker buy-side hedging, potentially pushing price towards $78,000+.
The $75,000 level remains crucial until the March options expiry—as $3.9 billion of that $4.5 billion expires this month. Once the quarterly expiry passes, market maker hedging flows will unwind, potentially making further upside less smooth, possibly leading to consolidation or a pullback as the market refocuses on macro narratives.
Conclusion
Bitcoin’s rebound is approaching $75,000, supported by increasingly solid fundamentals—ETF inflows returning, Cumulative Volume Delta improving, with both institutions and retail re-entering the market. The market has shifted from a previous “distribution mode” to an “accumulation mode,” building a more stable foundation for prices.
On the other hand, the derivatives market remains defensive. Persistently negative funding rates indicate crowded short positions—which could ironically fuel further upside through short covering. The options market is also stabilizing, with declining volatility and a slightly positive skew, suggesting improving sentiment, though not yet reaching speculative frenzy. Overall, there is room for short-term upside, but for a sustained trend to emerge, continued capital inflows and a recovery in leverage and conviction are necessary.
Эта статья взята из интернета: At the $75,000 Gamma Threshold, Both Bulls and Bears Await a Signal
Compiled by|Odaily; Translator| Ethan(@ethanzhang_web 3) Editor’s Note: Over the past four months, Bitcoin has almost established a fixed rhythm—every time the U.S. stock market opens, it faces a wave of significant selling pressure. It rises during Asian hours, continues its upward trend in Europe, but quickly falls back as soon as New York opens. Traders call it the “10 AM Smash.” This force acts like an invisible structural headwind, repeatedly liquidating leveraged positions, dampening market sentiment, and gradually wearing down investors’ patience. However, when the lawsuit documents targeting Jane Street were officially made public, this months-long rhythm was suddenly broken. Is this just a coincidence, or a signal of deeper structural changes? How did the entire process unfold? Odaily provides a full compilation below. ——————Divider—————— The most powerful trading firm…


