Stop Relying Solely on Lagging Data, Use ETF Premium Rates to Seize Trading Opportunities
Since the approval of spot ETFs for BTC and ETH, the daily ETF fund inflows and outflows have become a core indicator for many traders to gauge the market.
The logic is simple: net inflows indicate institutional buying and bullish sentiment; net outflows indicate institutional selling and bearish sentiment.
But the problem is, the ETF data we see every day is the result from the previous day.
By the time the data is released, the price has often already reacted.
So, is there any way to predict in advance whether today’s ETF will have net inflows or net outflows?
Yes, the answer is the ETF premium/discount rate.
It’s not difficult to verify this pattern; reviewing the soon-to-end January 2026 is the best sample.
As of January 28th, there were 18 trading days in the U.S. stock market.
Statistics show that the premium index on Coinbase remained in positive territory for only two days, while it was in negative territory (at a discount) for the remaining 16 days.
Corresponding ETF fund flow data shows that 11 of those 16 days ultimately recorded net outflows.
Especially from January 16th to 23rd, the discount rate continuously fell below -0.15%, corresponding to over $1.3 billion in net weekly outflows from the ETF market, with BTC’s price dropping from a high of $97,000 to around $88,000.
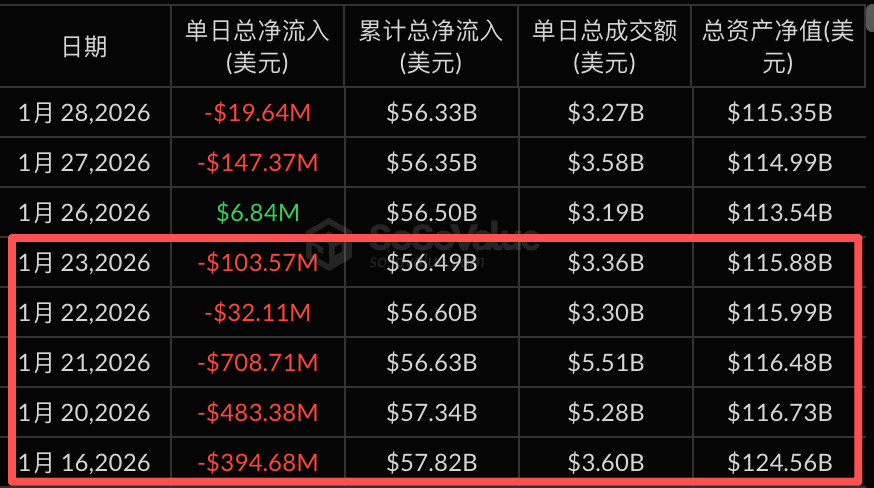
Data source: sosovalue
Let’s take a longer-term view.
From July 1, 2025, to January 28, 2026, there were a total of 146 trading days.
- Negative premium/discount rate occurred for 48 days, corresponding to net outflows for 39 days, with an accuracy rate of 81%.
- Positive premium rate occurred for 98 days, corresponding to net inflows for 82 days, with an accuracy rate of 84%.
This is the value of the premium/discount rate—it allows you to see where the money is flowing earlier than most.
What is the Premium/Discount Rate?
We’ve been talking about the premium/discount rate, but what exactly is it?
Let’s use an analogy.
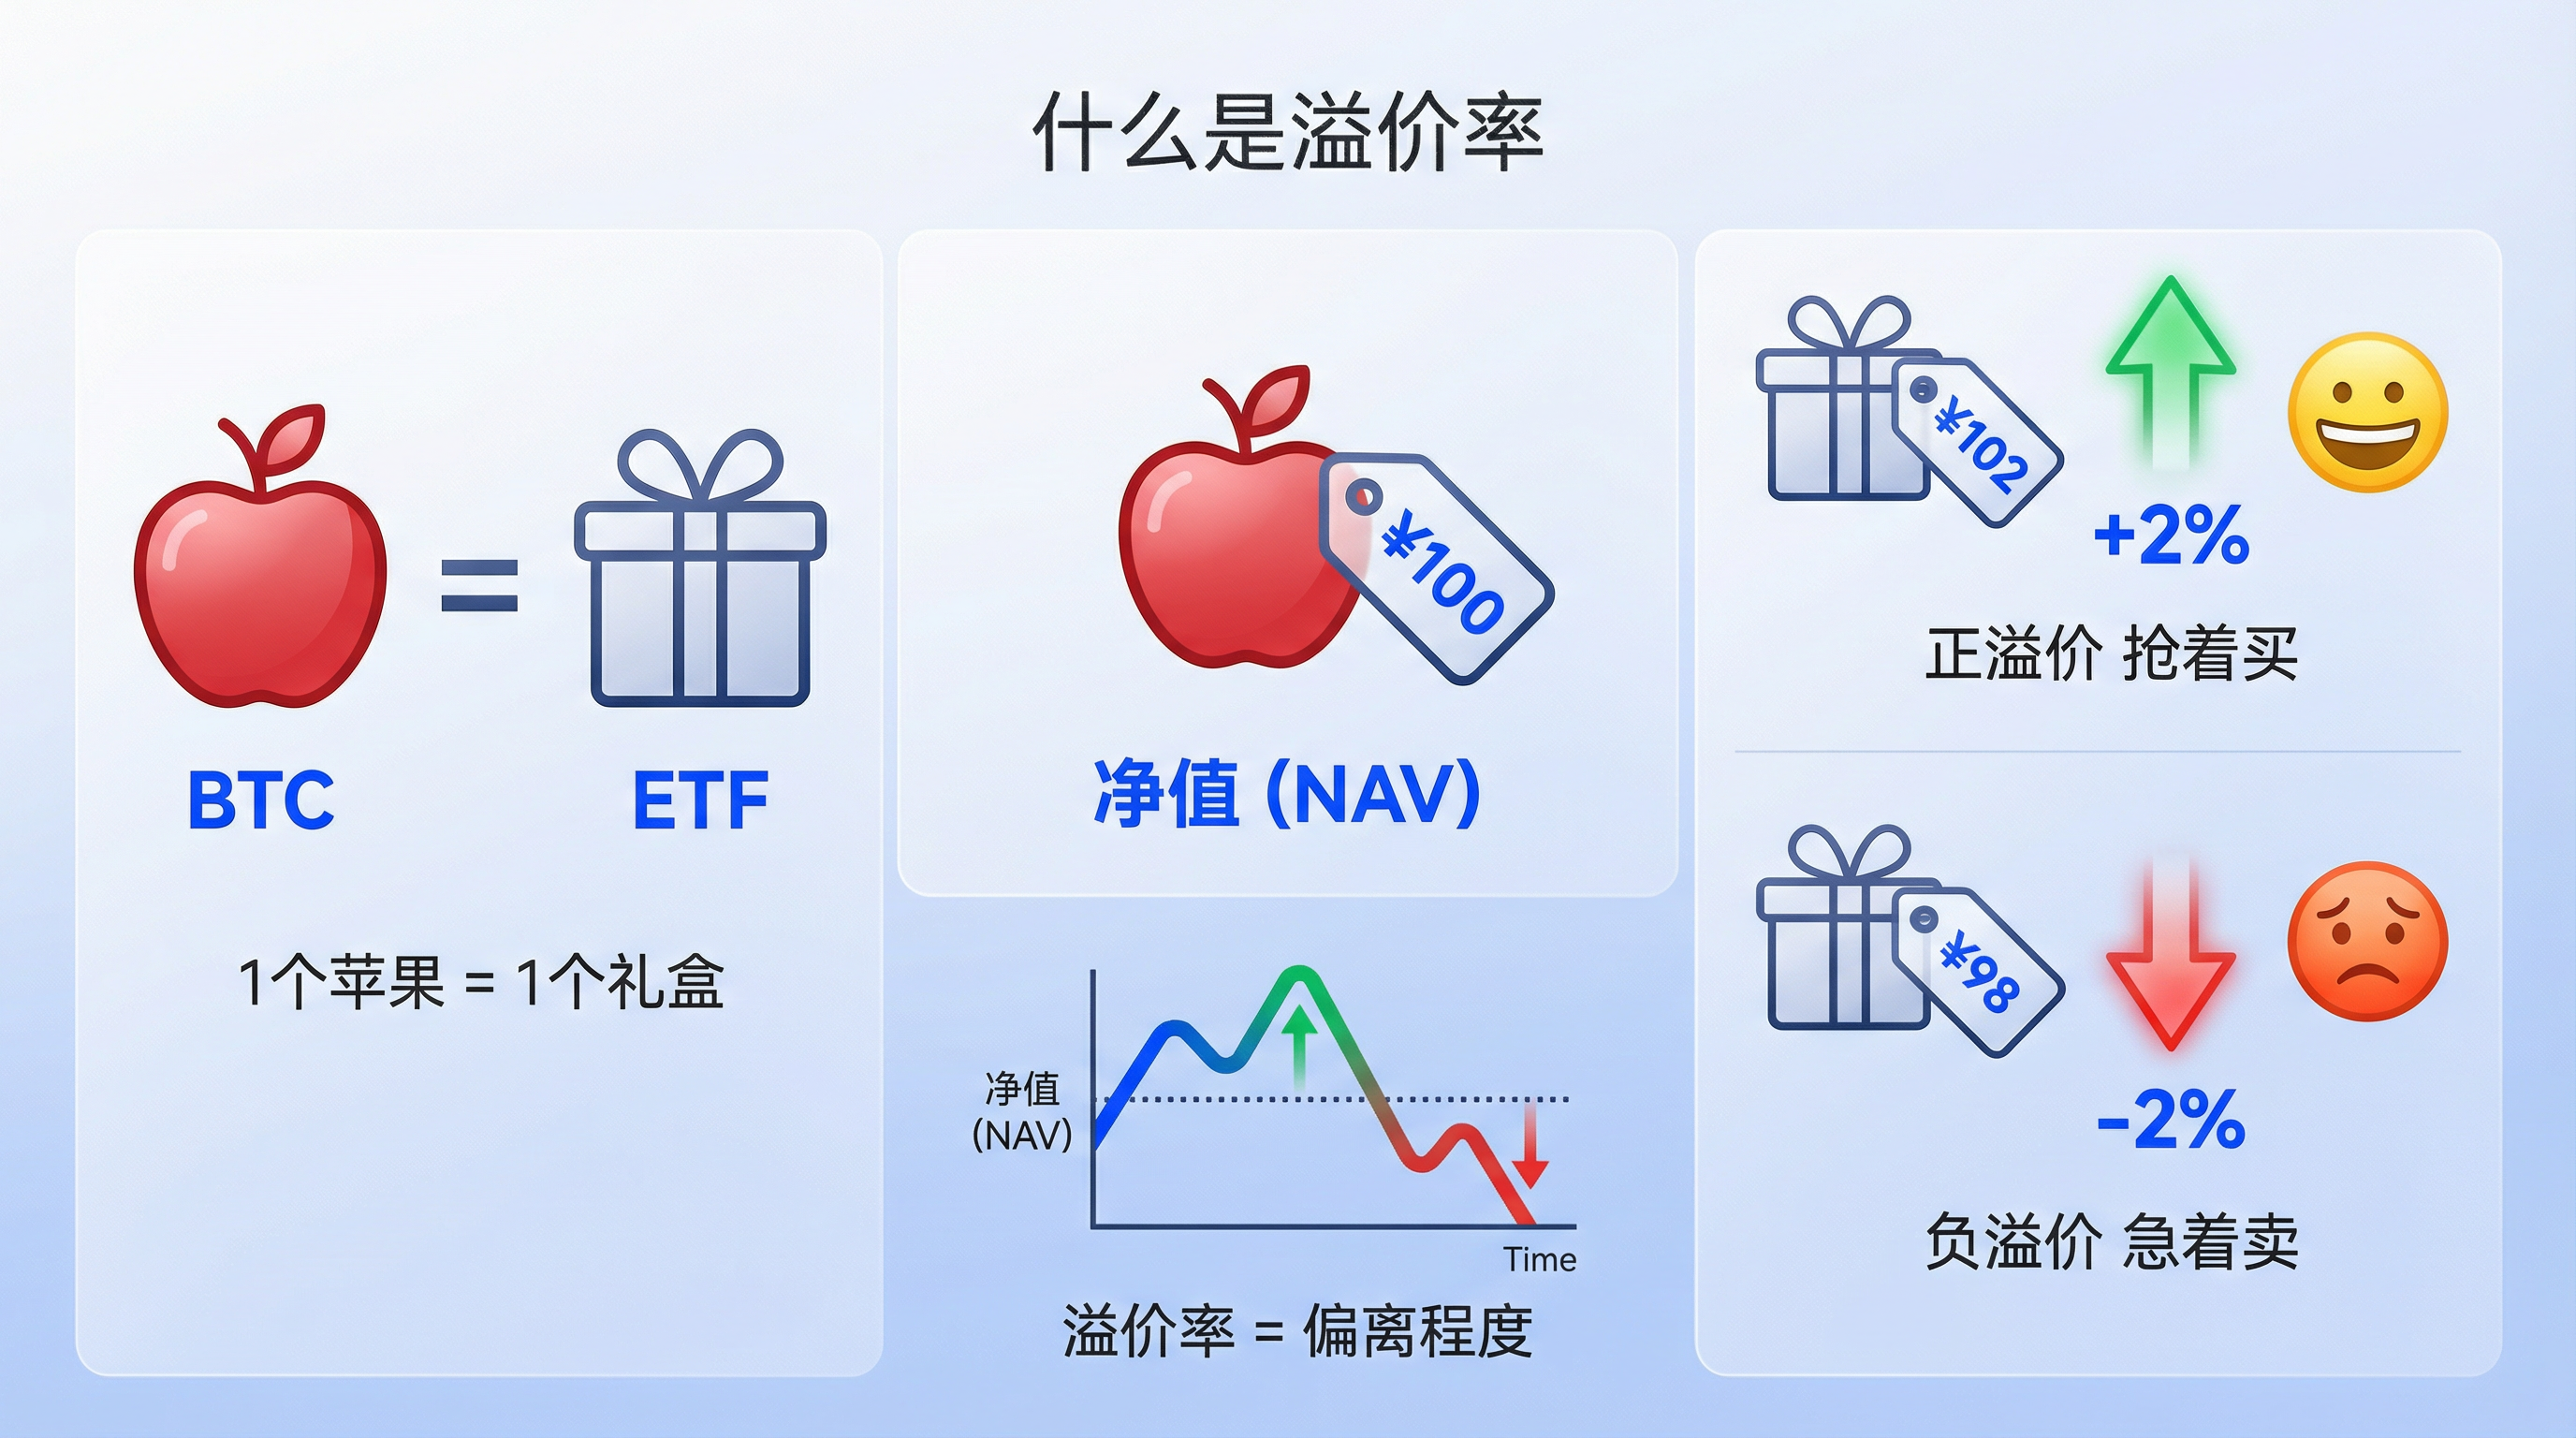
BTC is like loose apples in a wet market, while a BTC spot ETF is like a packaged apple gift box in a supermarket, each containing one apple.
An apple sells for $100 in the wet market; this is the Net Asset Value (NAV).
The price of the apple gift box in the supermarket depends on supply and demand.
If many people want to buy it, the box price gets bid up to $102. This is a positive premium rate, a premium of +2%.
If many people want to sell it, the box price drops to $98. This is a negative premium rate (a discount), a rate of -2%.
The premium/discount rate reflects the degree to which the ETF’s market price deviates from BTC’s real-time price.
A positive premium indicates optimistic market sentiment, with everyone rushing to buy.
A negative premium (discount) indicates pessimistic market sentiment, with everyone rushing to sell.
The Relationship Between Premium/Discount Rate and ETF Inflows/Outflows
The premium/discount rate is not just a market sentiment indicator; it also becomes a key driver of fund flows.
The key player here is the Authorized Participant (AP), which you can think of as a privileged arbitrageur.
The AP’s core logic is risk-free arbitrage: they can create and redeem ETF shares in the primary market and also buy and sell them in the secondary market.
Whenever a price discrepancy appears, they will arbitrage it.
When a positive premium rate appears (the gift box is more expensive than the apple), APs will buy BTC in the primary market, package it into ETF shares, and then sell those shares in the secondary market to profit from the difference. In this process, BTC is bought, resulting in net inflows.
Conversely, when a negative premium rate (discount) appears (the gift box is cheaper than the apple), APs will buy ETF shares in the secondary market, redeem them for the underlying BTC, and then sell the BTC to profit from the difference. In this process, BTC is sold, resulting in net outflows.
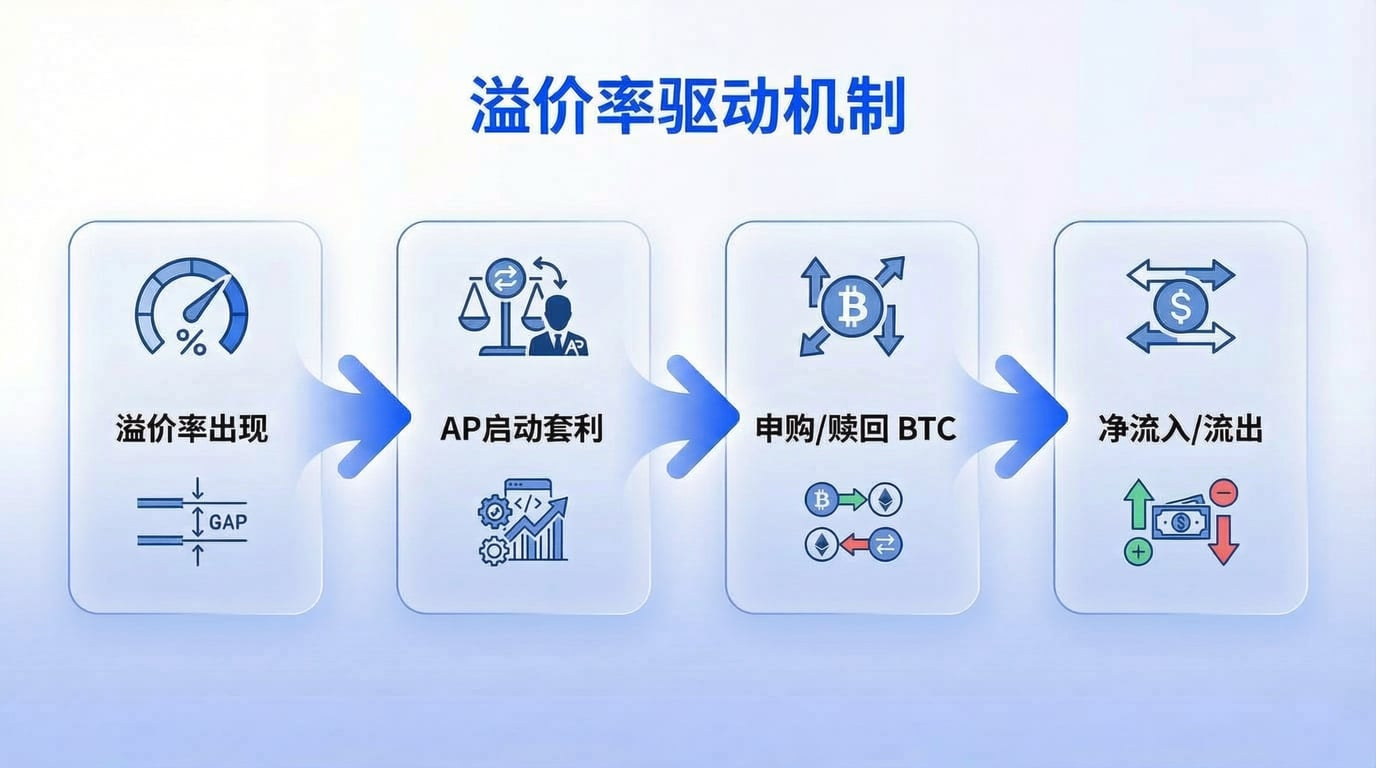
So the logical chain is:
Premium/Discount rate appears → APs initiate arbitrage → Creation or redemption occurs → Net inflows or outflows are formed.
The ETF fund flow data we see daily is published the next day after settlement.
The premium/discount rate is real-time; the fund flow data is lagged.
This is why the premium/discount rate can give you an edge over the market.
How to Apply the Premium/Discount Rate
Now that we understand the principle behind the premium/discount rate and ETF net flows, how should we apply it to our individual trading plans?
First, the premium/discount rate is not an indicator to be used in isolation.
It can tell us the direction of funds but not the magnitude or sustainability.
Here, I suggest combining it with the following dimensions.
1. The Sustainability of the Premium/Discount Rate is More Important Than a Single Day’s Value
A single day of negative premium (discount) might just be short-term volatility.
However, if negative premiums appear for multiple consecutive days, it’s highly likely to correspond to consecutive net outflows, which warrants caution.
Looking back at the five consecutive trading days from January 16th to 23rd this year with negative premiums, they corresponded to five days of net outflows, and BTC fell nearly 10%.
2. Pay Attention to Extreme Values of the Premium/Discount Rate
Generally, fluctuations within ±0.5% are normal for the premium/discount rate.
Once it breaks through ±1%, it indicates a significant deviation in market sentiment, AP arbitrage motivation strengthens, and fund flows accelerate.
3. Combine with Price Level for Judgment
Sustained negative premiums (discounts) at high price levels might be an early signal of capital flight.
Sustained positive premiums at low price levels might be a sign of bottom-fishing capital entering the market.
The premium/discount rate itself does not constitute a buy/sell signal, but it can help you validate the current trend or detect potential turning points early.
Final Thoughts
Finally, there are a few points to note.
No single indicator is a holy grail. The effectiveness of the premium/discount rate is based on the premise that the AP arbitrage mechanism functions normally.
In extreme market conditions, such as the October 11th crash, where market liquidity dries up, the arbitrage mechanism may fail, and the correlation between the premium/discount rate and fund flows may weaken.
Furthermore, the premium/discount rate is just one window into observing ETF fund movements.
For mature investors, it’s just one piece of the puzzle.
It is recommended to combine it with the following indicators for multi-dimensional cross-verification:
- Changes in ETF Holdings: An increase in holdings indicates institutions are accumulating; a decrease indicates they are reducing positions. More direct than the premium rate, but data updates are delayed.
- Futures Basis and Funding Rate: A positive basis combined with a persistently high funding rate indicates overheated long sentiment and potentially excessive market optimism. The opposite suggests bearish dominance.
- Put/Call Ratio in the Options Рынок: Put options are bearish, Call options are bullish. A rising ratio indicates increasing market risk aversion; a falling ratio indicates dominant optimism.
- Large On-chain Transfers and Net Обмен Inflows: Large BTC transfers into exchanges typically signal impending selling pressure. Large transfers out of exchanges suggest accumulation.
For example.
When you observe: consecutive negative premiums, decreasing ETF holdings, and simultaneously rising net exchange inflows.
Three signals point in the same direction: capital is withdrawing, and selling pressure is accumulating.
At this point, you should at least increase vigilance and control your position size, rather than trying to buy the dip.
A single indicator cannot reveal the whole picture. Multi-dimensional cross-verification is needed to improve the accuracy of your judgment.
In this market, the more dimensions you observe from, the smaller the information gap, but the time lag always exists.
Whoever sees the direction of funds first gains an extra measure of initiative.
Эта статья взята из интернета: Stop Relying Solely on Lagging Data, Use ETF Premium Rates to Seize Trading Opportunities
In 2026, the crypto industry stands at a new crossroads. With the deep involvement of institutional capital, the finalization of regulatory frameworks, and the growth of AI in the on-chain economy, the privacy track is undergoing an unprecedented paradigm shift. Over the past decade, blockchain privacy technology has often been misunderstood as a tool for money laundering or a haven for hackers. This early form based on “indiscriminate anonymity” has repeatedly faced setbacks due to its inherent antagonism with the global financial regulatory system. However, the Privacy 2.0 paradigm, centered on “programmable compliance,” has taken shape and is becoming the cornerstone of the next generation of Web3 infrastructure. 1. The “Lost Decade” of Privacy and the Logic of Its Potential Explosion 1.1 The Misconception of Indiscriminate Anonymity Looking back over…


