Bitcoin Bear Market Rally Nears Upper Limit: 78,000 Becomes Key Resistance Level
Original Compilation: AididiaoJP, Foresight News
Bitcoin price is holding steady around $74,000, approximately 5% below the key resistance level of $78,000. While spot and ETF demand has shown improvement, profit-taking activities, weak market breadth, and cautious options positioning all indicate that the current rally is driven by capital flows and remains fragile, lacking strong market conviction.
まとめ
- Bitcoin price has climbed to around $74,000, currently 5.2% below the Realized Price of $78,100, which remains a key near-term resistance level. The percentage of Short-Term Holder supply in profit is 43.2%, suggesting room for further upside before reaching typical distribution thresholds.
- Profit-taking activity is heating up, with the 30-day exponential moving average of the Realized Profit/Loss Ratio at 1.16, indicating investors are selling into strength. For the market to sustainably hold above $78,100, it must be able to absorb this overhead supply pressure.
- Institutional positioning is stabilizing, with ETF inflows and CME exposure rebounding. However, participation remains below prior highs, suggesting institutional investors are re-entering in a cautious and selective manner rather than shifting wholesale into risk-on mode.
- Spot and liquidity dynamics reflect uneven demand. Binance is leading buying pressure, showing stronger buying intensity than Coinbase, while Hyperliquid data indicates the market is in a liquidity-driven range, with price reacting between dense clusters of long and short liquidations.
- Derivatives and on-chain signals point to a neutral-to-fragile structure. Funding rates are balanced, implied volatility is compressed, and exchange flows have turned to modest net inflows, suggesting early accumulation is present but market conviction is limited.
On-Chain Analysis
Approaching the Ceiling
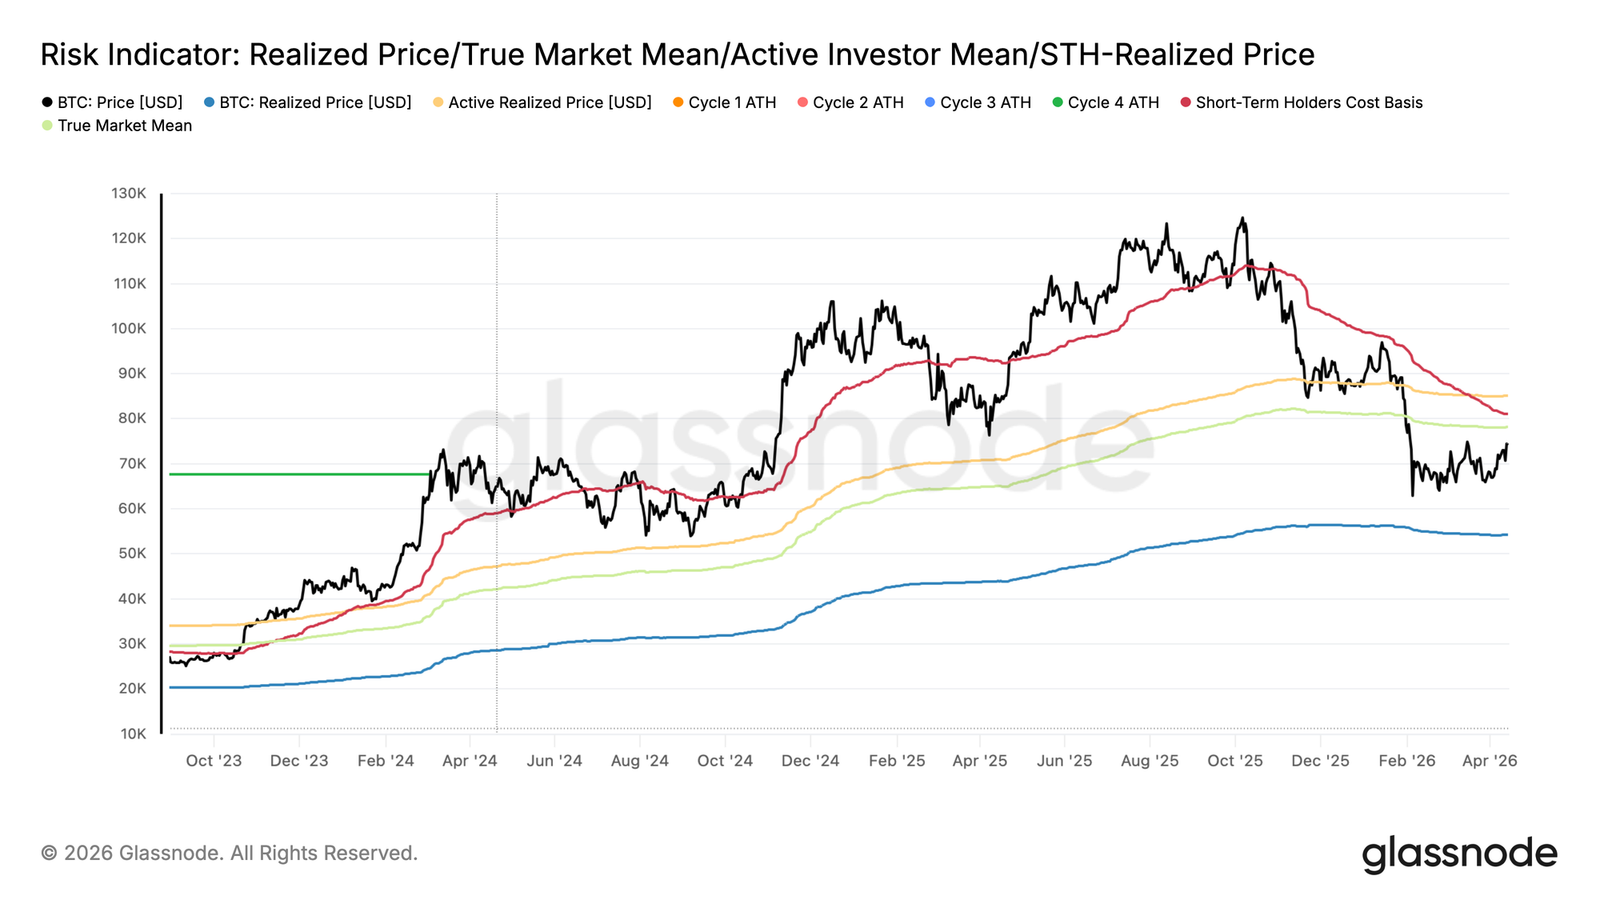
Last week, this report identified the Realized Price of $78,100 as the most likely intermediate ceiling for any rally within the current bear market structure.
Since then, Bitcoin price has gradually moved higher, currently trading around $74,000, approximately 5.2% below that Realized Price—the trajectory of the active supply cost basis. While price has not yet tested and held above this key threshold, the probability of price pushing up to, and even briefly through, this level in the medium term remains significant.
This edition will examine the on-chain tools best suited for identifying local tops within bear market rallies, helping investors navigate the risk of distribution pressure as price approaches structurally significant resistance.
New Entrants Nearing an Inflection Point
With price still consolidating below the Realized Price, the behavior of Short-Term Holders provides a reliable lens for assessing when a bear market rally might be exhausting.
The Short-Term Holder Supply in Profit metric measures the proportion of recently acquired supply currently in an unrealized profit state, directly reflecting the profit-taking pressure from new market participants. Historical data shows that local tops in bear market rallies often form as this metric approaches its statistical mean of around 54.2%, a threshold corresponding to a concentration of profitable Short-Term Holders sufficient to trigger significant distribution. The current reading is 43.2%, still significantly below this threshold, indicating this rally has not yet entered a typical exhaustion zone. This leaves room for price to move slightly higher towards the Realized Price, while also providing a quantifiable level to monitor as price advances.
Profit-Taking Alarm Bells Ringing
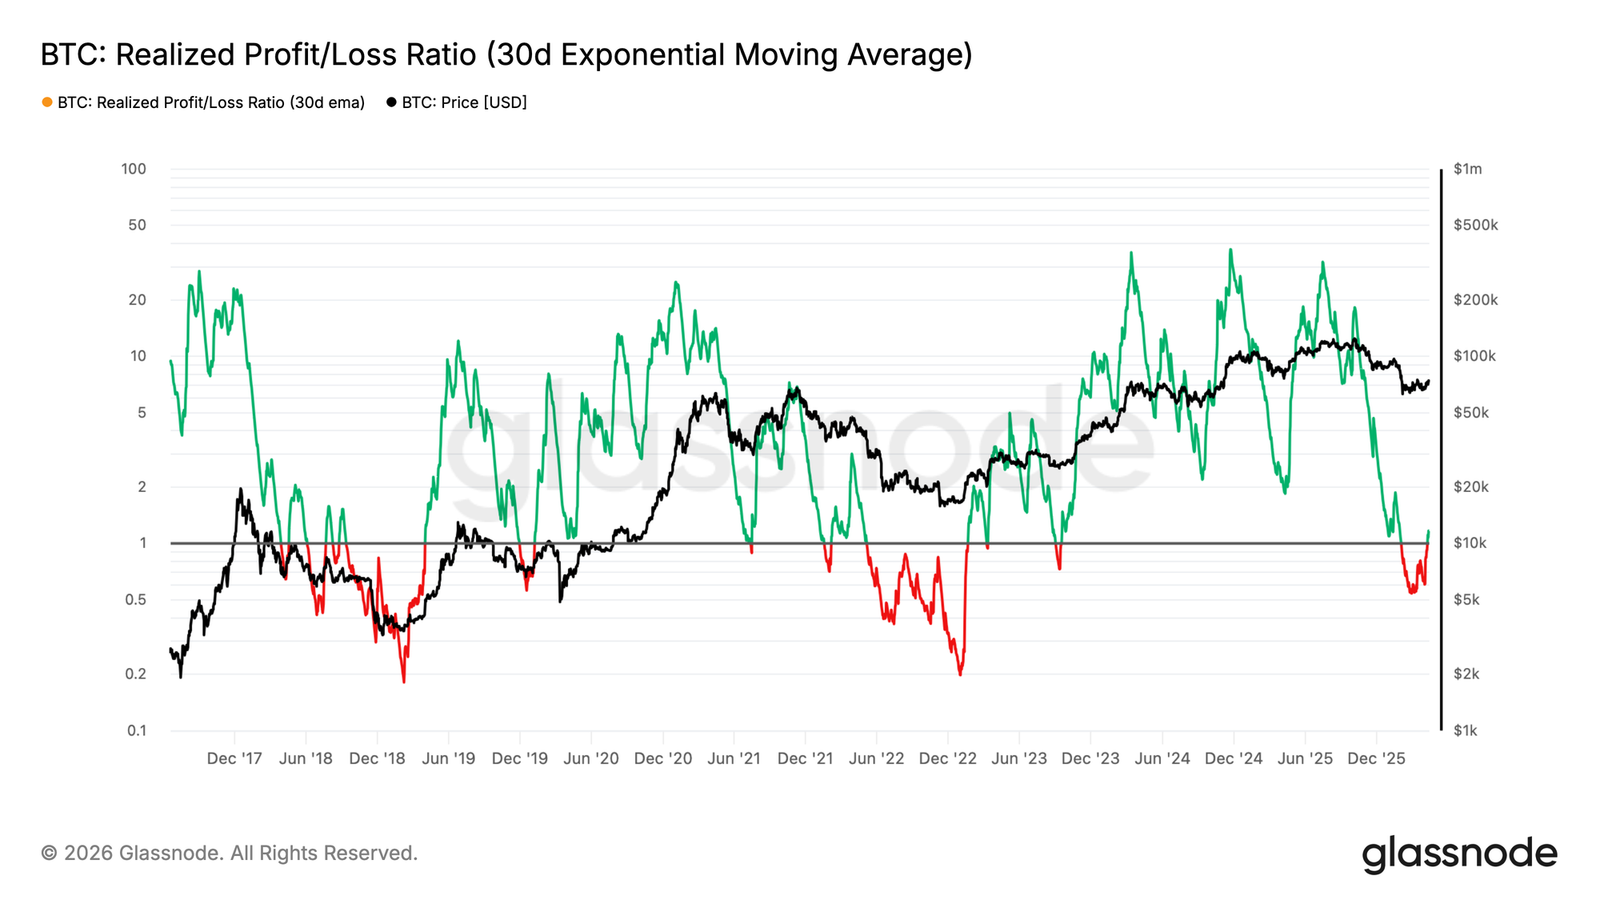
Building on the short-term exhaustion signal above, assessing market momentum over a longer horizon requires examining the balance between profit and loss realization across the broader investor base. The Realized Profit/Loss Ratio measures the dollar value of profit realized for every dollar of loss realized on-chain, and its 30-day exponential moving average smooths short-term noise to reveal underlying trends.
A value above 1 indicates profit-taking dominates loss realization. Therefore, the current reading of 1.16 confirms that investors broadly view this rally as an opportunity to exit positions near breakeven or with thin profits. While not an immediate reversal signal, sharp spikes in this ratio during bear market rallies have historically been a warning sign of distribution rather than genuine demand recovery.
For this rally to transition into a structural shift towards a bull market, the market requires a significant demand catalyst to absorb this wave of profit-taking and allow price to sustainably hold above the $78,100 Realized Price over the medium term.
Off-Chain Analysis
Selective Spot Buying
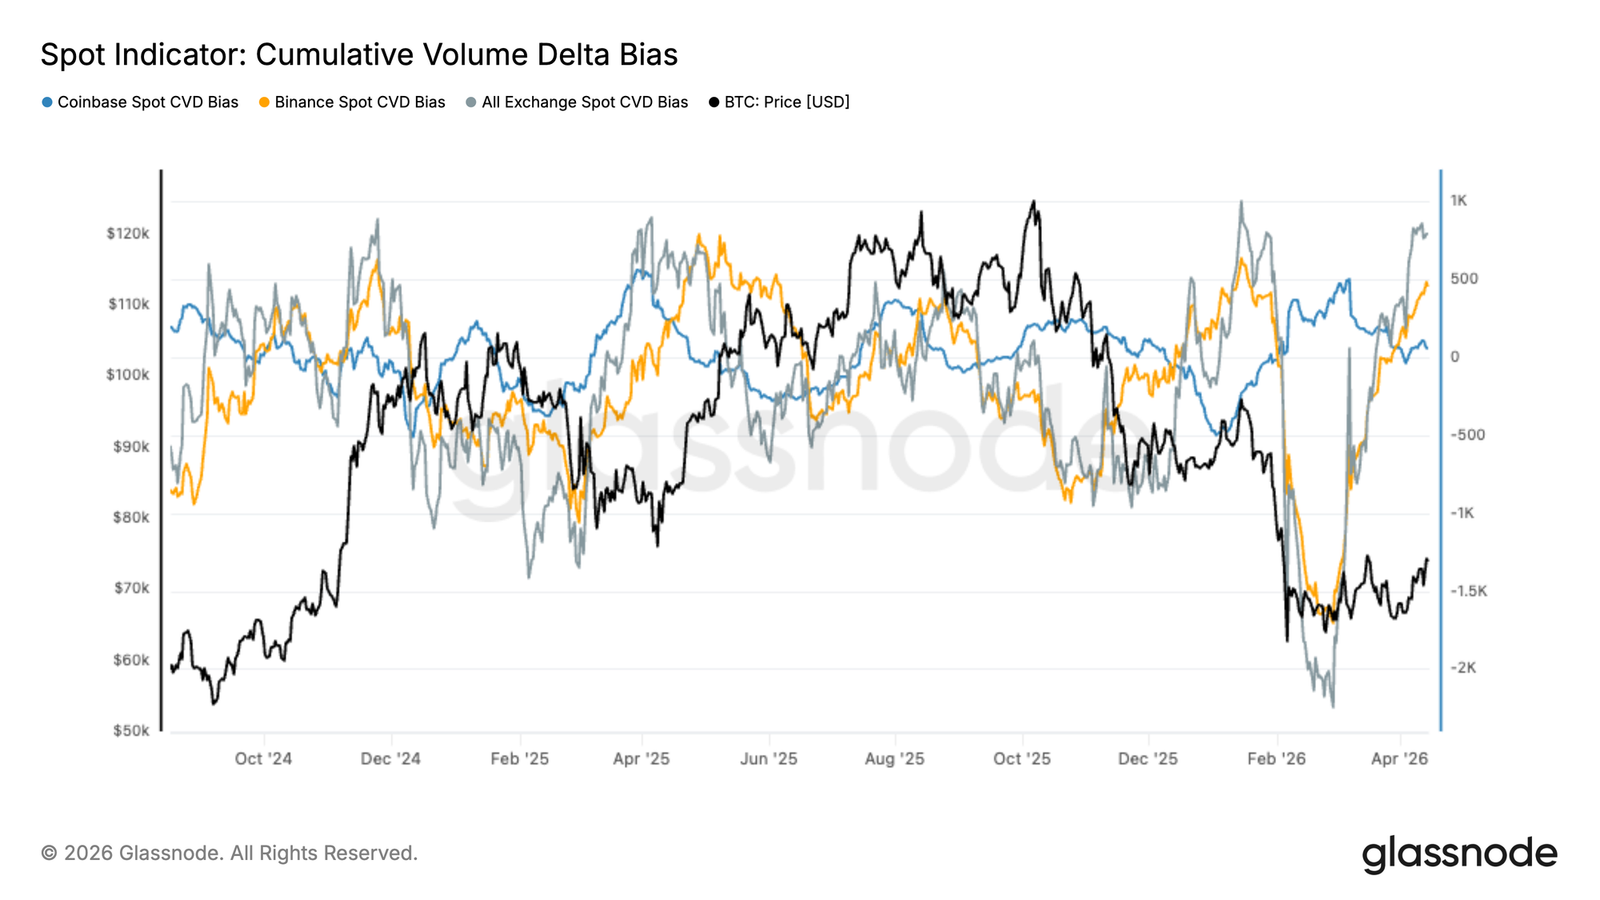
Following the capitulation event in February, the spot Cumulative Volume Delta (CVD) rebounded sharply, with overall flows recovering from deeply negative territory into positive ground. This shift marks a clear transition from aggressive selling pressure to net spot accumulation, aligning with the recent price stabilization.
However, the recovery in demand across venues is uneven.
Binance flows have led the uptick, indicating a resurgence of activity in the offshore and retail-driven sphere. In contrast, Coinbase’s CVD remains relatively subdued, suggesting a slower pace of re-engagement from institutional investors. This divergence is noteworthy, as sustainable rallies typically require broader participation from both investor cohorts.
While the digestion of selling pressure is constructive, the current structure reflects more selective buying rather than a fully established demand regime.
For this recovery to prove durable, stronger confirmation from Coinbase flows may be needed, signaling deeper institutional participation and more resilient support at higher price levels.
CME Futures and ETF Holdings Cautiously Rebuilding
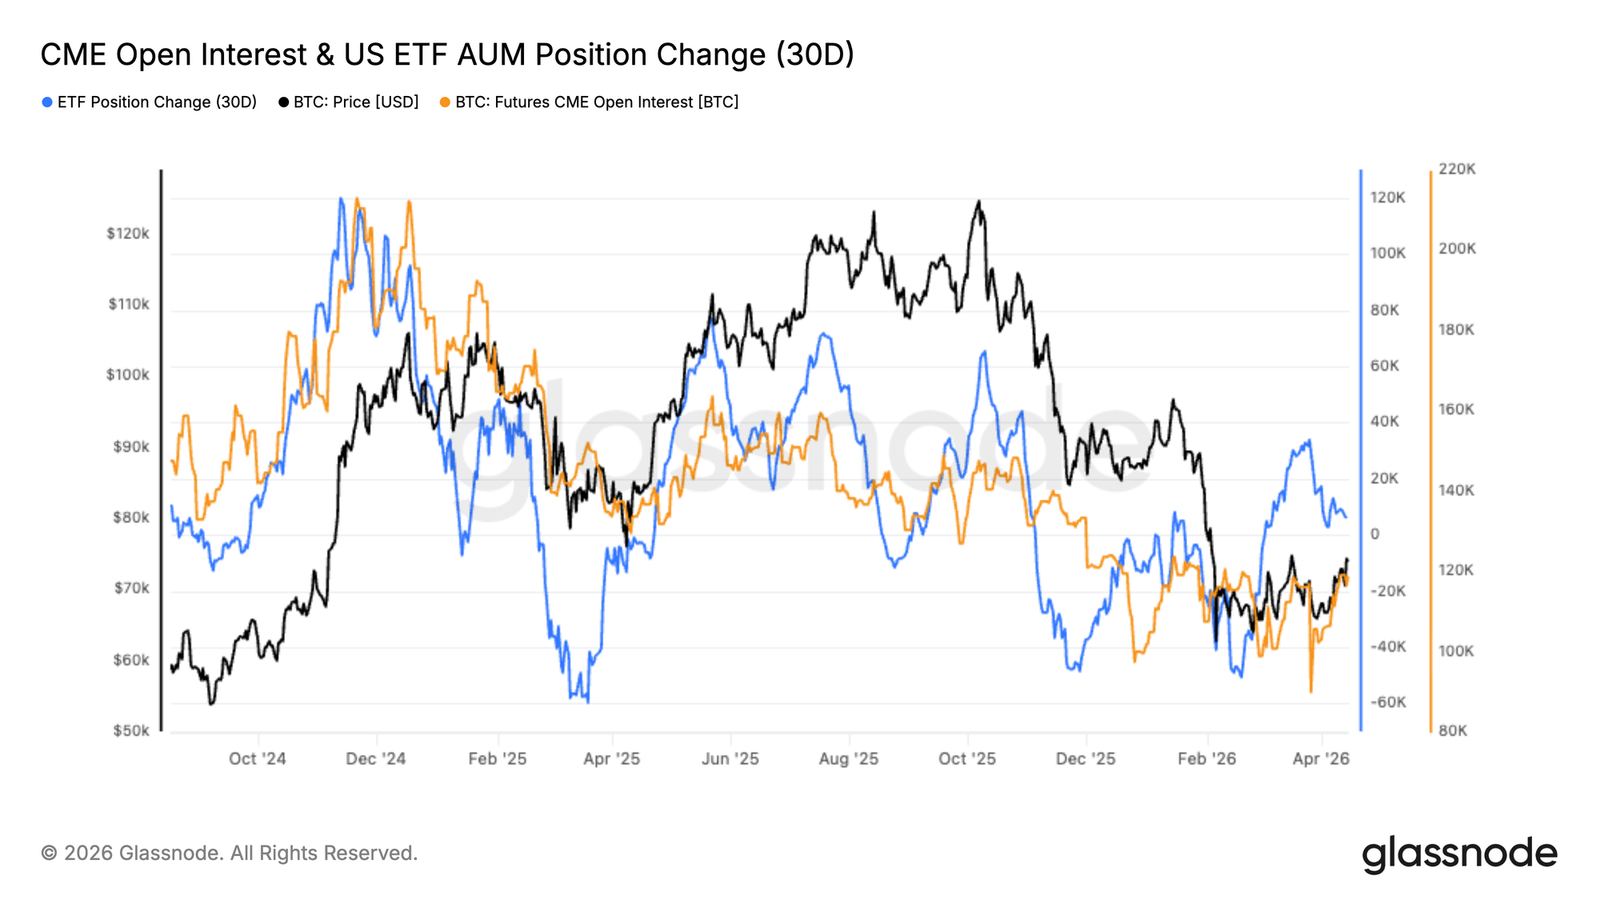
Following the February pullback, institutional exposure appears to be stabilizing, with both CME Open Interest and US ETF Assets Under Management showing early signs of recovery. After a sharp deleveraging event, CME positioning has begun rebuilding from local lows, indicating a gradual return of futures-based exposure.
Concurrently, ETF flows have turned back into positive territory after a period of sustained outflows. This reversal suggests a recovery in capital allocation via regulated investment vehicles, typically associated with longer-term and institutional participants.
However, the pace of recovery remains measured rather than aggressive. CME Open Interest remains well below prior highs, and ETF inflows lack the sustained momentum seen in earlier phases of this cycle. This points to a more cautious re-entry rather than a full-fledged risk-on switch.
Taken together, the data suggests institutional investors are beginning to return to the market, but in a more selective and restrained manner. Stronger and more persistent expansion in both CME positioning and ETF inflows would signal a more デフィnitive return of institutional confidence.
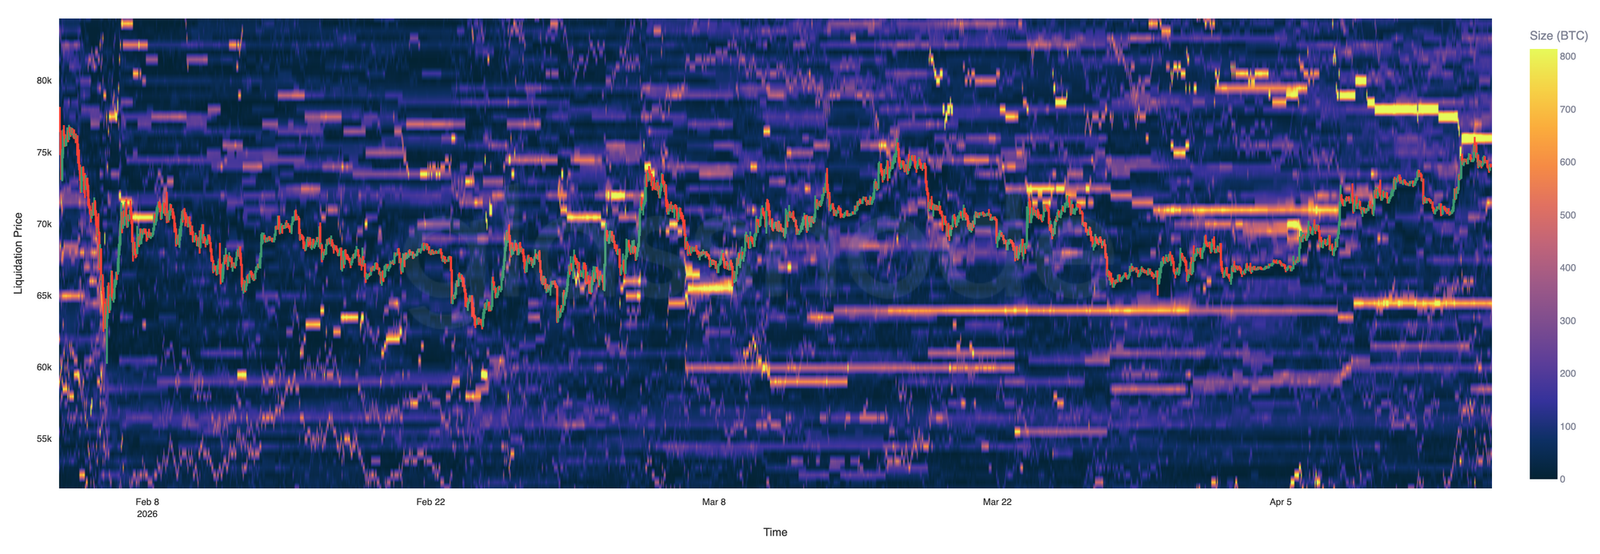
Hyperliquid Highlights Liquidity-Driven Range
Hyperliquid’s liquidation data reveals a highly concentrated and reactive perpetuals market, with liquidity tightly clustered around the current price. As a single-venue view, this reflects tactical positioning more than broad market structure, offering insight into short-term leverage dynamics.
To the downside, a dense band of long liquidations sits between $63k and $65k. Price has tested this zone multiple times, indicating it acts as a short-term liquidity magnet, triggering and absorbing forced selling.
To the upside, short liquidation clusters are concentrated around $74k to $76k. The recent rally has tested this area but failed to decisively break through, showing persistent overhead liquidity capping price.
Overall, price action appears driven by liquidation flows rather than strong directional conviction. For a sustainable breakout to occur, one side of the order book may need to be cleared, triggering a cascade and allowing price to extend beyond the current range.
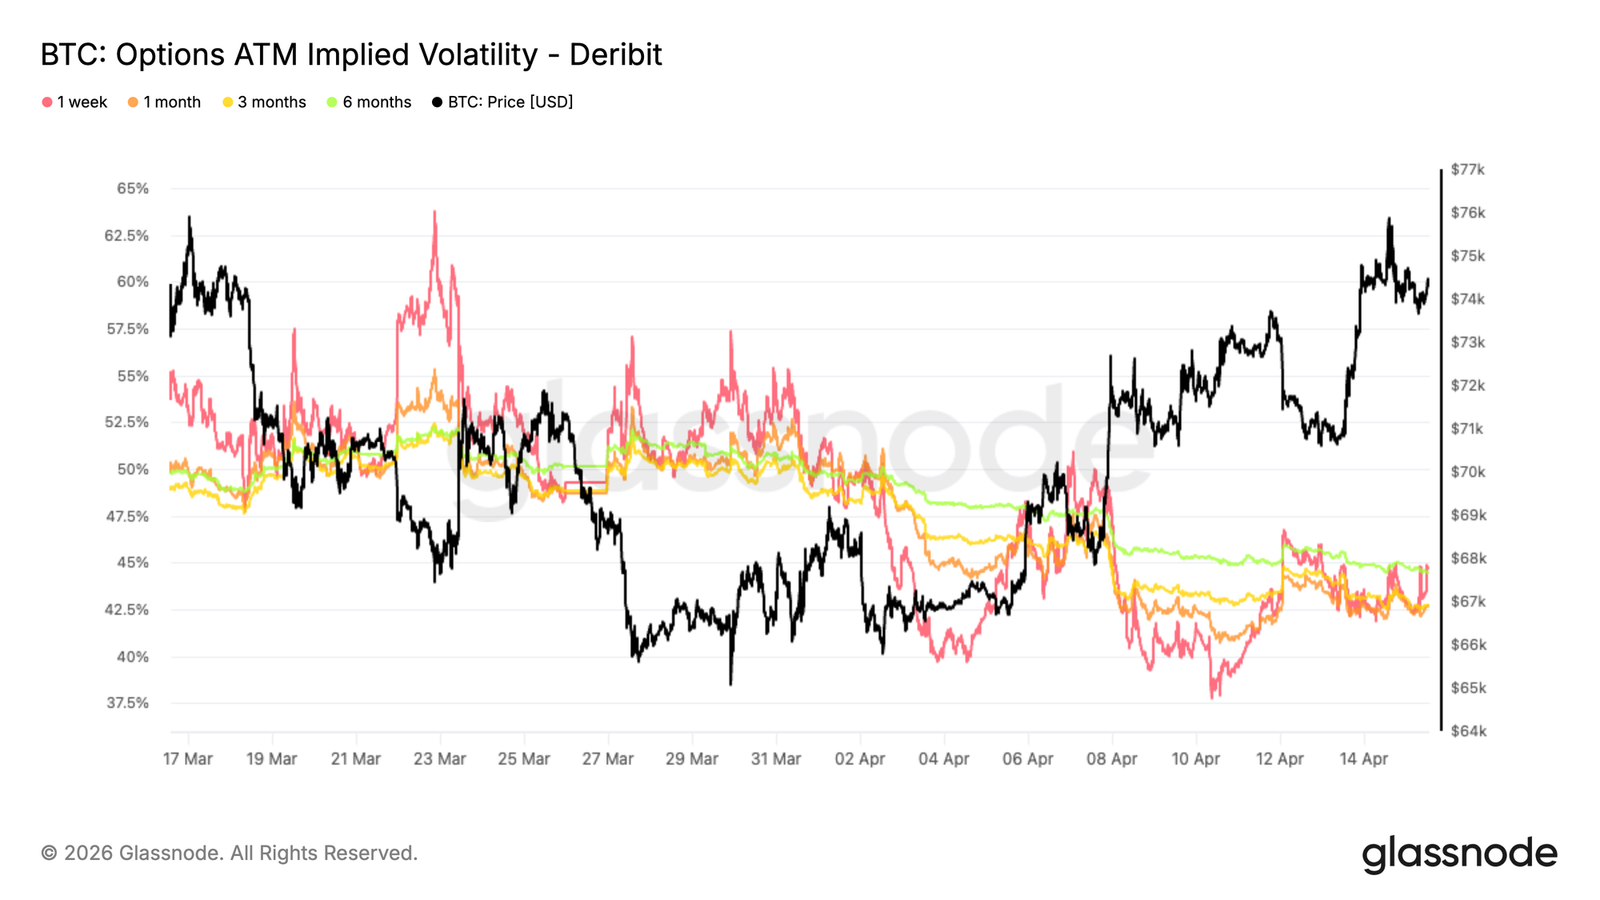
Implied Volatility Term Structure Remains Compressed
The rally in spot markets has not translated into meaningful repricing of volatility, with implied volatility declining across the curve. Front-end contracts have softened, and longer-dated prices have also been marked down, pointing to broad normalization of volatility expectations. The term structure remains relatively flat, with 1-month volatility slightly below 3-month at around 42.6%, reflecting limited urgency to price near-term risk. This compression suggests recent geopolitical headlines are no longer viewed as catalysts for sustained turbulence. Instead, volatility is being repriced towards more stable conditions, despite unresolved macro uncertainty. The synchronous downward shift across tenors indicates traders are unwinding protective positions rather than adding new exposure.
Despite higher spot prices, the options market is not signaling a regime change but rather a normalization process following a period of heightened stress.
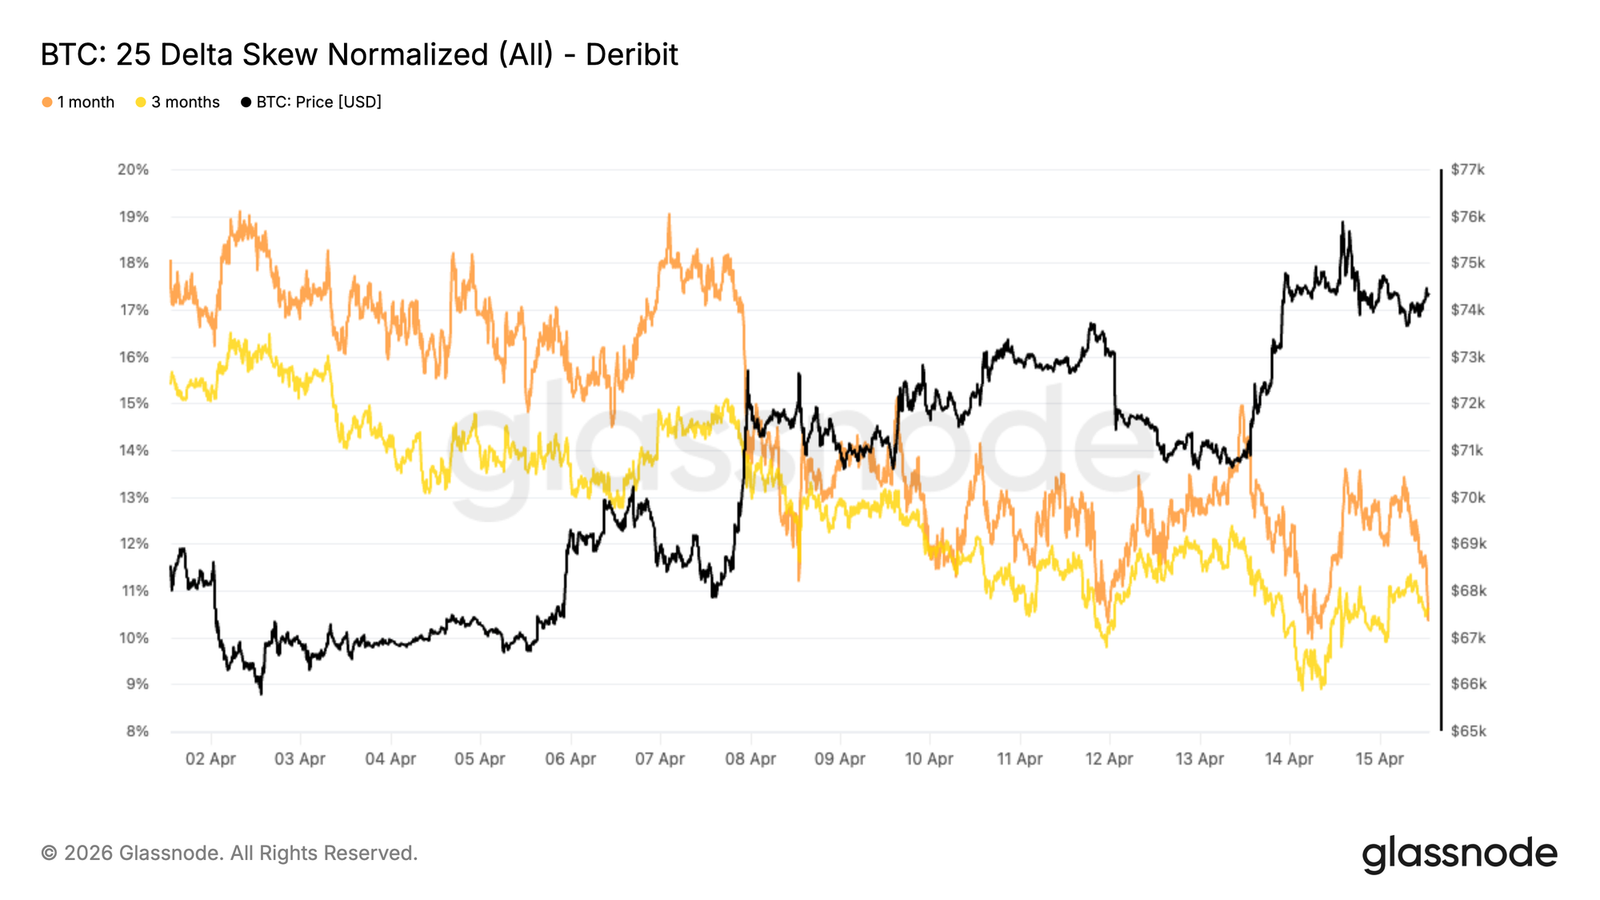
25-Delta Skew Still Reflects Downside Demand
Despite the moderation in volatility levels, the relative pricing of options still shows a preference for protective positioning. The 25-delta skew remains tilted towards puts across tenors, indicating downside protective options continue to trade at a premium to calls, although the skew values themselves have retreated from high double-digits to low double-digits.
This suggests that even as traders have reduced direct hedging positions, they are not actively rotating into bullish positions. The persistence of negative skew highlights underlying caution beneath the market surface.
The compression in recent skew values, particularly in longer tenors, indicates some normalization as extreme tail-risk hedging is unwound. However, the overall structure still reflects an asymmetry in demand, with a structural preference for protective positioning remaining.
The divergence between lower volatility and persistent downside skew reinforces the view that the market is skeptical rather than convinced of this rally.
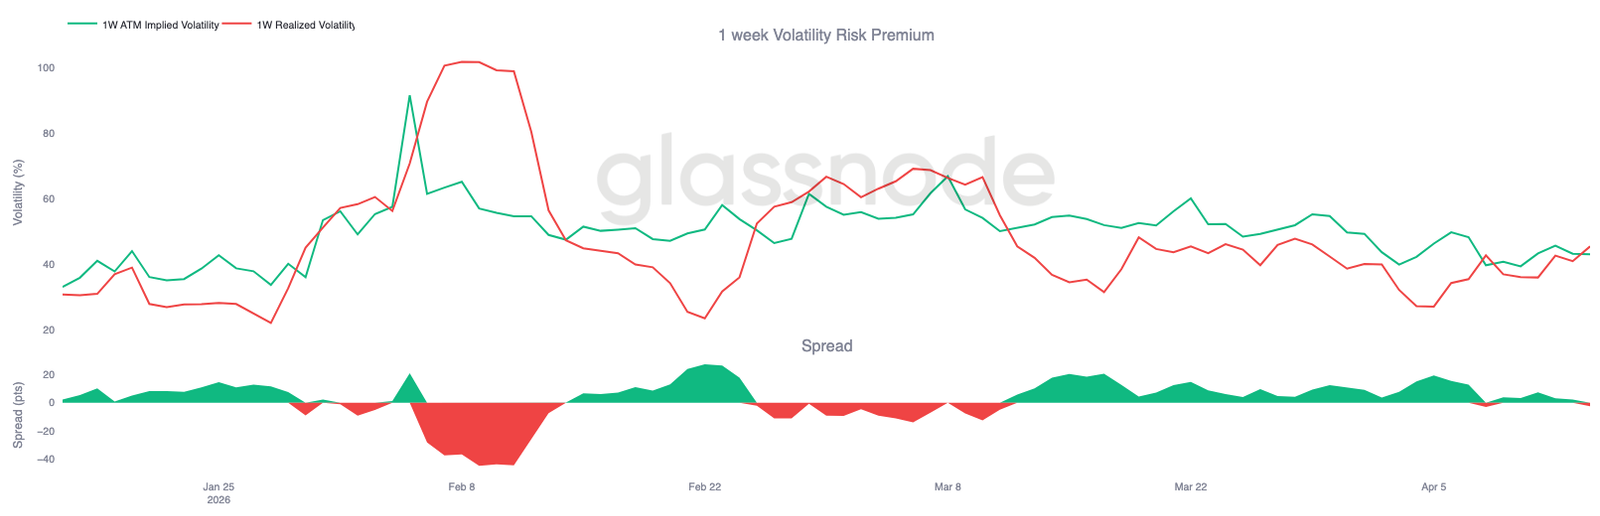
1-Week Volatility Risk Premium Turns Negative
Taking a broader view of the volatility surface, the short-term volatility risk premium has inverted, with realized volatility now exceeding implied volatility. This spread, which measures the gap between forward expectations and actual price movement, is currently around -2 volatility points, with ATM implied volatility around 43 and realized volatility near 45.
This shift occurred against a backdrop of significant spot price movement early in the week, where Bitcoin gained over 5% in a single day while implied volatility was priced lower. As a result, the options market underestimated the magnitude of actual price movement, leading to an inverted risk premium.
In this context, short-dated options no longer embed a protection premium but instead reflect a market caught off guard by actual price action.
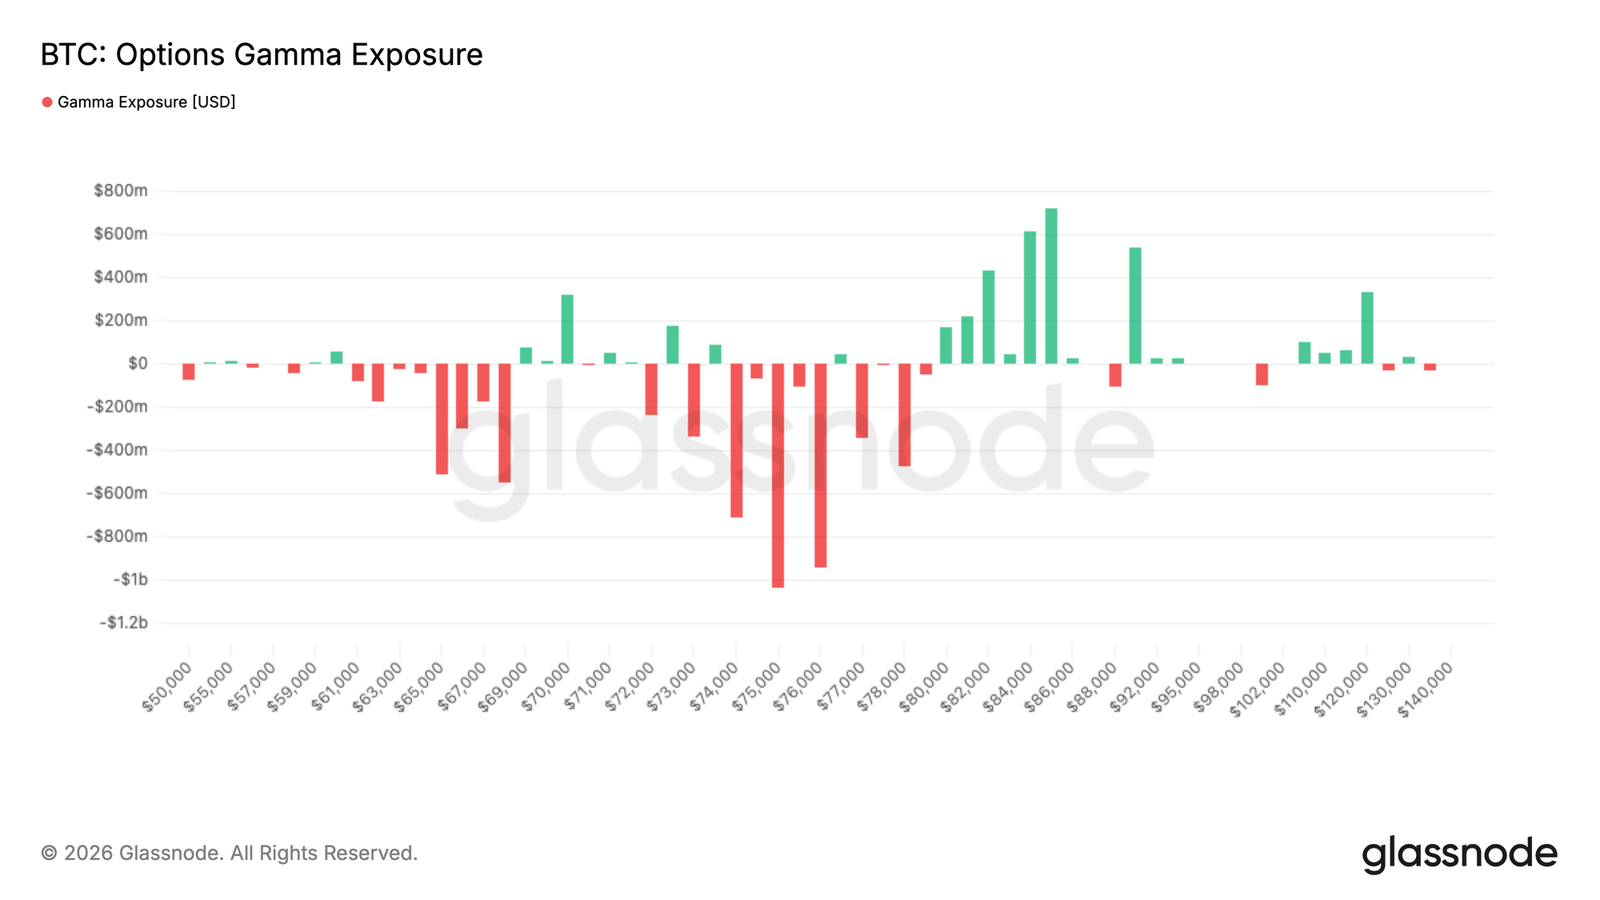
$76k Emerges as Key Pivot
From a market structure perspective, dealer positioning plays a central role in recent price action. A significant negative gamma exposure is concentrated in the $74k to $76k range, with approximately $3 billion in exposure sitting above spot price, creating a zone where hedging operations can influence price direction.
As spot price approaches this zone, dealers are forced to buy into the move to manage their exposure, reinforcing upward momentum. This dynamic changes the interpretation of resistance, as areas with high negative gamma can become accelerators rather than obstacles.
Below this zone, a lack of strong positive gamma support means price action may remain sensitive to flows. The current market structure reflects an environment where mechanical hedging activity can amplify price moves, amid still relatively light liquidity and positioning.
結論
In summary, the market is showing initial signs of stabilization across spot, derivatives, and on-chain metrics, but the recovery remains uneven and lacks broad-based conviction. Spot demand has returned, ETF flows are improving, and positioning is beginning to rebuild, yet participation remains fragmented across venues and investor cohorts. Derivatives and options markets reflect this uncertainty, with neutral positioning and compressed volatility indicating a lack of strong directional preference.
Simultaneously, structural headwinds persist. Profit-taking increases with price, Short-Term Holders are approaching breakeven levels, and options skew continues to show demand for downside protection. Liquidity dynamics and dealer positioning are also playing an outsized role, reinforcing a flow-driven, reactive market environment.
For a more decisive trend to emerge, the market likely requires sustained capital inflows, stronger institutional participation, and the ability to absorb overhead supply pressure at key resistance levels—particularly around the Realized Price.
この記事はインターネットから得たものです。 Bitcoin Bear Market Rally Nears Upper Limit: 78,000 Becomes Key Resistance Level
Related: Once booming projects, now mere dust and ashes
Author|Wenser(@wenser 2010 ) Some time ago, a tweet by Christian, the founder of Infini, sparked considerable discussion within the crypto community. In the tweet, he shared his personal “diamond hands experience”—upon logging back into friend.tech, he discovered that his FRIEND tokens, once valued at a peak of $7 million, could now only be sold for $10,000. He then went on to mention the “wallet woes” of a generation of crypto enthusiasts—countless NFTs that have gone to zero. Looking back from the vantage point of 2026 at the successive waves of hype that have swept through the crypto space, many once-famous projects have now sunk to their lowest points. The once-thrilling fruits of immense wealth have gradually withered and shriveled, turning into inconspicuous grains of sand in the long river of…