Bitcoin’s Short-Term Bear-to-Bull Shift: Will History Repeat Itself? | Guest Analysis

貿易週報のコア・サマリー:
• Strategy Execution (Short-term): Last week’s trading strictly adhered to the established strategy, completing one short-term operation (1x leverage) with a return of -1.07%. (See Figure 1 for details)
• Core View (Short-term) Validation: The core view proposed last week has been precisely validated by the market. Over the past week, the price broke through the crucial resistance zone of $94,500–$95,000 and is currently confirming its validity. The price reached a high of $97,963, which is less than 0.5% away from the lower bound of the given resistance zone at $97,500, once again confirming our ability to judge key levels.
• 市場 Outlook for the Coming Weeks: Is Bitcoin transitioning from a bear to a bull market? Is the current market movement a rebound or a reversal? The 21-week moving average may become the market’s bull-bear dividing line in the future. (Detailed explanation in Figure 4)
以下のセクションでは、市場予測、戦略の実行、具体的な取引プロセスについて詳しく説明する。.
1. Bitcoin Market Review for Last Week (01.12–01.18)
1. Review of Last Week’s Short-term Operations: As shown in (Figure 1)
We strictly followed the trading signals generated by our self-developed Spread Trading Model そして Momentum Quant Model, combined with our market trend predictions, to execute one short-term trade. This trade resulted in a loss of 1.07%.
Specific trade details and review are as follows:
Bitcoin 30-minute K-line Chart: (Momentum Quant Model + スプレッド取引 Model)
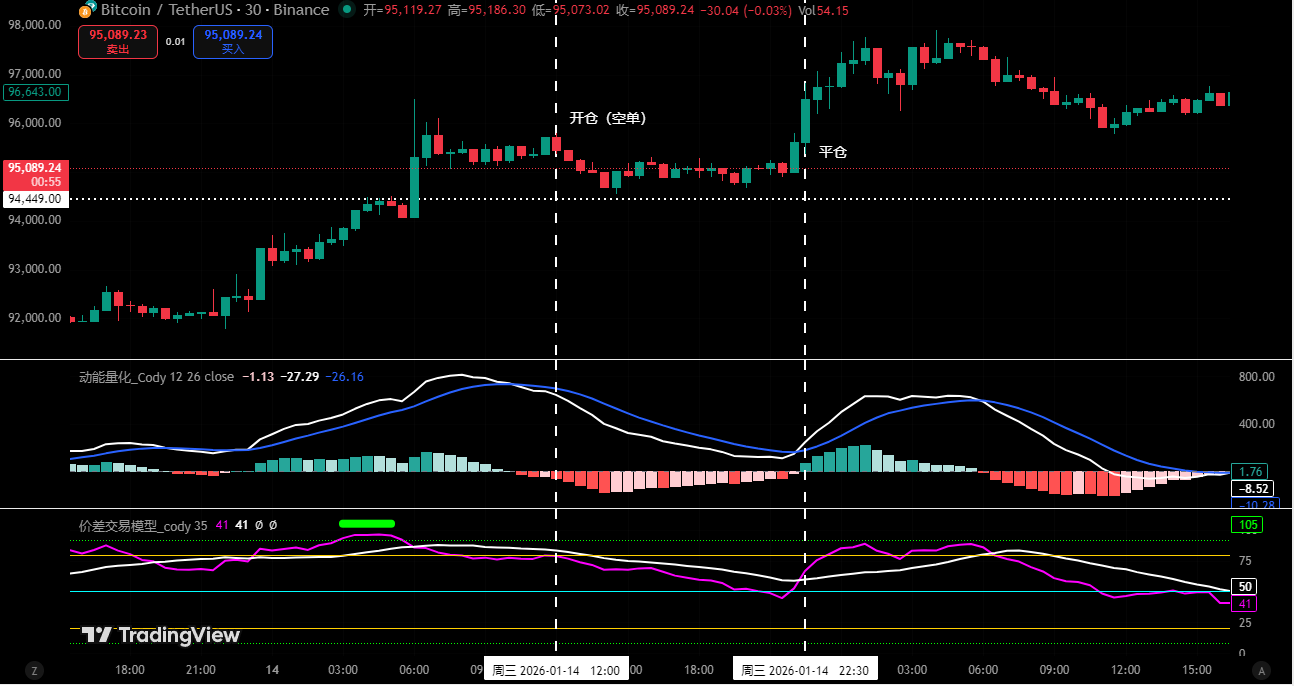
図1
①、Trade Details Summary: (No Leverage)

②、短期トレードの見直し
• First Trade (Loss 1.07%): This operation executed the Plan A (Shorting at Resistance Level) strategy: When the price rose to the key resistance zone of $94,500–$95,000 and showed signs of rejection, the Spread Trading Model simultaneously triggered a top signal (green dot), forming a dual confirmation. Accordingly, we established a 30% short position as planned at $95,460; however, the market deviated from expectations, finding support near $94,500 and turning upward. When the Momentum Quant Model そして Spread Trading Model triggered bottom signals again, we immediately stopped the loss and exited at $96,493. Although this trade resulted in a loss, we strictly adhered to the operational discipline of “trading upon signal trigger, risk control first”, achieving unity of knowledge and action.
2. Review of Last Week’s Trend Prediction and Operational Strategy:
①、Last week clearly stated: Maintain consolidation within the $84,000–$94,500 range, focusing on observing directional choices and their validity at both ends of the range.
②、Key Level Review: Resistance zone at $94,500–$95,000, important resistance near $97,500–$99,500; support zone at $89,500–$91,000.
②、Operational Strategy Review:
• Medium-term Strategy: If the price successfully breaks through and stabilizes above $94,500, close all medium-term positions (short positions) and hold coins for observation.
• Short-term Strategy: If consolidation continues within the $84,000–$94,500 range, execute operations according to プランA:
• Entry: When rebounding to the $94,500–$95,000 zone combined with model top signals, establish a 30% short position.
• Risk Control: Initial stop-loss for short positions set near 1.5% above the entry price (i.e., 1.015 * entry price).
• Exit: When approaching core support levels combined with model signals, gradually close positions to take profits.
2. Analyzing Bitcoin’s Price Structure from a Technical Perspective: A Comprehensive Assessment Based on Multiple Models and Dimensions
Combined with market movements, the author conducts an in-depth analysis of Bitcoin’s price structure from multiple models and dimensions based on a self-developed trading system.
Bitcoin Weekly K-line Chart: (Momentum Quant Model + Sentiment Quant Model)
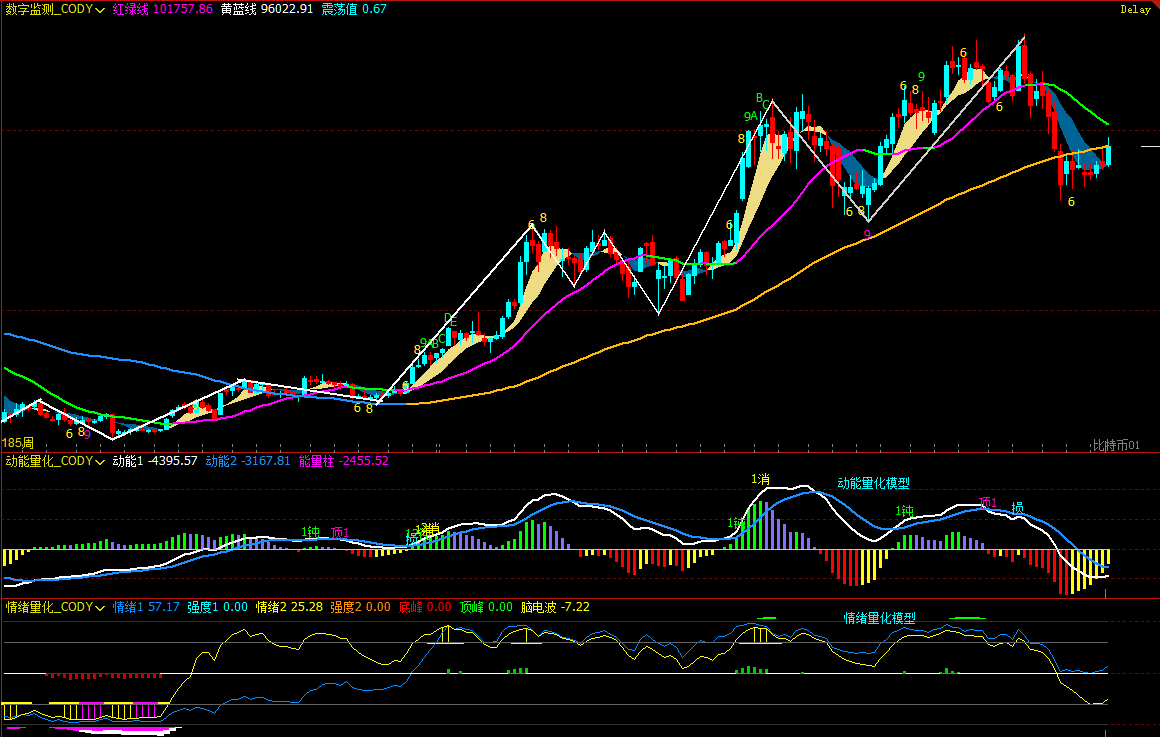
図2
1、As shown in (Figure 2), analysis from the weekly chart:
• Momentum Quant Model: Technical indicators show, continuing the pattern of previous weeks, the momentum lines are gradually converging, while negative energy bars continue to shrink. However, current signals do not confirm a reversal of the bearish trend.
The Momentum Quant Model indicates: 価格下落の可能性:高い
• Sentiment Quant Model: Blue sentiment line value 57.17, intensity zero; yellow sentiment line value 25.28, intensity zero, peak value is 0.
The Sentiment Quant Model indicates: Price Pressure and Support Index: Neutral
• デジタル・モニタリング・モデル: The price has been below the bull-bear (yellow-blue line) dividing line for 9 weeks. Last week, bulls challenged this line again, closing near it.
The Digital Monitoring Model indicates: No monitoring (top/bottom) digital signals appeared; the weekly K-line closed as a medium bullish candle, gaining approximately 2.92%.
上記のデータは示唆している: Bitcoin’s weekly chart shows a bearish trend; be alert to risks of volatile adjustments.
Bitcoin Daily K-line Chart: (Momentum Quant Model + Sentiment Quant Model)
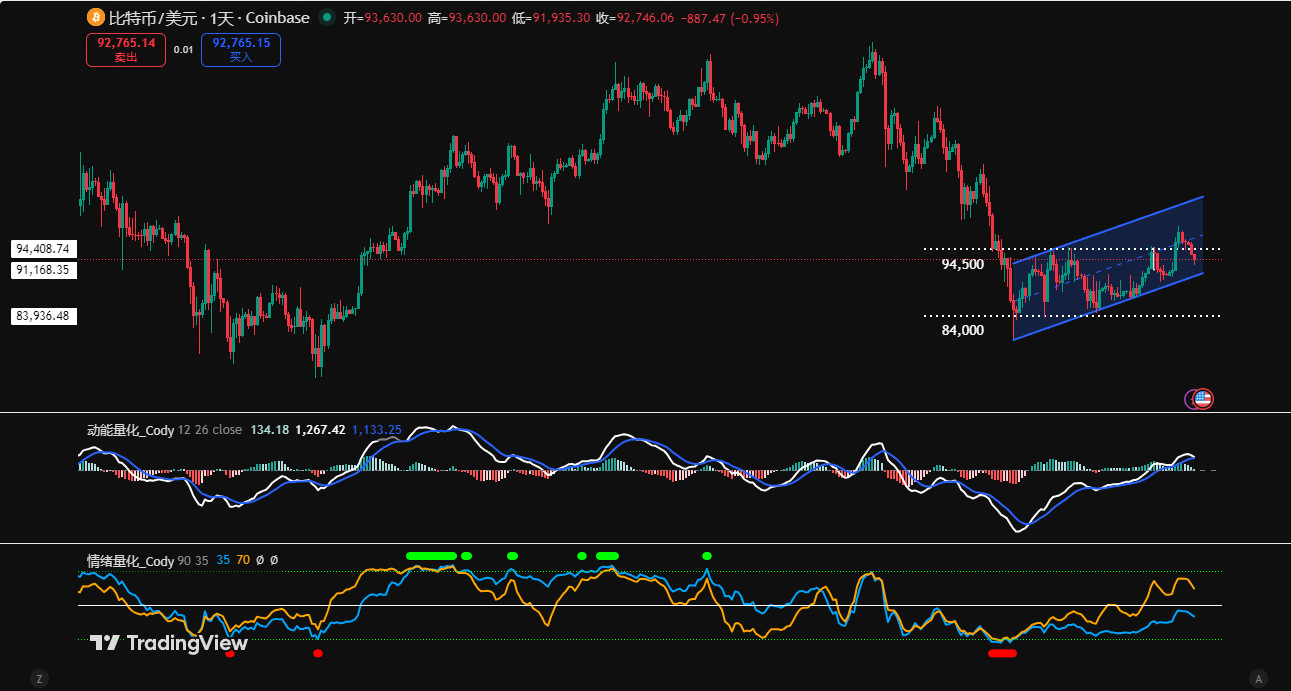
図3
2、As shown in (Figure 3), analysis from the daily chart:
• Momentum Quant Model: Last week’s overall trend was “rising first, then falling.” In the first half, the price accelerated its rebound, the momentum line moved above the zero axis, and positive energy bars expanded rapidly. However, in the latter half, energy bars significantly shrank, the momentum lines converged again, and began slowly approaching the zero axis.
The Momentum Quant Model indicates: Daily chart bullish momentum is showing signs of exhaustion, focus on the gain/loss of the zero axis.
• Sentiment Quant Model: After last week’s daily close, the blue sentiment line value is 38, intensity zero; the yellow sentiment line value is 76, intensity zero.
The Sentiment Quant Model indicates: Pressure and Support Index: Neutral
上記のデータは示唆している: The daily chart rebound continues, and the market is initially showing a bullish structure, but its validity needs confirmation. The focus next is on the battle between bulls and bears over the zero axis.
3. This Week’s Market Forecast (01.19–01.25)
1、This Week’s Core View: Focus on whether the $94,500–$95,000 zone is held or lost.
• Resistance Holds: If the price rebounds to this zone and confirms resistance, it is expected to maintain consolidation within the $84,000–$94,500 range. The subsequent primary test target is the $89,500–$91,000 ゾーン.
• Holding Firmly: それが可能なら firmly hold above this zone, the price may experience a volatile rebound, but the upside is limited.
2、Core Resistance Levels:
• First Resistance Zone: $94,500–$95,000 zone (previous range top)
• Second Resistance Zone: $97,500–$99,500 zone (previous consolidation pivot)
• Important Resistance Level: Near $10,200 (near the 21-week moving average)
3、Core Support Levels:
• First Support Level: $89,500–$91,000 zone (previous high-volume trading area)
• Second Support Level: $86,000–$86,500 zone (previous important support level)
• Important Support Level: Near $84,000 (previous range bottom)
4. This Week’s Operational Strategy (Excluding Sudden News Impact) (01.19–01.25)
1、 Medium-term Strategy: No positions. Market movements may be volatile and repetitive; temporarily hold coins for observation.
2、 Short-term Strategy: Utilize 30% 資金を投入し、損切りポイントを設定し、“広がり” trading opportunities based on support and resistance levels. (Using the 30-minute chart as the operational timeframe).
3、 Operationally, focus on whether the $94,500–$95,000 zone is held or lost. To dynamically respond to market evolution and combine real-time モデル信号, we have formulated two short-term operational plans, A/B:
• プランA: If the price stabilizes above the $94,500–$95,000 zone:
• Entry: After the price breaks through the $94,500–$95,000 zone and shows signs of stabilization, combined with model bottom signals, establish a 30% long position.
• Risk Control: Initial stop-loss for long positions set near 1.5% below the entry price (i.e., 0.985 * entry price).
• Exit: When approaching core resistance levels combined with model signals, gradually close positions to take profits.
• プランB: If the price effectively breaks below the $94,500–$95,000 zone:
• Entry: If the rebound confirms a valid breakdown of this zone, establish a 30% short position.
• Risk Control: Initial stop-loss for short positions set near 1.5% above the entry price (i.e., 1.015 * entry price).
• Exit: When approaching near $86,500 combined with model signals, gradually close positions to take profits.
Bitcoin Weekly K-line Chart: Comparative Analysis of Historical Price Structures (2021.11 VS 2025.10)
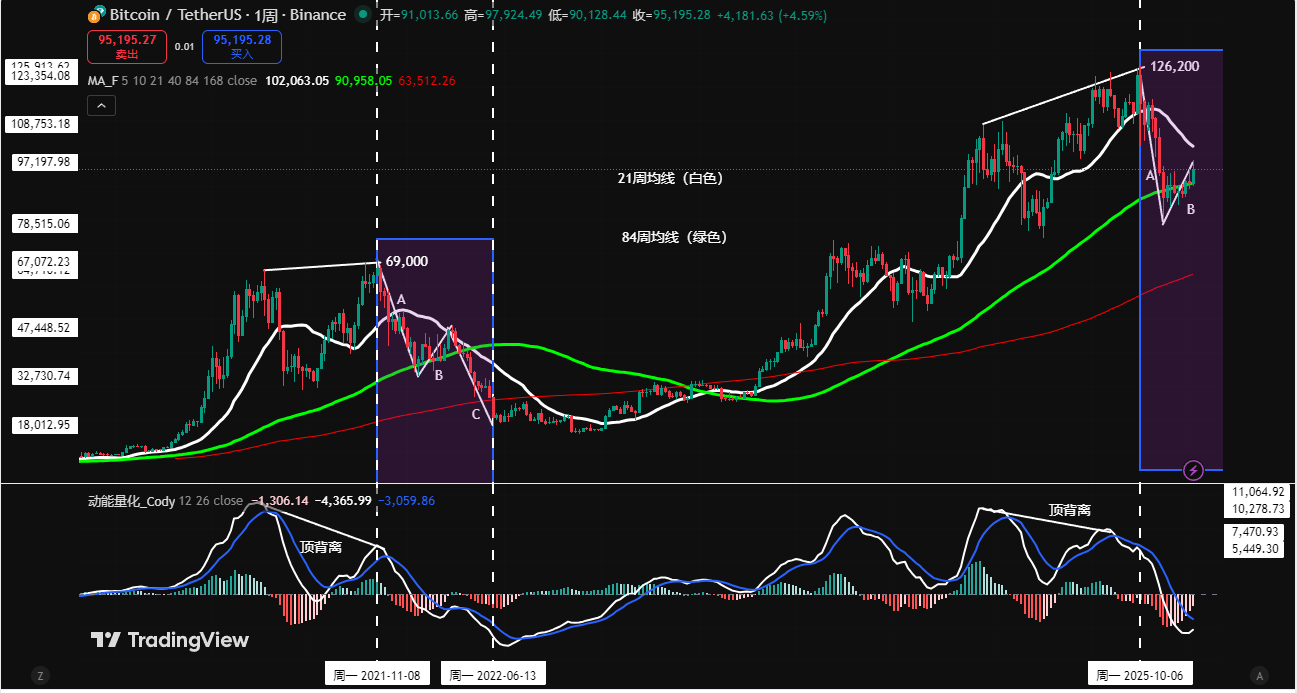
Figure 4
Note: In the chart above, the 21-week moving average (white), 84-week moving average (green)
5. How Will History Repeat? Comparing Similarities, Differences, and Insights from Two Rounds of Weekly-Level Adjustments:
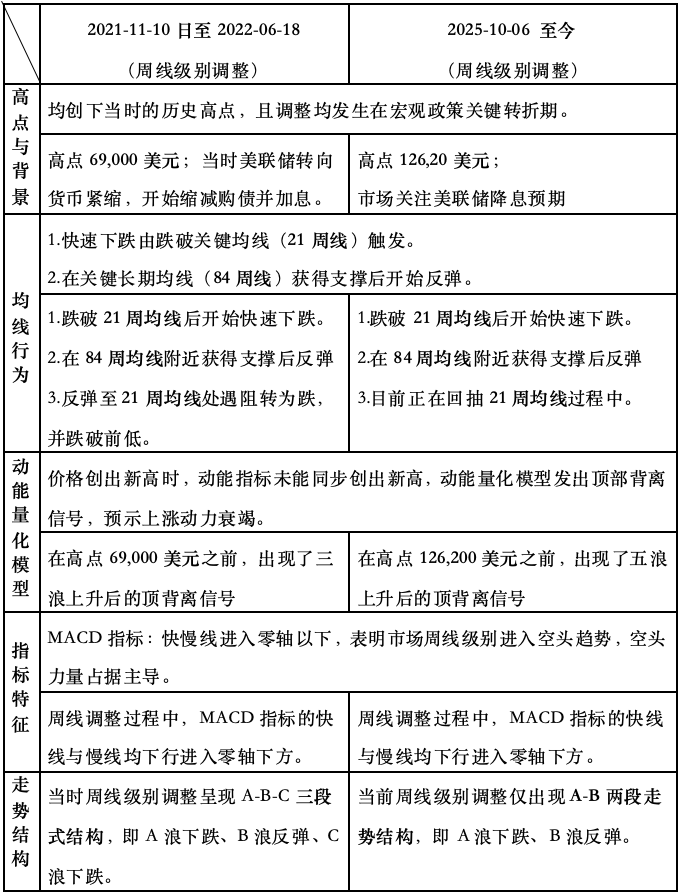
In summary, we can extract the following core insights:
1、The current weekly chart is in a bearish trend, which limits the upside potential of the daily chart rebound.
2、In the coming weeks, whether the price can effectively break through and stabilize above the 21-week moving average will become a market focus. If the price fails to form an effective breakthrough when rebounding to this moving average, the market may repeat the historical adjustment pattern, potentially even breaking below the $80,000 level.
3、Whether the weekly MACD indicator can show signs of stabilization and whether the momentum line can effectively cross above the zero axis become a key basis for judging whether the market trend has reversed.
6.特記事項
1. 入場時 すぐに最初の損切り水準を設定する。.
2. 利益が1%に達したとき: Move the stop-loss to the entry price (breakeven point) to ensure capital safety.
3. 利益が2%に達したとき: 損切りを1%の利益レベルに移動する。.
4. 継続的な追跡: Thereafter, for every additional 1% profit, move the stop-loss up by 1% accordingly, dynamically protecting and locking in profits.
Financial markets are ever-changing, and all market analysis and trading strategies require dynamic adjustment. All views, analytical models, and operational strategies mentioned in this article are derived from personal technical analysis, intended solely for personal trading log purposes, and do not constitute any investment advice or operational basis. Markets involve risks, invest with caution, DYOR.
この記事はインターネットから得たものです。 Bitcoin’s Short-Term Bear-to-Bull Shift: Will History Repeat Itself? | Guest Analysis
Guest: Matthew Sigel, Portfolio Manager of VanEck Onchain Economy ETF ($NODE) Host: Anthony Pompliano Podcast source: Anthony Pompliano Original title: Is It Time to Buy Bitcoin Now? Broadcast date: November 25, 2025 Key points summary Matthew Sigel is the portfolio manager of the VanEck Onchain Economy ETF ($NODE), considered one of the most forward-thinking institutional products in the crypto ecosystem. In this interview, we explore how institutions evaluate Bitcoin, from market structure and investor sentiment to the drivers of recent price movements. Matthew introduces three key indicators he uses to predict Bitcoin’s future direction, shares his buying strategies during market volatility, and his focus on crypto-related publicly traded stocks. Furthermore, this podcast discusses the broader digital asset ecosystem, including smart contract platforms, stablecoins, and areas he believes have the greatest…