43-Year Worst Plunge, Has Gold Peaked or Is It the Same Old Script?
The direct transmission chain of this sharp decline is not complex. As the US-Iran conflict entered its third week and the Strait of Hormuz was obstructed, oil prices have risen over 40% since the conflict began. According to data from the U.S. Bureau of Labor Statistics, February’s CPI hit a new high since last year. Combined with the lagged effects of high tariffs, market concerns about inflation have intensified sharply. The Federal Reserve narrowed its 2026 interest rate cut expectations to just one in its latest Summary of Economic Projections (SEP), essentially declaring the end of the recent easing cycle. The U.S. Dollar Index broke through the 100 mark, putting comprehensive pressure on precious and non-ferrous metal prices.
But the macro narrative is only half the story. According to Finance Magnates analysis, a technical breach of the 50-day moving average (around $4,978) triggered a concentrated stampede of “crowded long positions,” with stop-loss and margin call orders cascading. Gold rose from $2,600 to over $5,000 within 12 months, accumulating a massive amount of leveraged capital on the long side. When escalating conflict pushed up oil prices instead of gold, these crowded positions became the first to be sold off.
The price drop itself is not the story. The story is: this script of “geopolitical shock driving inflation, followed by concentrated deleveraging” has played out at least three times in the past 46 years.
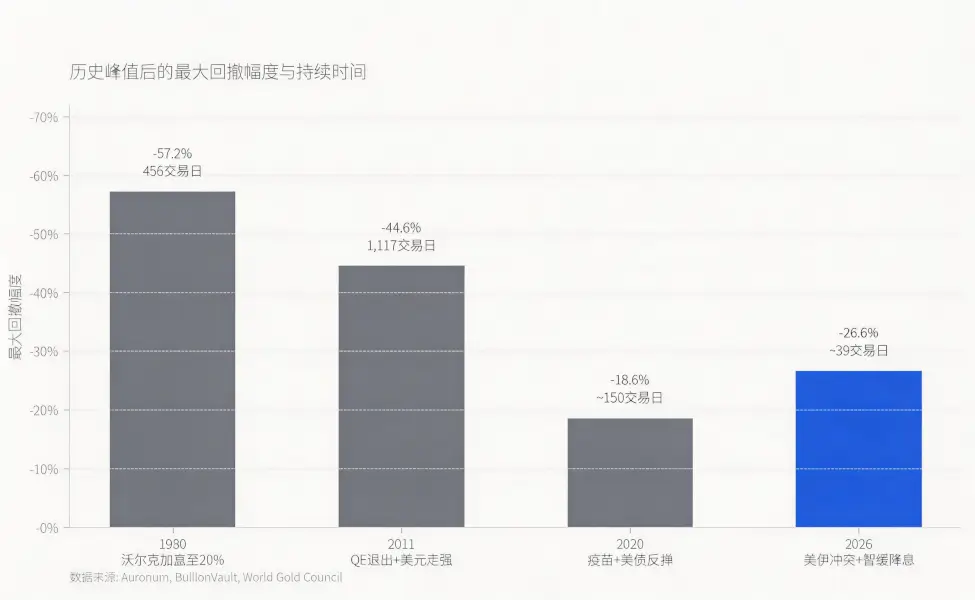
According to historical data compiled by precious metals analysis firm Auronum, in 1980, when Volcker pushed the federal funds rate to 20%, gold fell from a peak of $711 to $304, a 57.2% drop over 456 trading days. In 2011, expectations of QE tapering combined with a strong dollar drove gold from $1,999 to $1,049, a 44.6% decline lasting over 4 years. The 2020 pullback was milder; vaccine rollouts and rising U.S. Treasury yields caused gold to retreat 18.6% from its peak of $2,067, but it resumed its upward trend just 7 months later.
The 2026 pullback currently stands at around 27%, already exceeding 2020’s and approaching 2011’s level. But in terms of speed, it is the fastest of the four.
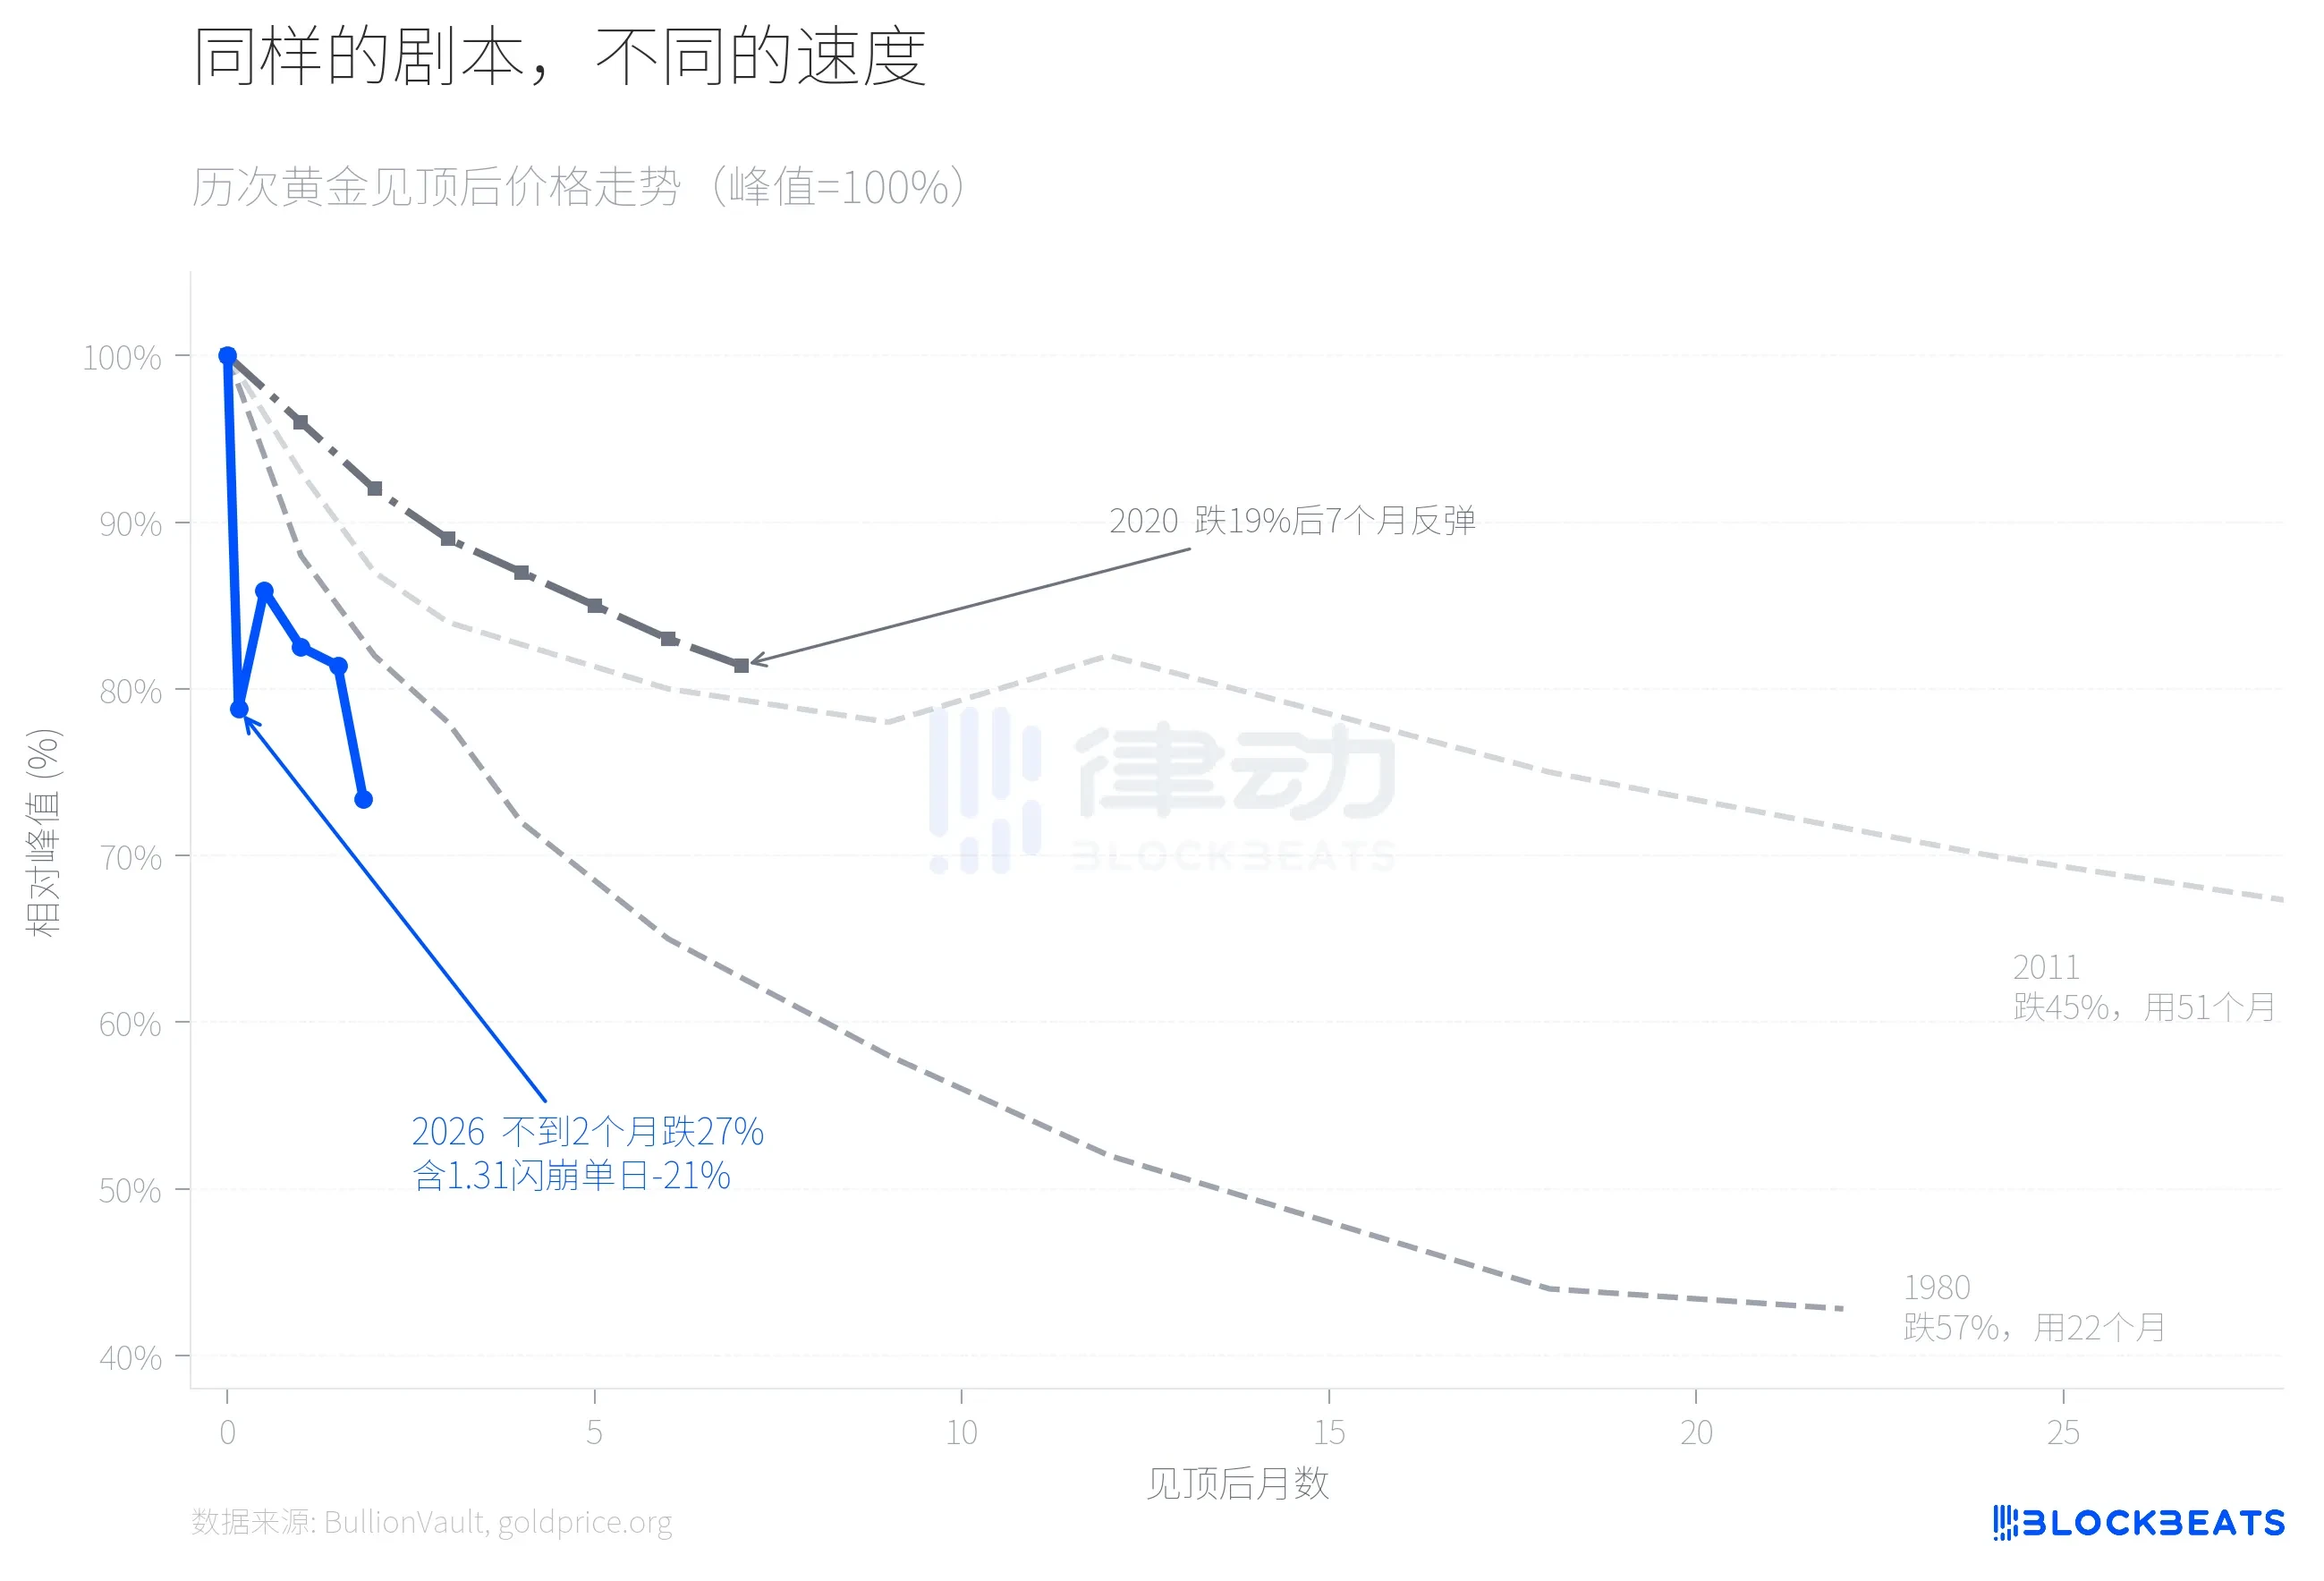
Overlaying the price movements of the four pullbacks reveals clear differences. 1980 took nearly two years to complete its major decline, 2011 took over four years. In 2026, gold completed a 21% retracement by the 5th trading day after peaking, followed by a brief rebound. However, it accelerated its decline again in the third week of March to around $4,100, expanding the cumulative drop to 27%. The flash crash on January 31st was the turning point. According to data from the world’s largest precious metals trading platform, BullionVault, gold fell over 10% that day, silver plummeted 13.7%, and the iShares Silver ETF (SLV) saw daily trading volume exceed $40 billion, ranking among the highest single-day trading volumes in U.S. securities history. Bruce Ikemizu, former head of ICBC’s Tokyo precious metals business, commented that after observing this market for 40 years, he had “never seen volatility of this magnitude.”
Why was the speed exceptionally fast this time? A key variable was CME’s change on January 13th from a fixed-amount to a percentage-of-contract-value margin system for COMEX. According to CME Group data, gold futures margins were raised from 8% to 9%, and silver from 15% to 18%. In a rapidly rising market, a percentage-based margin system means higher prices require more margin, creating a self-reinforcing deleveraging mechanism. According to goldsilver.com, over 67 million ounces of silver paper contracts were forcibly liquidated within minutes on the day of the flash crash.
Silver’s performance is a neglected dimension of this plunge.
In April 2025, the gold-to-silver ratio once exceeded 100:1, with silver severely lagging behind gold. Silver then began a massive rally, gaining 147% for the year (compared to gold’s 67%). The gold-to-silver ratio compressed steadily, dropping to about 46:1 when silver peaked at $121.67 per ounce, its lowest level since 2013.
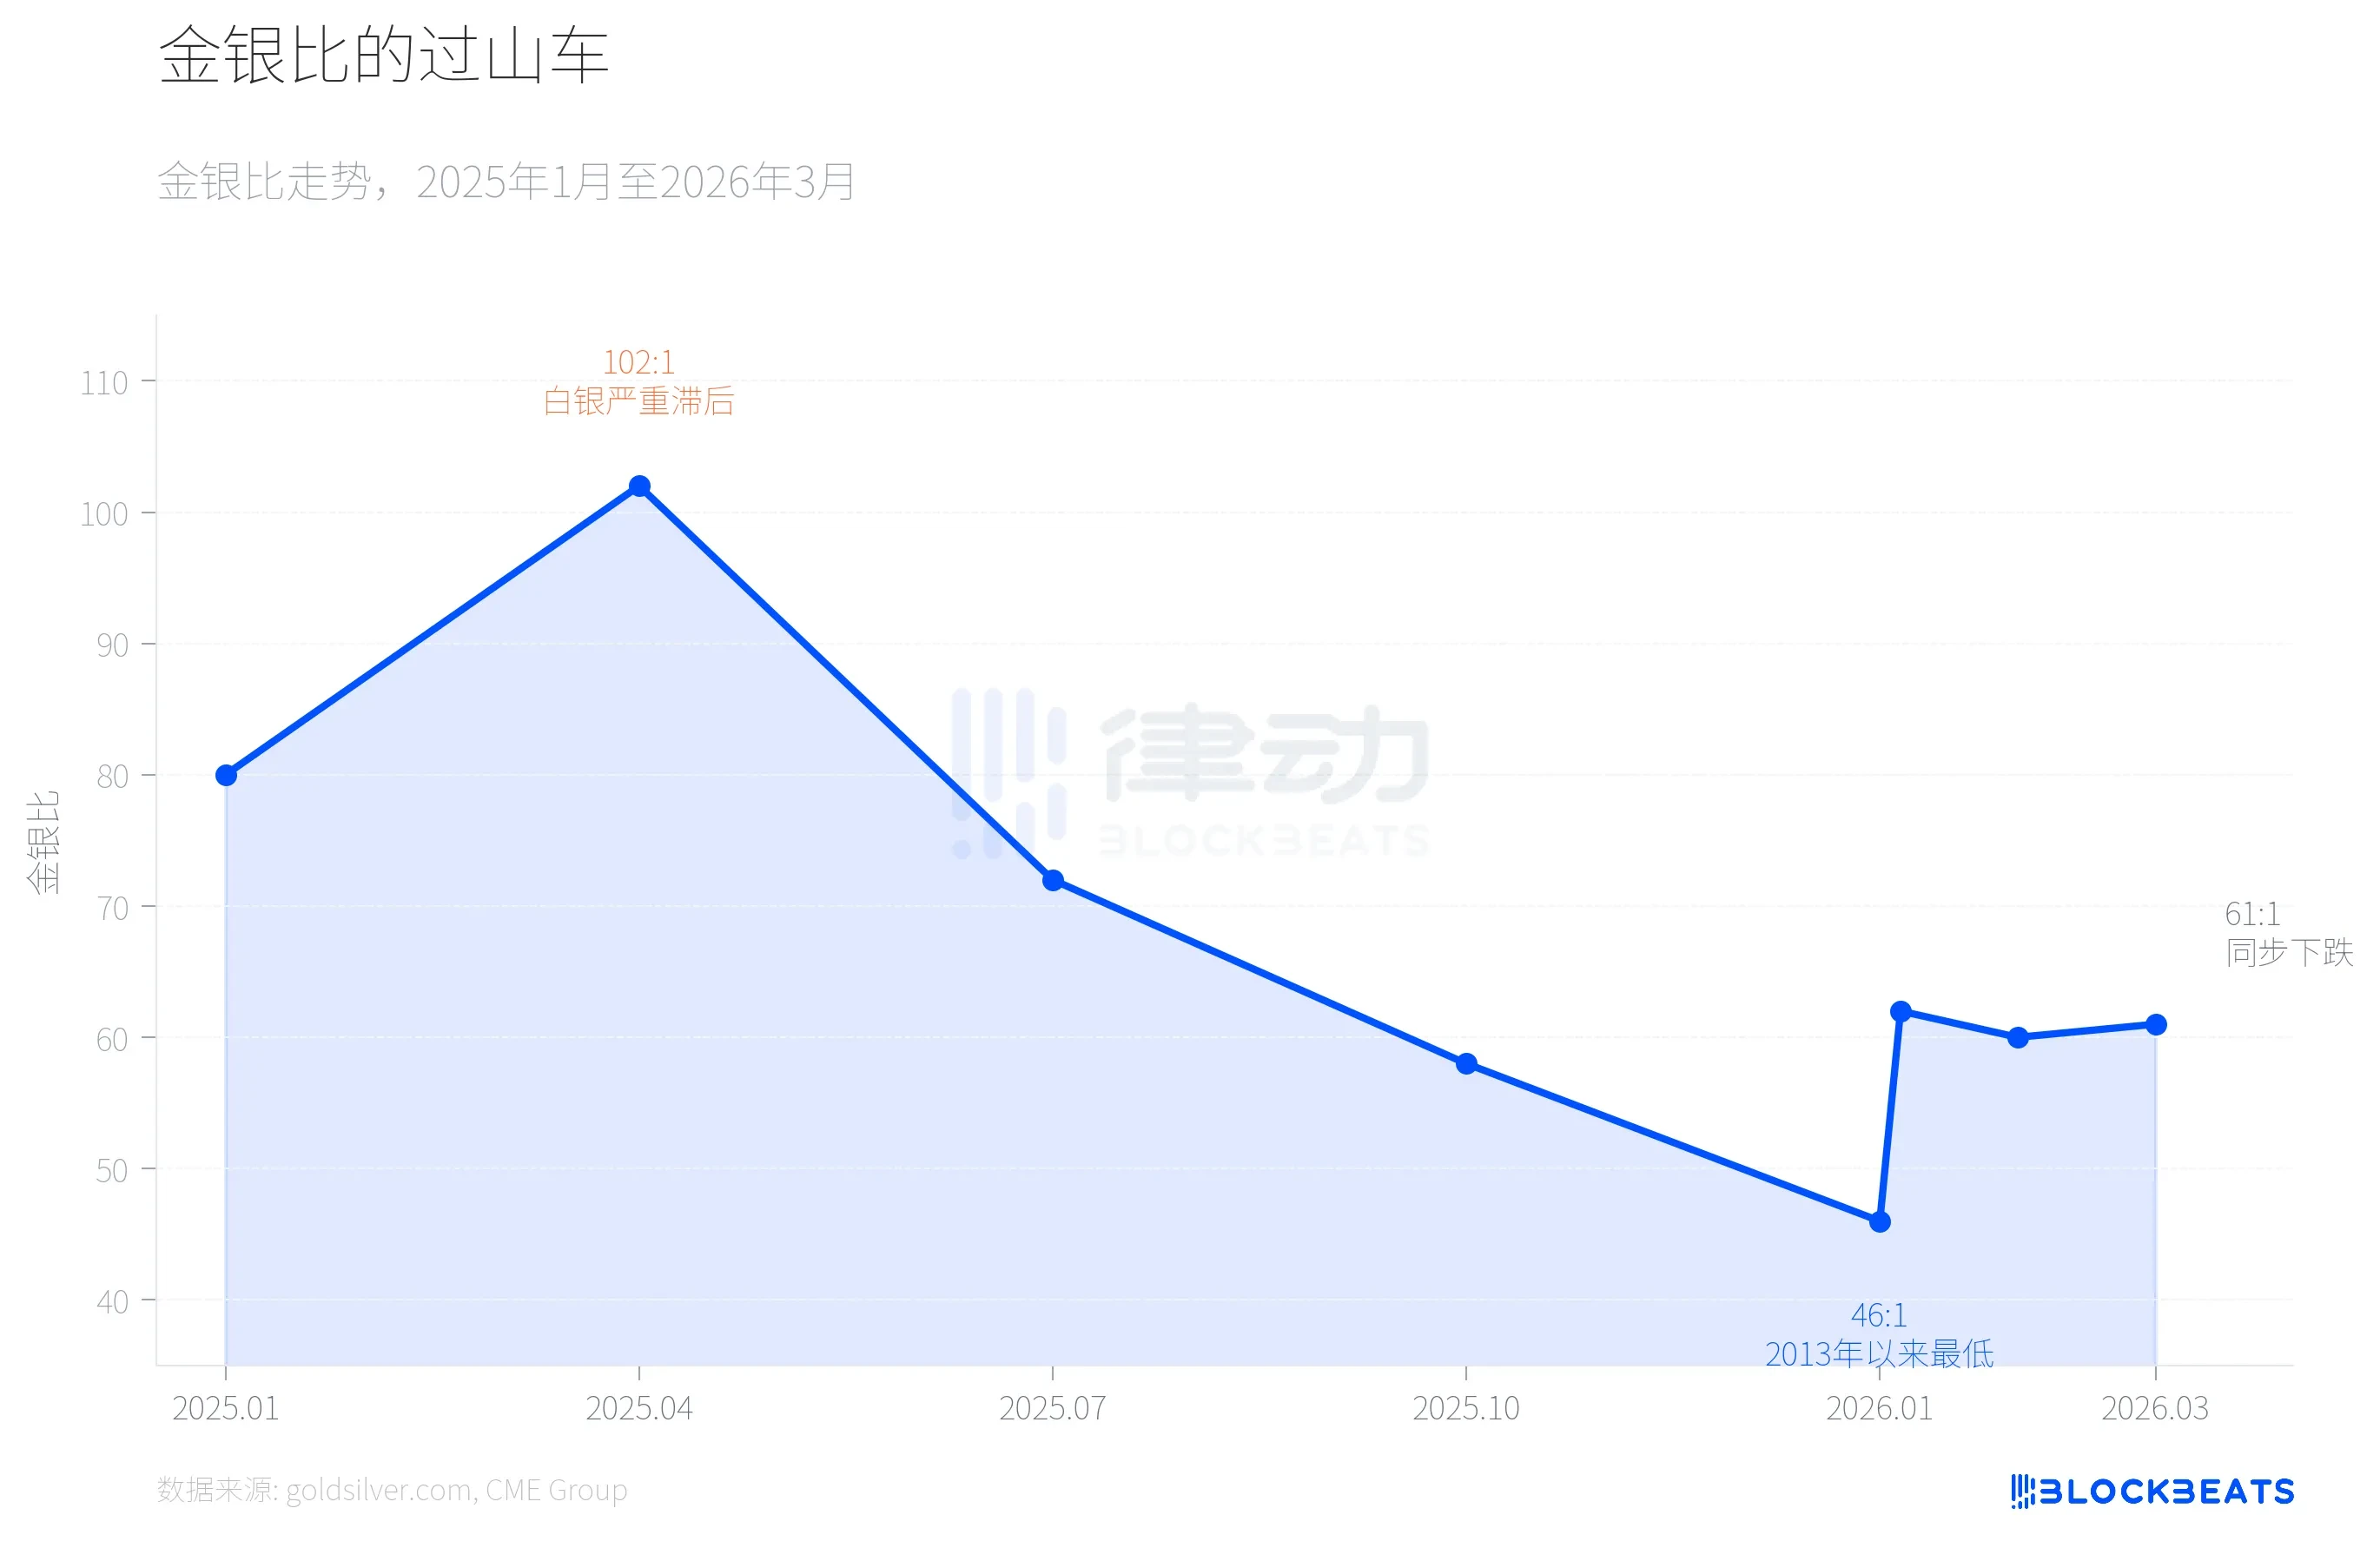
Then everything reversed on January 31st. According to platform data, silver plunged 13.7% in a single day, with a cumulative drop from its $121.67 peak reaching 41.1% at one point, far exceeding gold’s 26.6% decline over the same period. This represents rare single-day volatility in precious metals since the 1980 Hunt brothers incident (“Silver Thursday”). As of March 23rd, silver trades around $67.4, and the gold-to-silver ratio has rebounded from its low of 46:1 to about 61:1. The gains silver made over 9 months were largely erased in less than 2 months.
The core reason for this asymmetry lies in silver’s dual nature. On one hand, according to a CME Group research report, photovoltaic panel capacity grew 18% year-on-year, indicating silver’s industrial demand is still structurally expanding. On the other hand, leverage in the silver market is far higher than in gold. CME’s margin increase from 15% to 18% directly triggered large-scale forced liquidations. The industrial fundamentals haven’t changed, but the financial leverage collapsed first.
The final noteworthy signal is the divergence in fund flows.
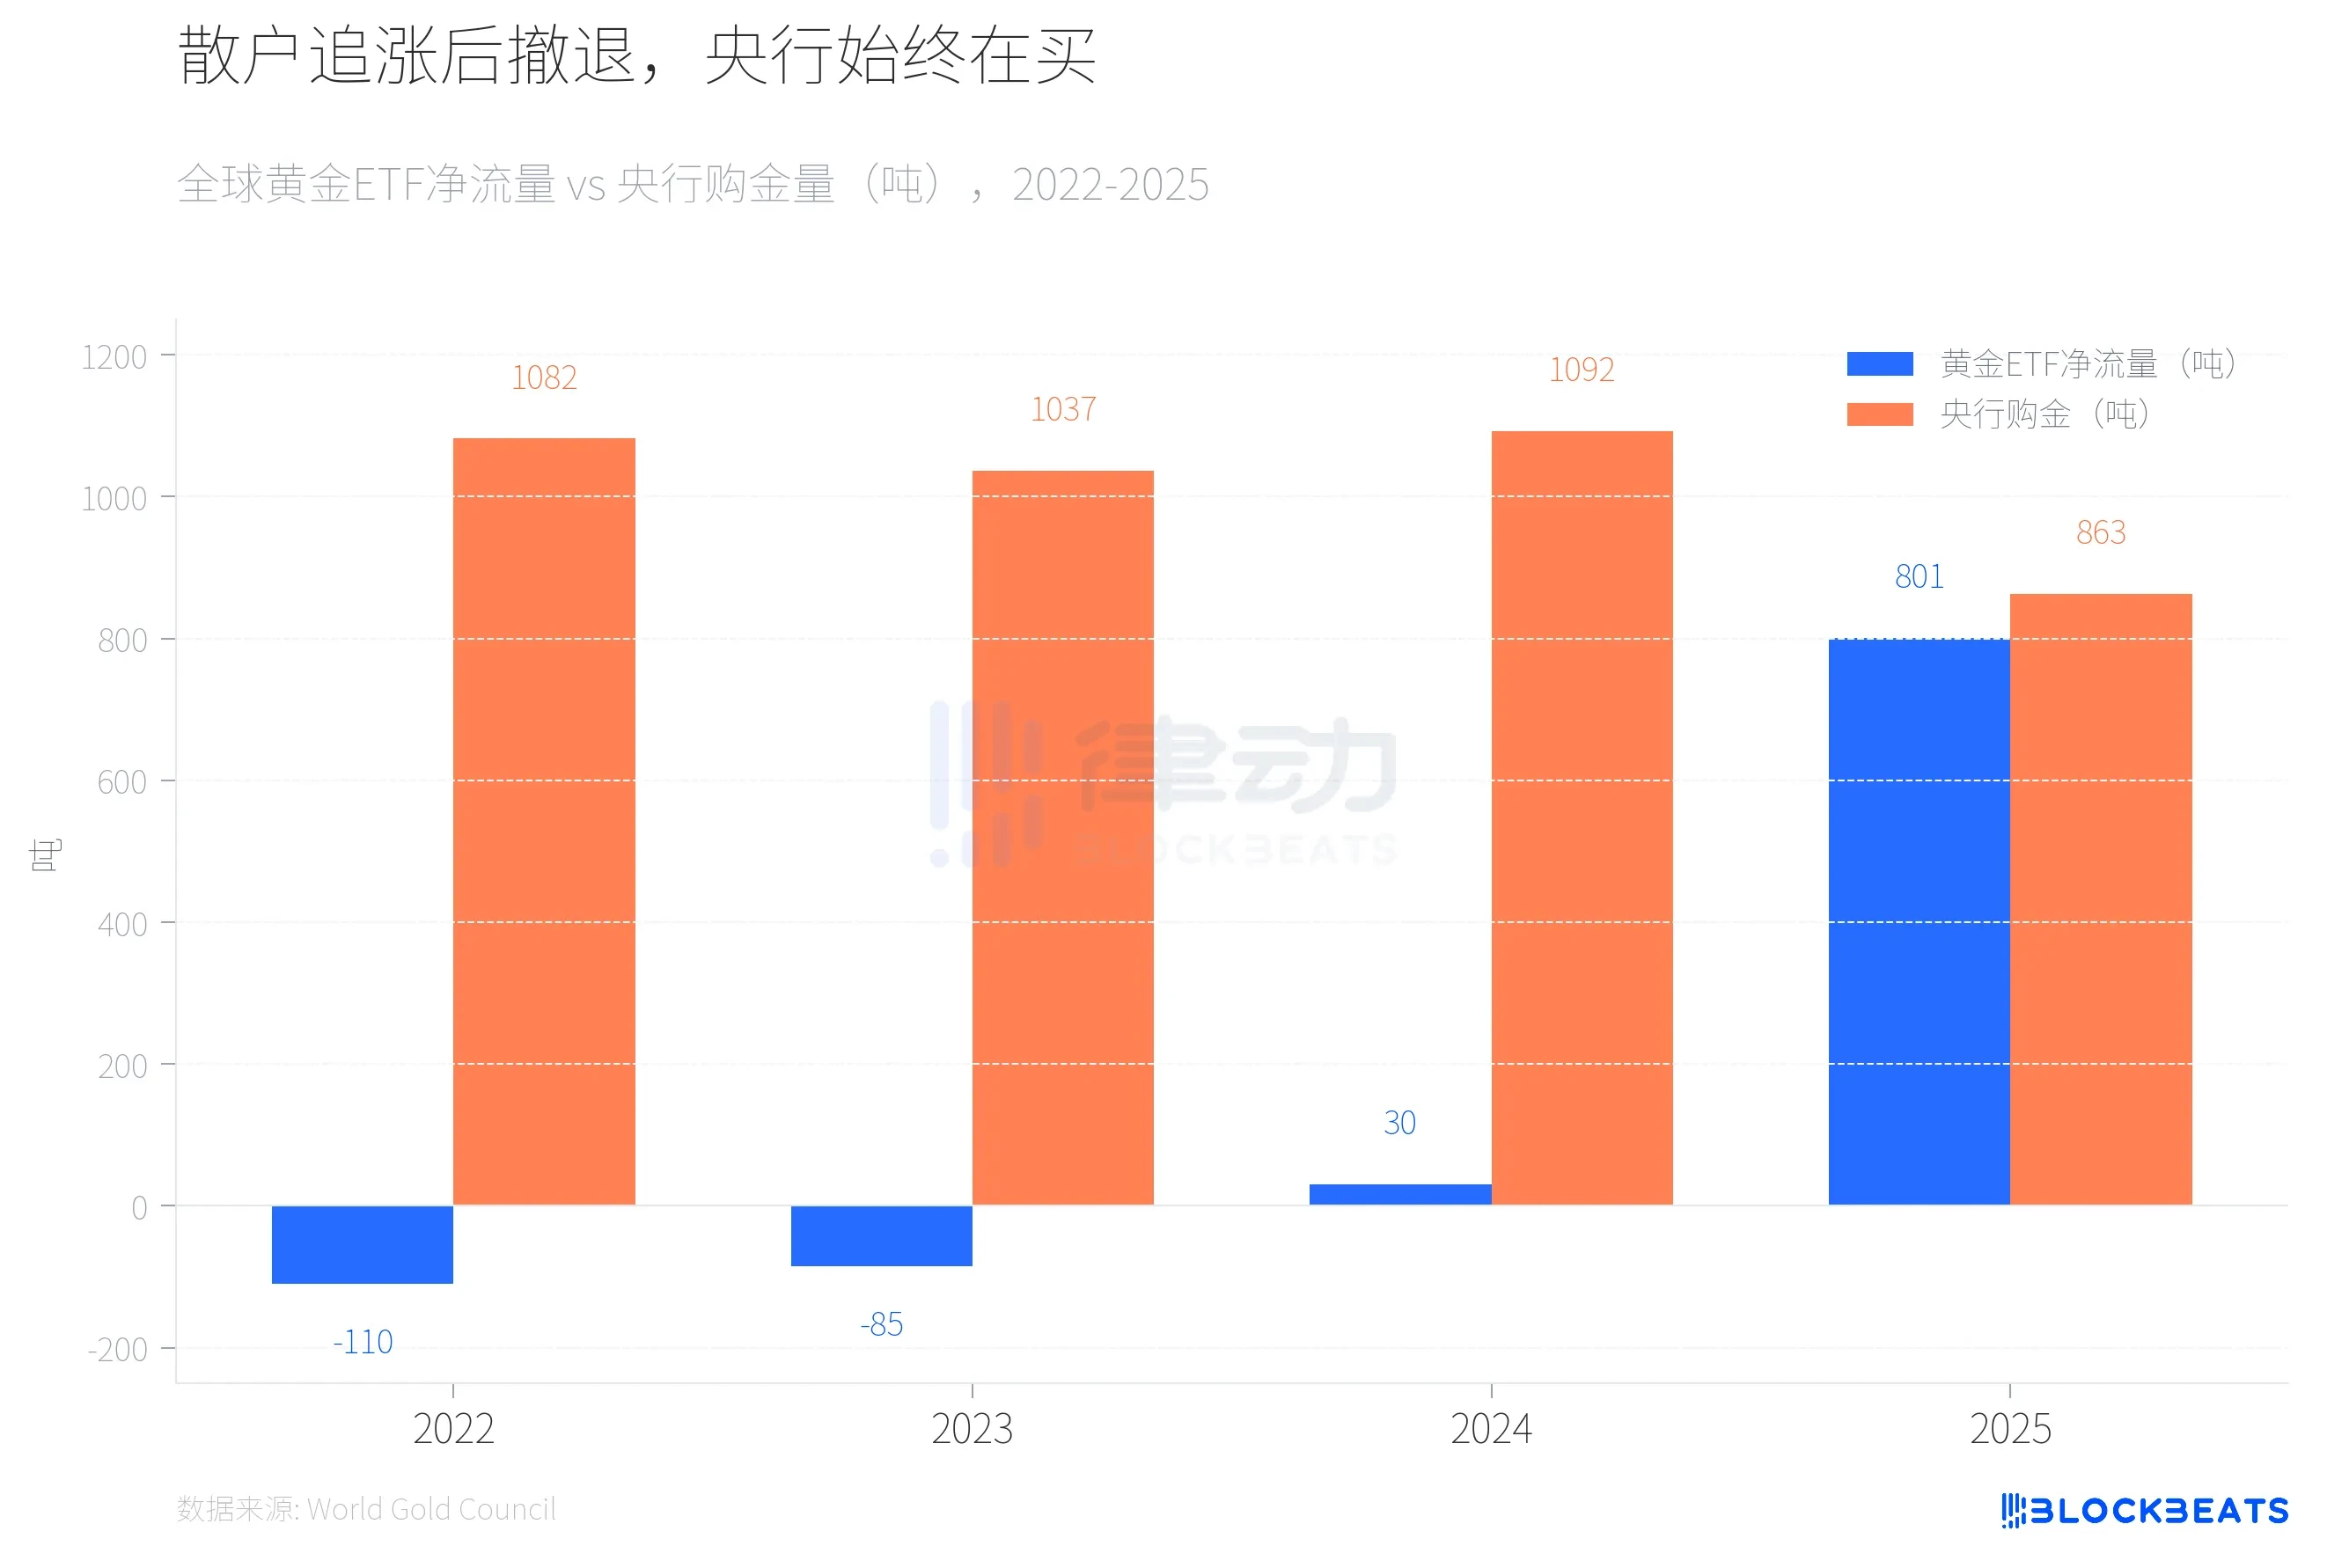
From 2022 to 2023, global gold ETFs saw net outflows for two consecutive years (-110 tonnes and -85 tonnes respectively), while central bank purchases exceeded 1,000 tonnes for two years. In 2024, ETF flows turned positive but were small (30 tonnes), while central banks continued buying at a high level of 1,092 tonnes. The situation changed dramatically in 2025. According to World Gold Council data, global gold ETFs saw a record net inflow of 801 tonnes for the year, with assets under management doubling to $559 billion.
Then retail money started fleeing. According to Canadian business media Chronicle Journal, the SPDR Gold Trust (GLD) saw a single-day net outflow of $2.91 billion on March 4th, the largest daily outflow since 2016, losing 25 tonnes of gold in 7 days. Meanwhile, according to the institution’s annual report, global central banks purchased 863 tonnes of gold in 2025, down 21% from 2024 but still well above the 2010-2021 average (473 tonnes). The same report shows Poland’s central bank, with purchases of 102 tonnes, was the world’s largest buyer for the second consecutive year, followed by Kazakhstan (57 tonnes) and Brazil (43 tonnes).
According to a J.P. Morgan research report in March, the bank maintains its year-end 2026 gold price target of $6,300. However, according to the IEA’s March oil market report, the blockade of the Strait of Hormuz has reduced global crude oil supply by about 8 million barrels per day, equivalent to nearly 8% of global demand. The IEA called it “the largest supply shock in the history of the global oil market,” and member countries have initiated the largest-ever strategic reserve release of 400 million barrels.
For oil-importing central banks, responding to the oil price shock may take priority over further gold accumulation. In the previous three peaks, global central banks were not net buyers of gold. They bought 863 tonnes in 2025, but the 2026 figure is still unknown.
Artikel ini bersumber dari internet: 43-Year Worst Plunge, Has Gold Peaked or Is It the Same Old Script?
Related: What’s Happening with Ethereum?
Original Author: @paramonoww Original Compilation: Peggy, BlockBeats Editor’s Note: Recently, Vitalik Buterin published a lengthy article pointing out that with the significant improvement in Ethereum L1’s scaling capabilities and the long-term lag in L2’s evolution towards “Stage 2,” the past vision of viewing L2s as “Ethereum-branded shards” is no longer tenable. He emphasized that L1 is accelerating its return to the core focus of scaling, no longer needing L2s as a “crutch” for performance expansion. This rewriting of the L2 positioning has sparked widespread discussion in the community. Beyond price, this article shifts the focus back to Ethereum itself: from the fading of the “ultrasound money” narrative and the wavering Rollup roadmap, to the lack of financial incentives and the loss of core talent, the problems do not stem from…


