BTC Hovers at $80,000: Bulls Poised for a Breakout or Bears Ready to Strike?
Author|jk
Since Bitcoin hit an all-time high of $126,198 in October 2025, it has endured a prolonged seven-month downturn and consolidation. Entering May 2026, BTC has formed a highly condensed battle zone between bulls and bears around the $80,000 mark. Signals of accumulation from bulls and liquidation pressure from bears are simultaneously appearing with rare intensity at the same price level.
As of press time, BTC is trading around $80,832, with the market at a critical tipping point: breakout or a second decline?
The Bull Case: On-Chain Data Almost Universally Points to an Accumulation Bottom
Evidence supporting the bulls is primarily concentrated in two areas: supply-side contraction और institutional demand.
On the supply side, BTC reserves on exchanges have fallen to 2.21 million coins, the lowest in seven years since December 2017. Long-term holders account for 78.3% of the total supply, and whale wallets net accumulated approximately 270,000 BTC in April. Liquid supply readily available for selling has compressed to historical lows. If new demand continues to enter the market, price sensitivity to capital inflows could increase further.
On the demand side and institutional front, U.S. spot BTC ETFs saw net inflows of $2.44 billion in April, the strongest month since October 2025, with BlackRock’s IBIT accounting for about 70% ($1.71 billion). Strategy (formerly MicroStrategy) holds 818,334 BTC at an average cost of $75,537, with an unrealized profit exceeding 7%. Saylor posted a “back to work” message on May 10, which the market interpreted as a signal for continued accumulation. JPMorgan estimates that Strategy’s total BTC purchases this year could reach $30 billion.
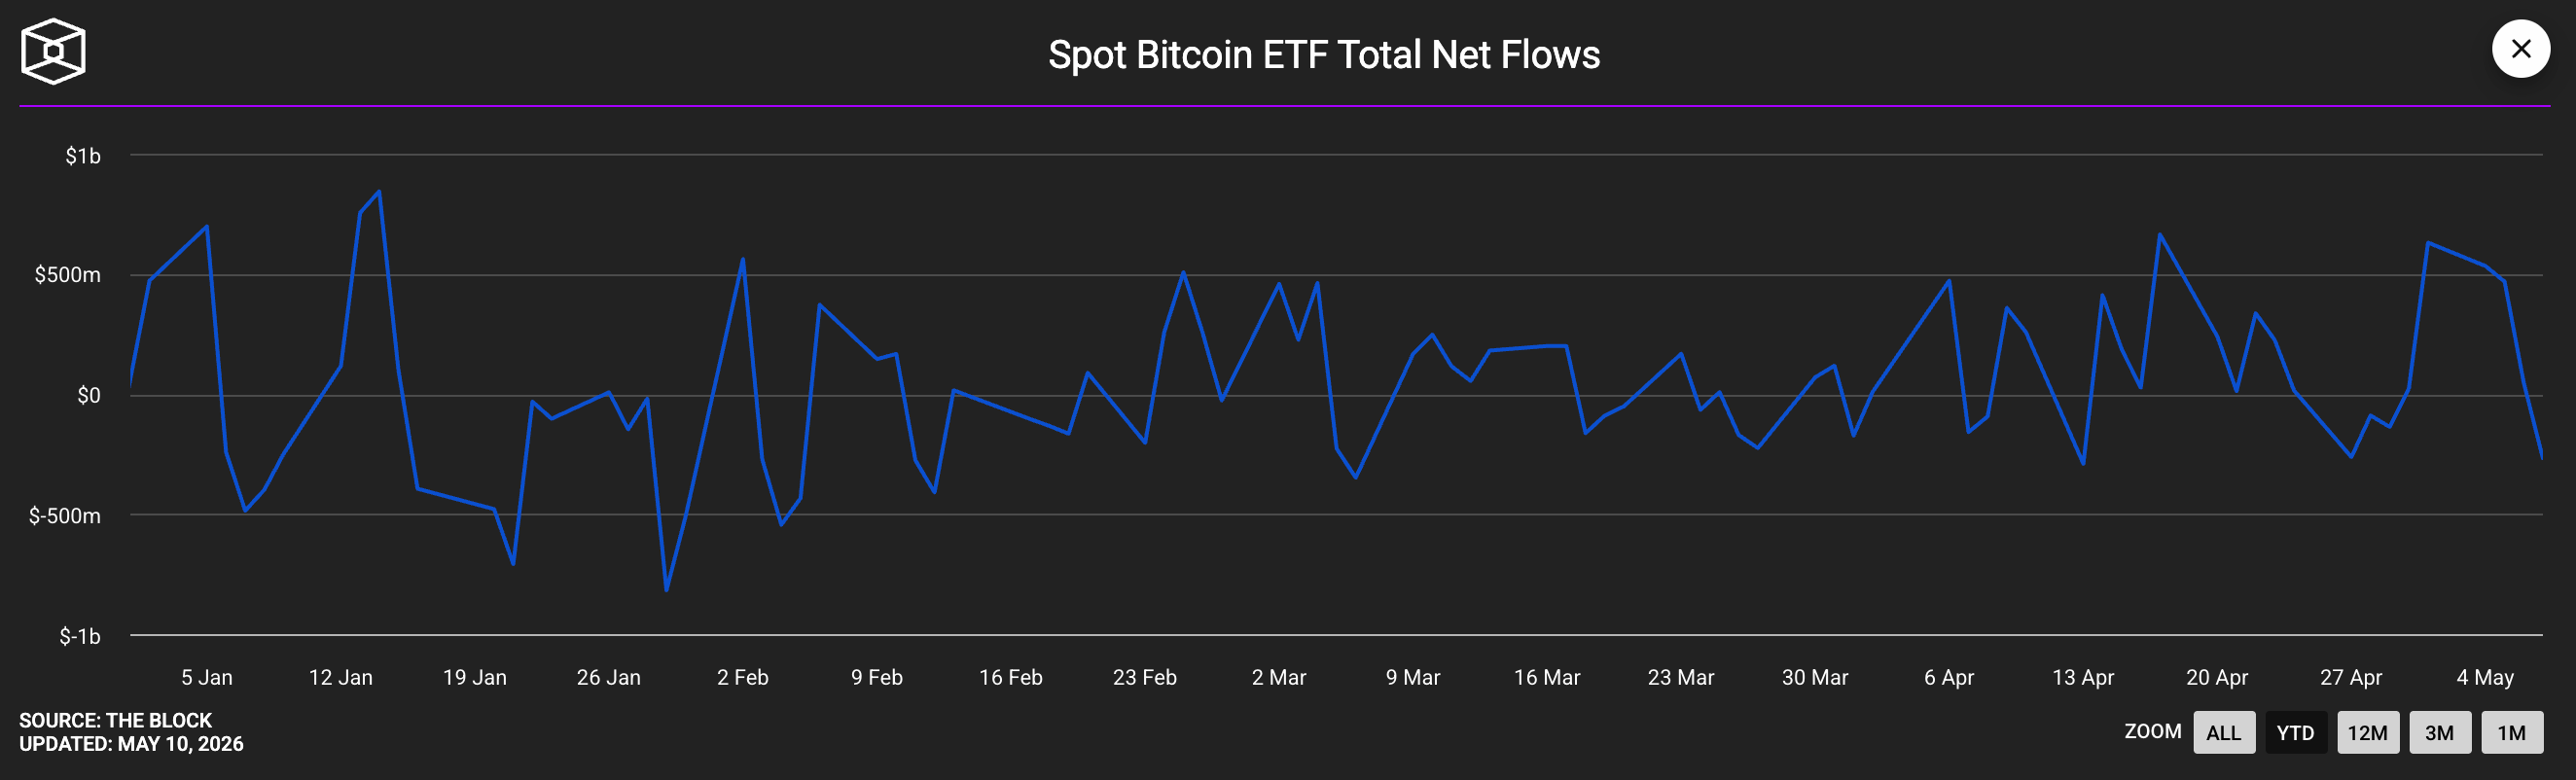
Bitcoin ETF inflow data, Source: The Block
Valuation metrics are also unusually low. The MVRV Z-Score is only 0.91, a range historically recognized as a strategic accumulation window; the RHODL ratio is 4.5, the third highest in Bitcoin’s history. This has only occurred twice before, in 2015 and 2020, both of which marked cyclical bottoms.
Glassnode data shows that Bitcoin has reclaimed the Realized Price near $78,200 and the Short-Term Holder Cost Basis near $79,100. These two levels are critical for market structure. If prices remain above them, it indicates that recent buyers are returning to profitability, shifting market sentiment from loss-driven selling pressure to a gradual recovery of holding confidence.
On the macro front, the 30-day correlation coefficient between BTC and the U.S. Dollar Index (DXY) hit -0.90 in late April, the most extreme negative correlation level since September 2022. If the dollar continues to weaken, it will provide near-mechanical price support for BTC.
Pressure from the Bears: Seven Rejections, Miner Selling, and Abnormal Derivatives Structure
However, resistance of equal intensity to the accumulation signals is coming from the opposite direction.
Regarding liquidation pressure, Glassnode data shows that the 14-day moving average of Realized Losses remains at $479 million per day, 140% above the cyclical baseline of $200 million. Historical experience suggests that this figure must first compress below the baseline before a bull run can begin. Currently, about 43% of Bitcoin on the network is in unrealized loss, and the number of wallet addresses holding BTC for less than 5 days decreased by 245,000, the fastest rate of attrition in nearly two years. The cost basis of Newborn Whales (holding period less than 155 days) is approximately $80,300. BTC must sustain trading above this level to turn these holdings profitable; otherwise, it faces constant selling pressure from holders looking to break even.
The derivatives market structure also signals from this side: On April 27, the 30-day average perpetual funding rate was -5%, compared to a historical normal level of +8%, and this metric has only just turned positive. The BTC long/short ratio on Binance stands at just 36.7% long / 63.3% short, making it the most crowded short structure among major assets. 10x Research analyst Markus Thielen clearly stated that this abnormal funding rate indicates institutions are shorting futures to hedge against ETF long positions, creating systematic downward pressure, and could be a signal to further liquidate short-term longs. Glassnode reports that nearly $2 billion in negative gamma options positions are concentrated near the $82,000 strike price, with market makers’ hedging behavior likely amplifying two-way volatility around that level.
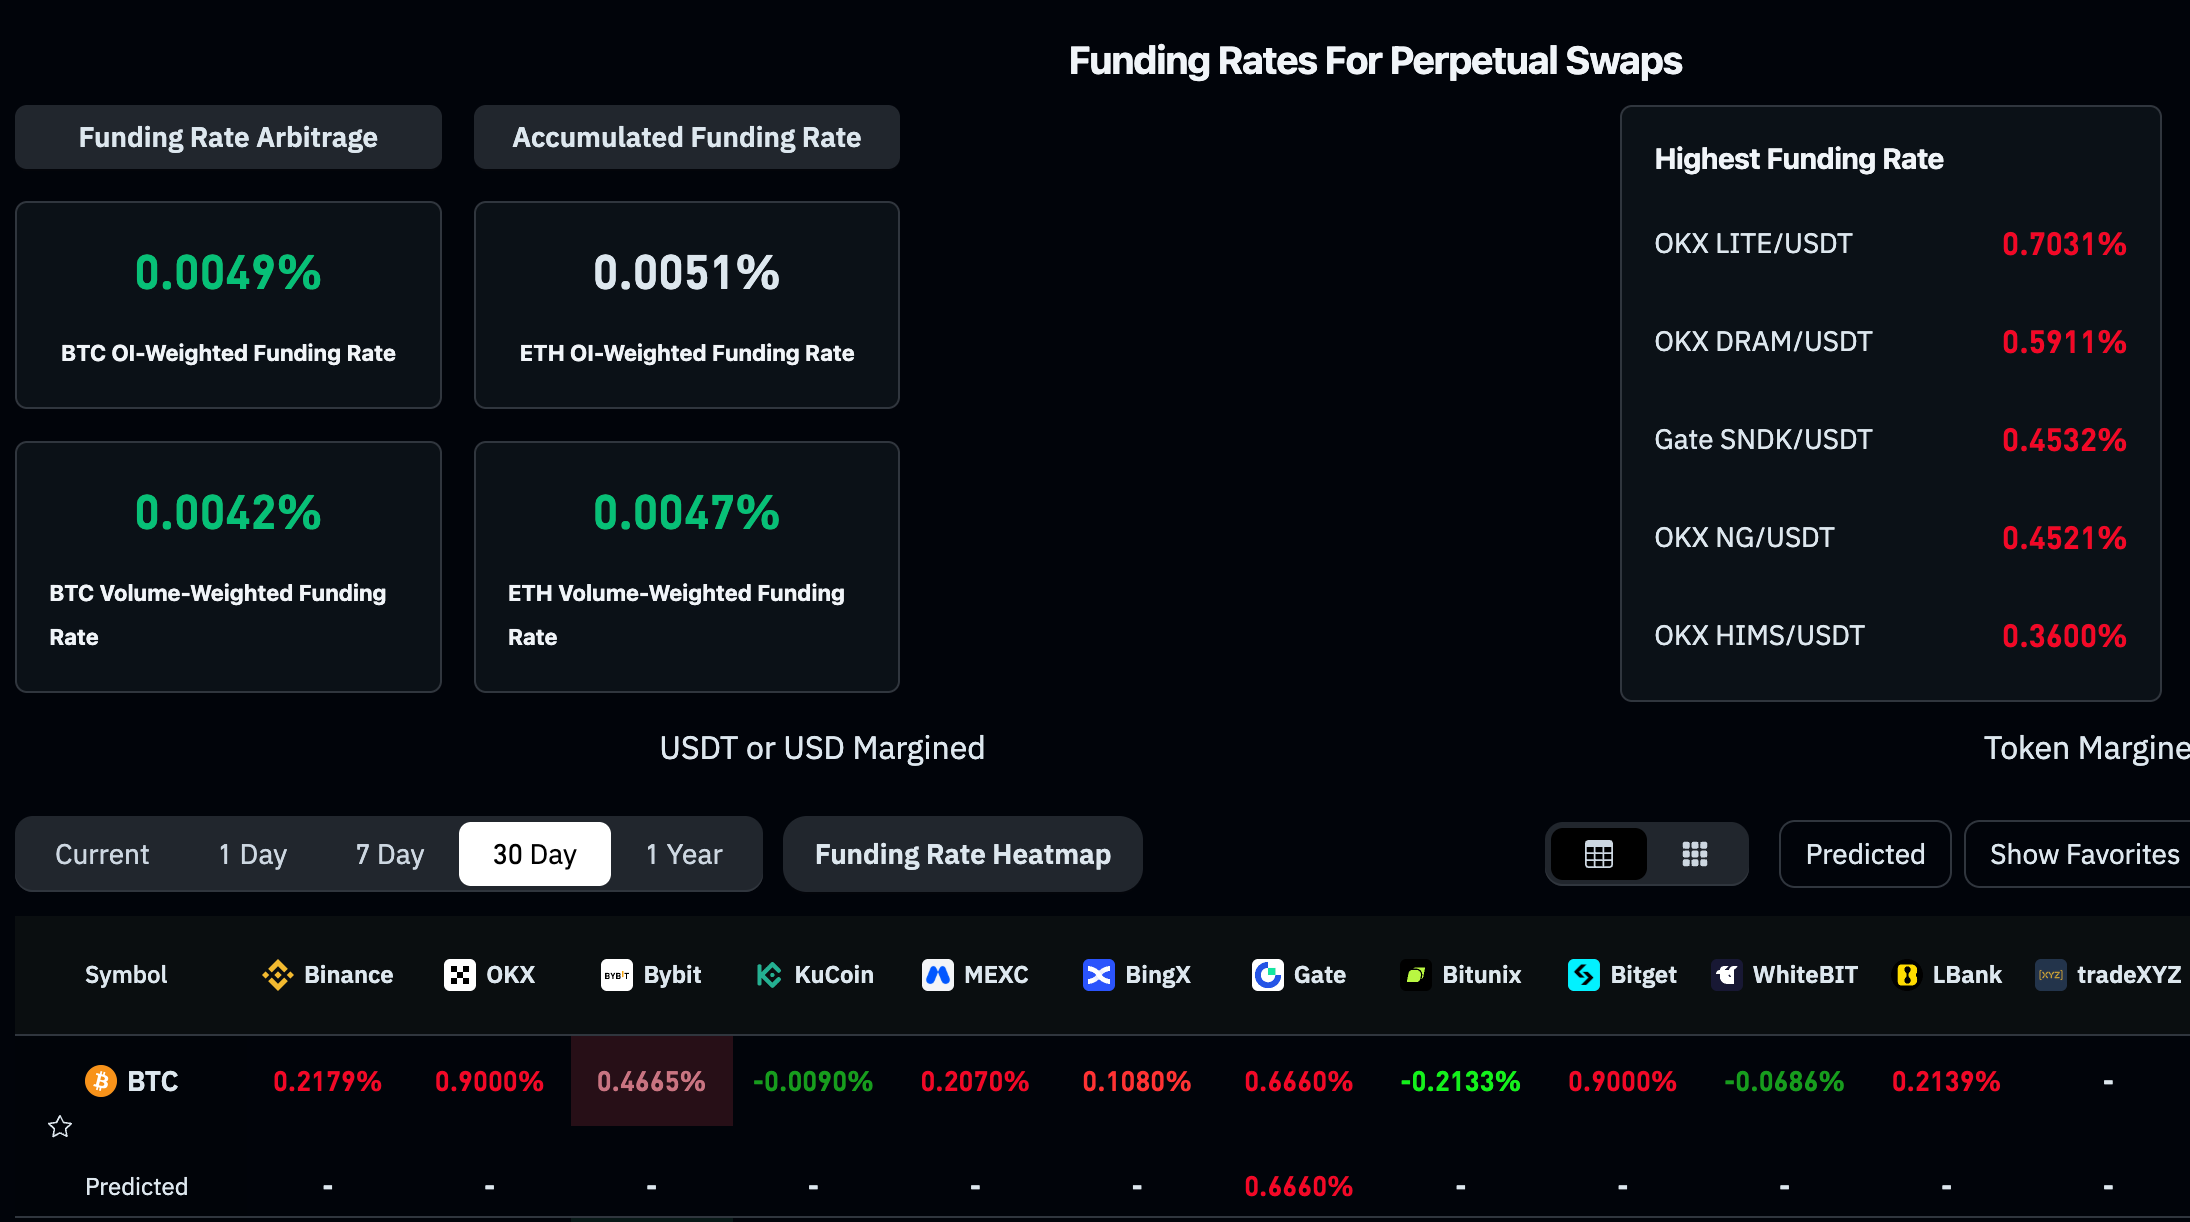
The 30-day average funding rate has just turned positive. Source: Coinglass
On the seller pressure front, listed mining companies sold over 32,000 BTC in the first quarter of 2026, exceeding the total for the entire year of 2025. Bitdeer completely liquidated its 1,132.9 BTC reserve in February. Cango sold 4,451 BTC (approximately $305 million) on February 9, and Core Scientific has also been consistently liquidating its reserves. On-chain data shows that approximately 3,400 BTC have flowed out from miner reserves since April 7, as mining companies capitalize on this rebound. If miner selling pressure persists and ETF inflows fail to offset it continuously, the price stability near $80,000 will face challenges.
Institutional Perspectives: Analyst Voices
The divergence between bulls and bears is also reflected in Wall Street’s year-end price targets, which exhibit a level of dispersion rarely seen this cycle.
Tom Lee, at the Consensus conference in Miami on May 7, offered the most optimistic assessment: “If Bitcoin closes the month above $76,000, the bear market is unequivocally over. You have never been in a bear market with three consecutive positive monthly returns.” His year-end target range is $150,000 – $250,000.

Tom Lee at the just-concluded Consensus conference. Source: Coindesk
Bernstein analyst Gautam Chhugani reiterated a $150,000 target on May 5, stating that “the current bear market logic is the weakest in Bitcoin’s history, and the best days for क्रिप्टोcurrency are still ahead.” JPMorgan, meanwhile, holds a positive view on the 2026 क्रिप्टो market, believing it will be more driven by institutional investors rather than retail, and has lowered its BTC production cost soft support from $90,000 to $77,000.
On the other side, Standard Chartered’s Geoffrey Kendrick lowered his year-end target from $150,000 to $100,000 in February this year, warning of a potential “final washout phase” where BTC could slide toward $50,000 before establishing a durable bottom. Citigroup lowered its target from $143,000 to $112,000 in March, suggesting BTC is more likely to trade in a range in the near term, awaiting legislative progress like the CLARITY Act. SkyBridge’s Anthony Scaramucci explicitly stated that a significant BTC recovery might have to wait until Q4 2026.
Key Judgment Factors
Among all the observed indicators, two are currently the most decisive:
पहला, whether the 200-day EMA holds. BTC has just reclaimed this moving average. If it falls back and the weekly close breaks below it, this reclaim will be characterized as a fakeout. The Short-Term Holder Cost Basis of $79,100 and the Realized Price of $78,200 will be two key support levels for bulls. If $74,300 is lost, the extreme scenario of $50,000 – $60,000 warned by Standard Chartered would come back into view.
Second, whether it can break through Glassnode’s Active Realized Price of $85,200. This is the next significant on-chain resistance level identified in Glassnode’s Week 18 report. A weekly close above this level would confirm a trend reversal signal.
The combination of these several indicators will provide an answer within the next two to three weeks.
यह लेख इंटरनेट से लिया गया है: BTC Hovers at $80,000: Bulls Poised for a Breakout or Bears Ready to Strike?
From a trading signal perspective, both quantitative and trend models have recently turned stronger simultaneously. Historical data shows that after the last 10 instances of similar signals being triggered, gold’s average increase over the subsequent two months was approximately 12.8%, corresponding to a target price of around $5,306, with a historical win rate of about 70%. Meanwhile, the DXY attempted to break above the 100 mark three times in July 2025, November 2025, and March 2026, each time failing, indicating that the momentum for a US dollar rebound is weakening. Against this backdrop, this article believes this correction is closer to a phase adjustment rather than a trend reversal. Repricing of the Dollar and Interest Rates: The Core Logic for Gold Remains Unchanged Over the coming months, the core variable…


