
These three altcoins exhibit bullish formations against Bitcoin (BTC) and could outperform it in March 2024.
भले ही बीटीसी तेजी से एक नई सर्वकालिक ऊंचाई की ओर बढ़ रही है, निम्नलिखित altcoins में इसके खिलाफ तेजी की संरचना है।
सोलाना (एसओएल) की कीमत में समर्थन उछाल आया
The weekly time frame outlook shows that SOL has increased swiftly since breaking out from a long-term descending resistance trend line and validating it as support (green icon) on September 2023. The increase led to a high of ₿0.0029 in December 2023. Even though SOL fell slightly after the high, it bounced at the ₿0.0020 horizontal area this week.
The wave count suggests that wave four is complete. Elliott Wave theory involves the analysis of recurring long-term price patterns and investor psychology to determine the direction of a trend. According to the wave count, the SOL price has just started wave four and will increase by another 100% to the next resistance at ₿0.0040.
और पढ़ें: सोलाना (एसओएल) कैसे खरीदें और वह सब कुछ जो आपको जानना आवश्यक है
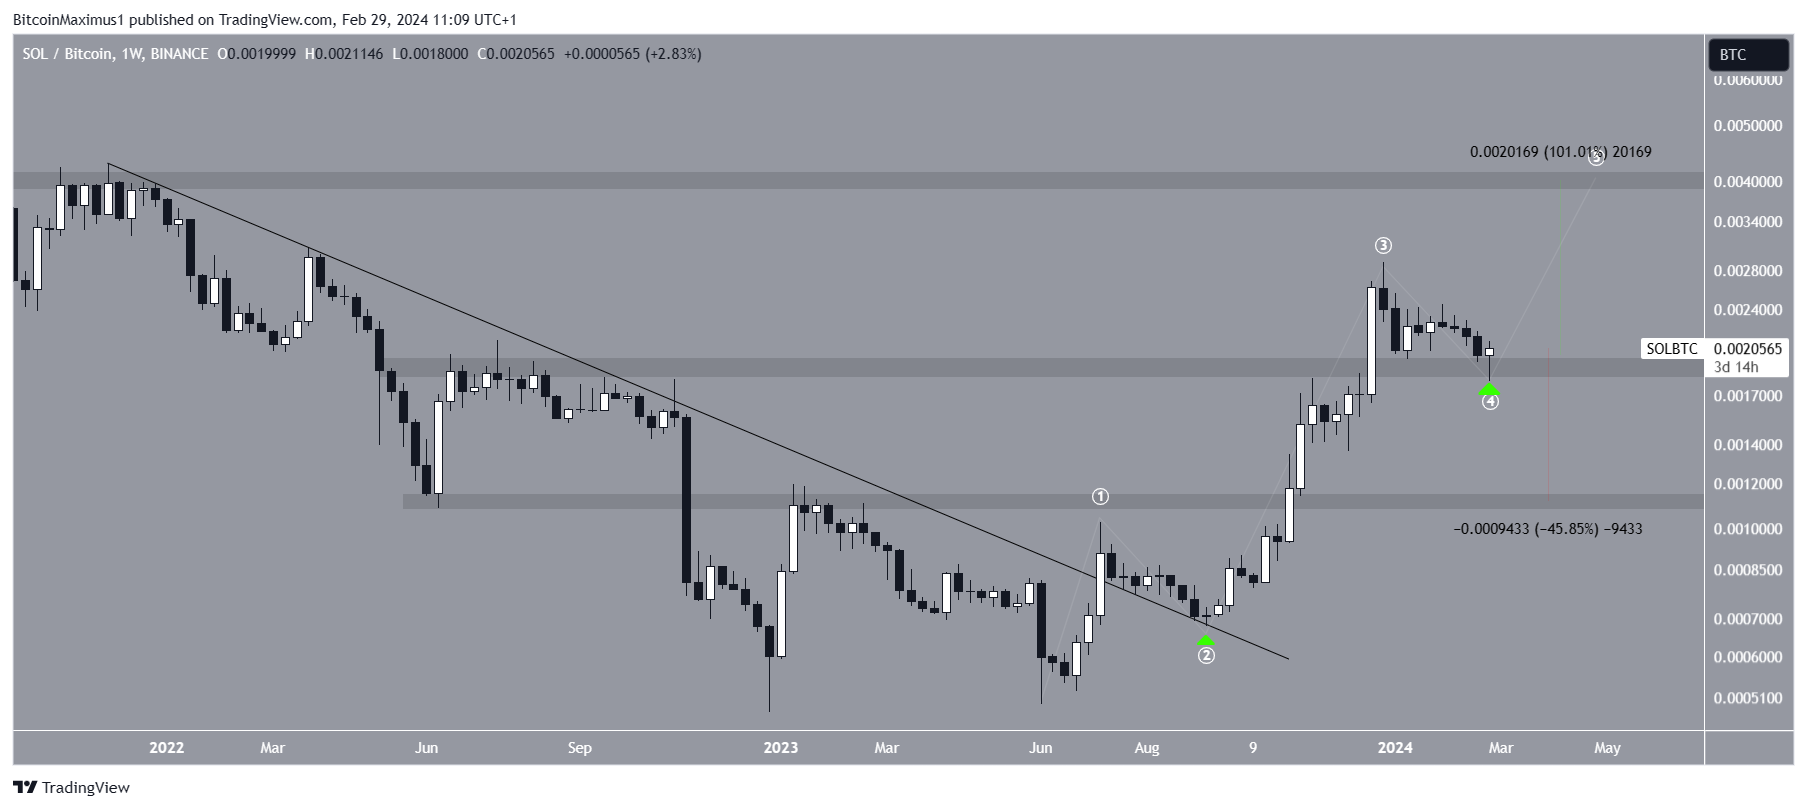
Despite the bullish SOL price prediction, closing below the ₿0.040 area will invalidate the count and can trigger a 45% drop to the closest support at ₿0.0011.
डॉगकॉइन (DOGE) बुलिश डाइवर्जेंस बनाता है
अक्टूबर 2022 से डॉगकॉइन की कीमत गिरती प्रतिरोध प्रवृत्ति रेखा के नीचे आ गई है। इस गिरावट के कारण इस सप्ताह 157 सातोशी कम हो गई। हालाँकि, DOGE की कीमत में उछाल आया और एक बड़ी तेजी वाली साप्ताहिक कैंडलस्टिक बनी। यदि साप्ताहिक समापन कायम रहता है, तो DOGE गिरती प्रतिरोध प्रवृत्ति रेखा से बाहर निकल जाएगा, जो 490 दिनों से मौजूद है।
A bullish divergence in the RSI preceded the bounce. Traders utilize the RSI as a momentum indicator to assess whether a market is overbought or oversold and whether to accumulate or sell an asset.
यदि आरएसआई रीडिंग 50 से ऊपर है और रुझान ऊपर की ओर है, तो बुल्स को अभी भी फायदा है, लेकिन यदि रीडिंग 50 से नीचे है, तो विपरीत सच है। तेजी से विचलन तब होता है जब कीमत में कमी के साथ गति में वृद्धि होती है। यह अक्सर तेजी की प्रवृत्ति में बदलाव की ओर ले जाता है।
और पढ़ें: डॉगकॉइन कैसे खरीदें (DOGE)
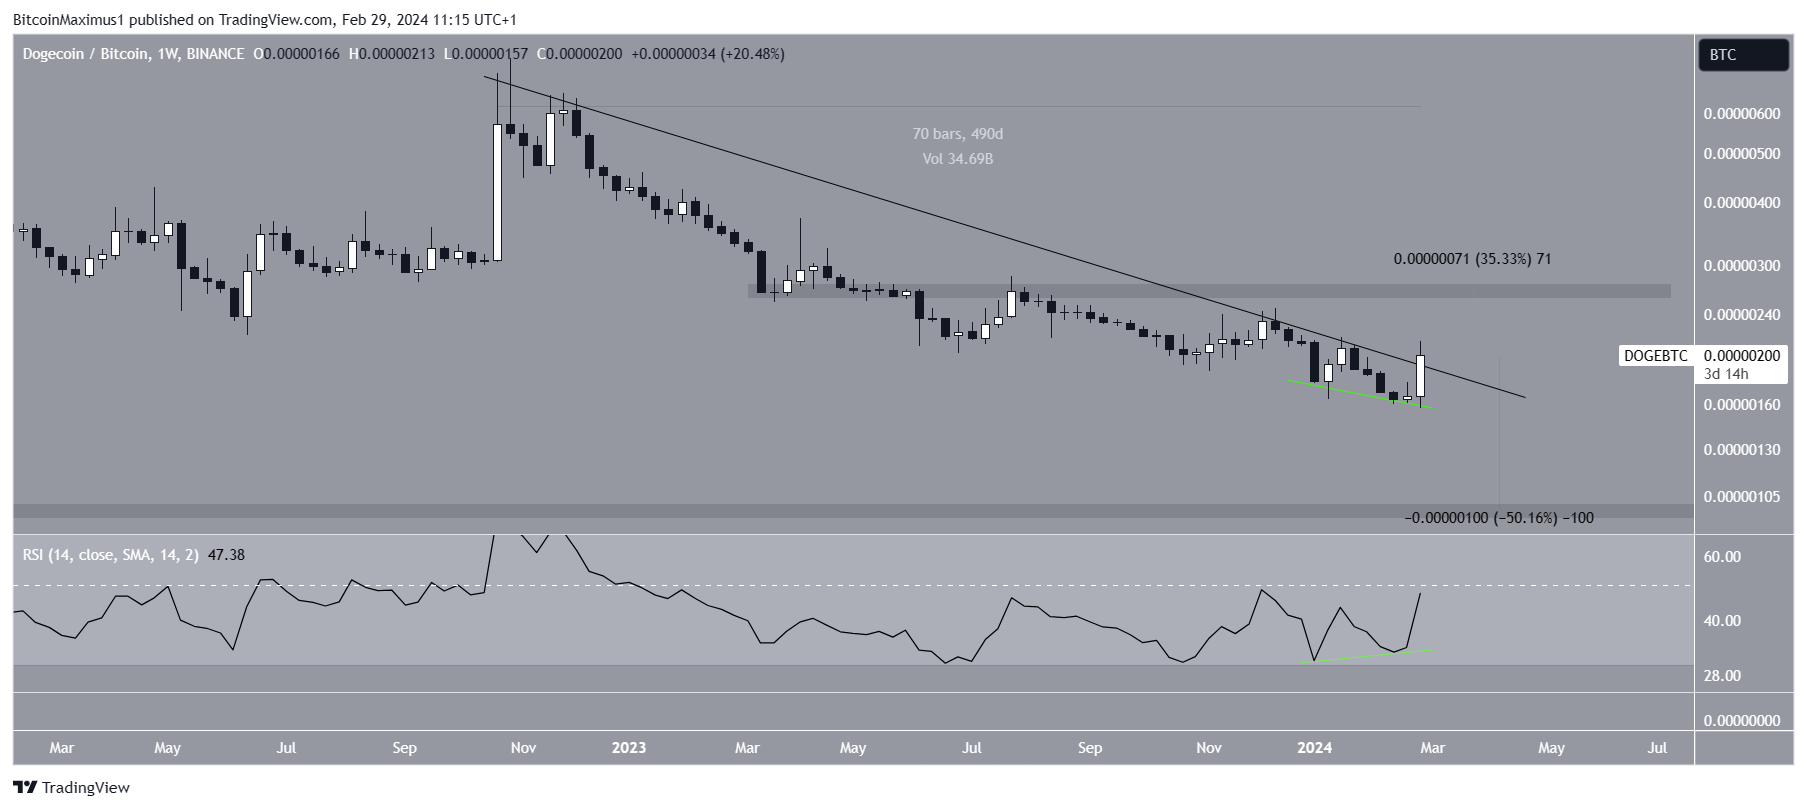
यदि DOGE ब्रेकआउट की पुष्टि करता है, तो यह 270 सातोशी पर अगले प्रतिरोध तक 35% तक बढ़ सकता है। तेजी से DOGE मूल्य भविष्यवाणी के बावजूद, ब्रेकआउट में विफलता के कारण 100 सातोशी के निकटतम समर्थन में 50% की गिरावट हो सकती है।
ग्राफ़ (जीआरटी) टूटता हुआ प्रतीत होता है
अंतिम altcoin जो BTC से बेहतर प्रदर्शन कर सकता है वह GRT है। जीआरटी की कीमत एक अवरोही प्रतिरोध प्रवृत्ति रेखा से टूट गई जो सर्वकालिक उच्च स्तर के बाद से मौजूद थी। ट्रेंड लाइन (हरा आइकन) पर उछाल के बाद, जीआरटी ने ऊपर की ओर बढ़ना शुरू किया जिससे 450 सातोशी प्रतिरोध क्षेत्र के ऊपर ब्रेकआउट हुआ।
ब्रेकआउट को 50 से ऊपर आरएसआई वृद्धि के साथ जोड़ा गया, जिससे यह वैध हो गया। इसलिए, यदि ऊपर की ओर गति जारी रहती है, तो ग्राफ 900 सातोशी पर अगले प्रतिरोध तक पहुंचने के लिए 90% तक बढ़ सकता है।
और पढ़ें: फ्यूचर्स कॉपी ट्रेडिंग के लिए 8 सर्वश्रेष्ठ क्रिप्टो प्लेटफ़ॉर्म
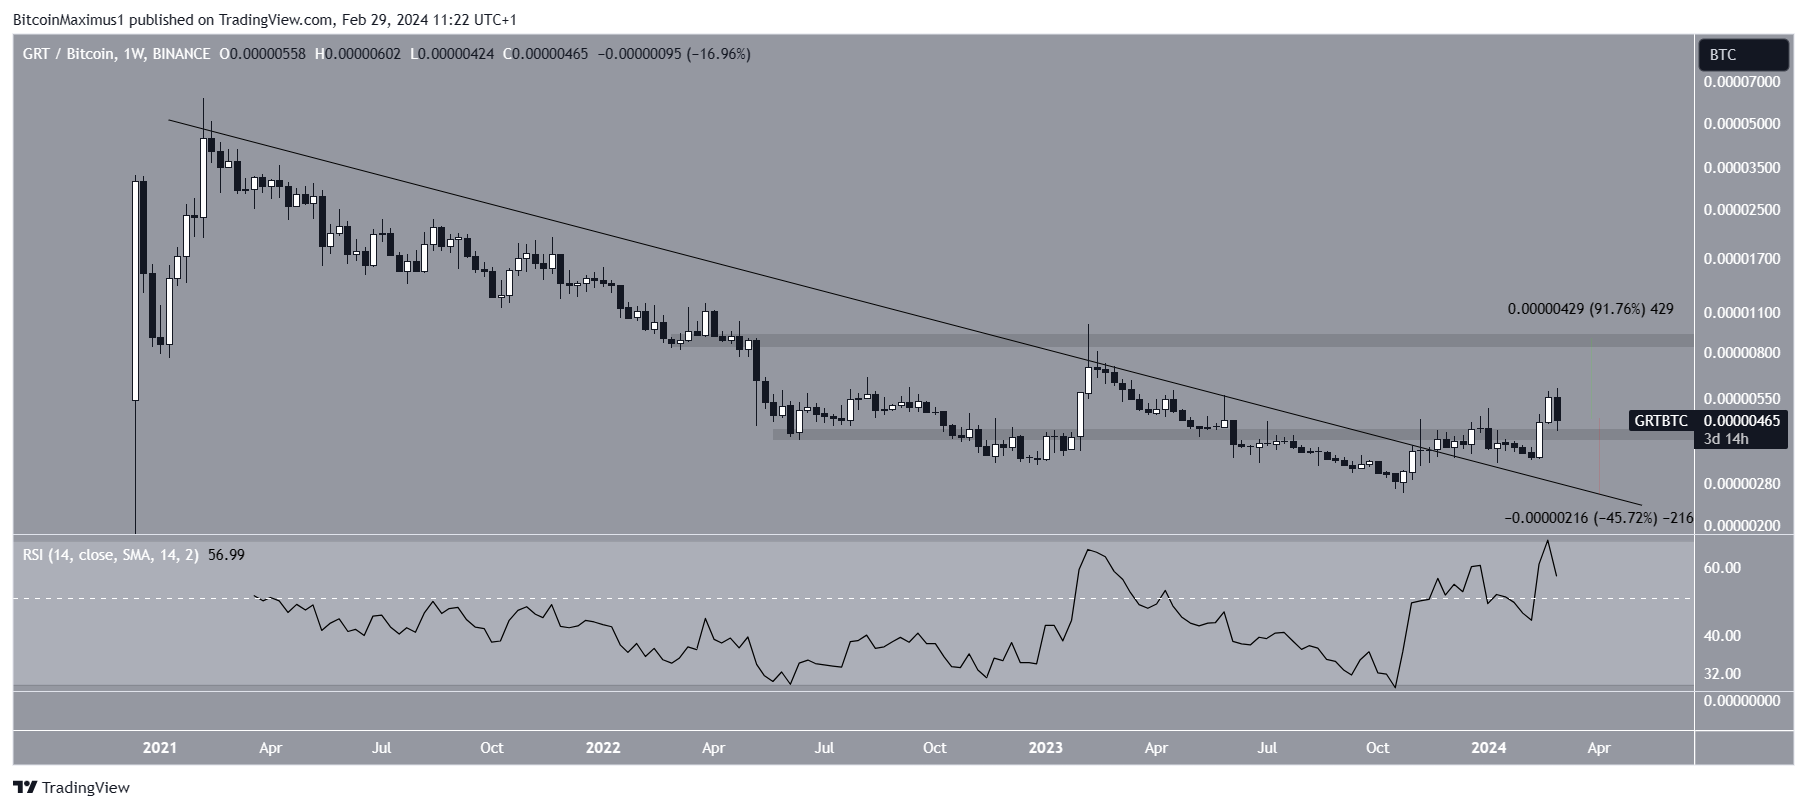
तेजी से जीआरटी मूल्य भविष्यवाणी के बावजूद, 450 सातोशी समर्थन क्षेत्र के नीचे बंद होने से 280 सातोशी पर प्रतिरोध प्रवृत्ति रेखा में 45% की गिरावट हो सकती है।


और मैं मधुमक्खी के बारे में और अधिक जानना चाहूँगा। कॉम
मुझे यहां आपके साथ जुड़कर खुशी हो रही है