Will a 5% U.S. Treasury Yield Be the “Breakdown Signal” for Bitcoin?
Original Compilation: AiddiaoJP, Foresight News
Bitcoin has been one of the strongest-performing assets during the US-Iran war. However, as the bond market shows signs of being “out of control,” Bitcoin’s upward momentum is beginning to show signs of exhaustion.
चाबी छीनना:
- If the US-Iran war prolongs, the yield on the US benchmark Treasury could rise by 200 basis points.
- Historical experience suggests that oil-related conflicts tend to push up inflation and suppress risk appetite. Based on this, Bitcoin’s price could potentially fall below $50,000 in 2026.
Oil Supply Shock Could Push US Treasury Yields Above 5%
Since the US and Israel launched attacks on Iran on February 28, the yield on the benchmark 10-year US Treasury has climbed to around 4.42%, reaching a nine-month high.
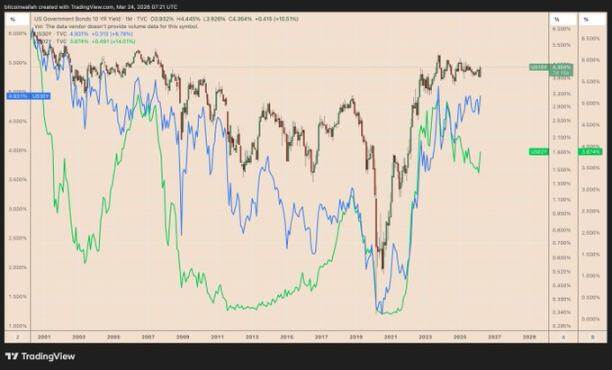
Monthly performance of US 2-year, 10-year, and 30-year Treasury yields. Source: TradingView
Among them, the 30-year Treasury yield rose to about 4.97%, and the 2-year Treasury yield also increased to the range of 3.95% to 3.98%.
Affected by the war, oil prices have surged significantly, exacerbating market concerns about rising inflation, which in turn has pushed Treasury yields higher. Against this backdrop, the market widely expects no interest rate cuts within 2026.
US President Donald Trump announced a five-day suspension of operations, temporarily alleviating immediate market concerns about attacks on Iranian energy facilities. However, as Iran denies any negotiations and cross-border attacks continued as of this Tuesday, the conflict situation remains effectively uncontrolled.
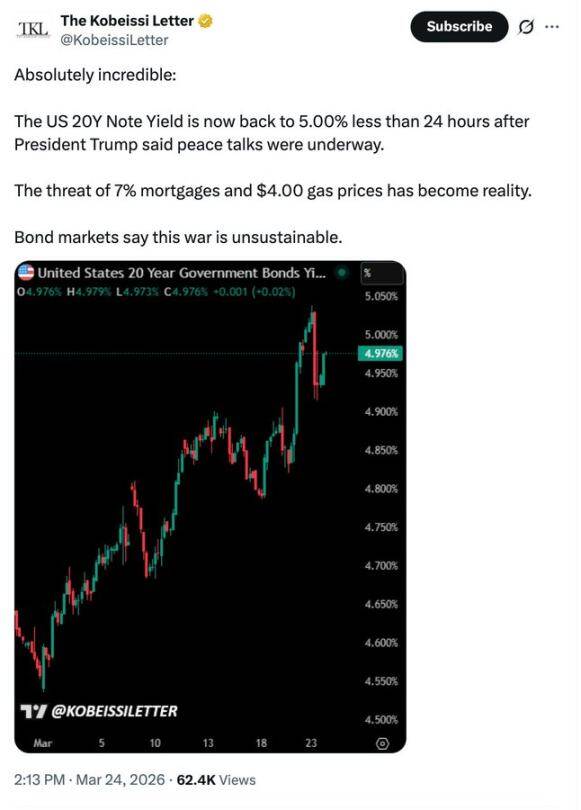
Source: X
बाज़ार observers have expressed concern, noting the risk of further increases in US Treasury yields. Technical analysts further point out that if the 10-year Treasury yield breaks above its current symmetrical triangle pattern, it could rise by 200 basis points to 6.4%.
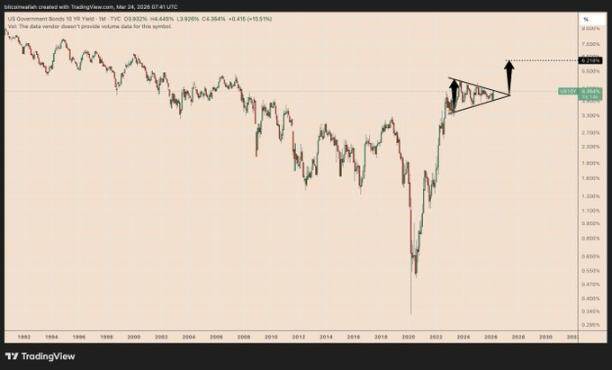
Monthly chart of US 10-year Treasury yield. Source: TradingView
Rising yields increase the opportunity cost of holding risk assets such as stocks and Bitcoin. If Bitcoin continues to exhibit characteristics of a risk asset, a break above 5% for the 10-year Treasury yield could trigger selling pressure in the Bitcoin market.
Historical Cases of Oil-Related Shocks
Historical experience shows that short-term, oil-related conflicts typically cause sharp but brief volatility in Treasury yields and stock markets, while prolonged supply shocks can drive yields persistently higher and exert sustained pressure on equities.
During the 1973 Yom Kippur War and the Arab oil embargo, Treasury yields initially rose slightly, then climbed significantly as inflation intensified. The S&P 500 index fell by approximately 41% to 48% during the “stagflation” phase.
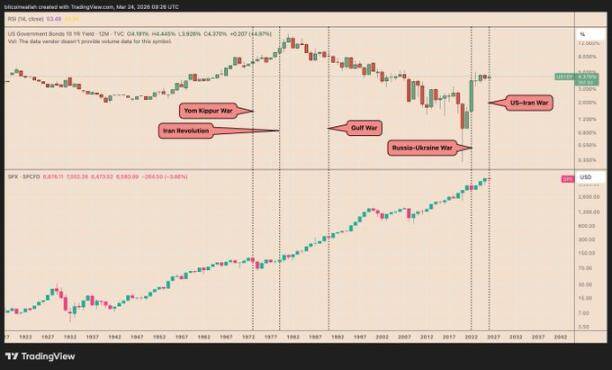
Annual chart of US 10-year Treasury yield and S&P 500 index. Source: TradingView
During the 1979 Iranian Revolution, the bond market reacted more strongly, with the 10-year Treasury yield rising by about 150 to 200 basis points over the following year, while the stock market correction was relatively moderate.
During the 1990-1991 Gulf War, the 10-year Treasury yield rose by about 50 to 70 basis points, and the S&P 500 index fell by about 16% to 20%, before rebounding after the conflict was brought under control.
Following the outbreak of the Russia-Ukraine conflict in 2022, there was also a scenario of rising Treasury yields and a 5% to 10% short-term decline in the S&P 500 index.
The current conflict between the US, Israel, and Iran appears to be in the early stages of the historical pattern described above. If the conflict escalates further and oil prices remain high, Treasury yields could rise further, and risk assets may face a new round of downward pressure.
Bitcoin still maintains a high correlation with the S&P 500 index. Therefore, unless the conflict situation eases rapidly, Bitcoin’s price is likely to face greater downward pressure.
To What Level Could Bitcoin’s Price Fall?
From a technical analysis perspective, if Bitcoin’s price breaks below its current bearish flag pattern, it could potentially fall further to $50,000 or even lower in the coming months.
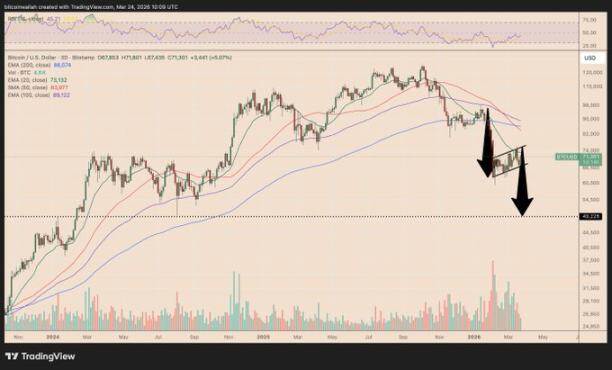
Bitcoin/USD three-day price chart. Source: TradingView
The above technical expectations are largely consistent with trading data from prediction markets. Currently, traders estimate a 70% probability that Bitcoin will fall below $55,000 in 2026, and a 46% probability it will fall below $45,000.
Arthur Hayes, co-founder of BitMEX, stated that if the US-Iran war drags on, it could force the Federal Reserve to adopt accommodative monetary policies, which would be a positive factor for Bitcoin.
He noted, “The longer the conflict lasts, the more likely the Fed is to print money to support the US war machine.” He further added:
“When central banks start printing money, I will choose to buy Bitcoin.”
यह लेख इंटरनेट से लिया गया है: Will a 5% U.S. Treasury Yield Be the “Breakdown Signal” for Bitcoin?
Related: SIREN, A Meticulously Designed Leverage Harvest
However, during the recent surge in online discussions about its “price explosion,” this token’s total liquidation volume across all platforms ranked 4th, only behind Bitcoin, ETH, and XAU, reaching approximately $23.25 million. If not for Trump’s TACO move boosting gold’s volatility, SIREN would have been 3rd. The token’s price once approached $5, corresponding to a market cap of about $3.675 billion, briefly squeezing into the top 30 of the total cryptocurrency market cap ranking, surpassing established tokens like OKB and UNI. In a sluggish market, this is not the first time we’ve seen such a phenomenon. $PIPPIN, $RIVER, $BEAT, $MYX… By examining the questions surrounding $SIREN, what lessons can we draw from these similar situations? Are “Leverage Scams” Predictable? As early as March 5th, @c_ckoko posted a tweet pointing out,…


