








It would be easy to slot this into the “geopolitical risk persists” framework. But another thread in the Reuters report moves faster: after oil prices fell, the dollar and Treasury yields weakened in tandem, and the market began to reprice how much higher the Fed might need to push rates. Gold’s rise happened the moment the opportunity cost of holding it was repriced.
What Moved First Was Rate-Hike Pricing
There is no direct supply-demand conveyor belt between oil and gold. Oil influences the market’s inflation narrative. With energy prices no longer squeezing higher, the case for further rate hikes becomes less urgent.
According to a Reuters report on August 6, market expectations for a further rate hike in September fell from 67% to 55% within two days. The same report noted that Treasury yields declined and the dollar index came under pressure. That explains why a piece of news that seemingly lowered geopolitical risk could instead give gold a short-term boost.
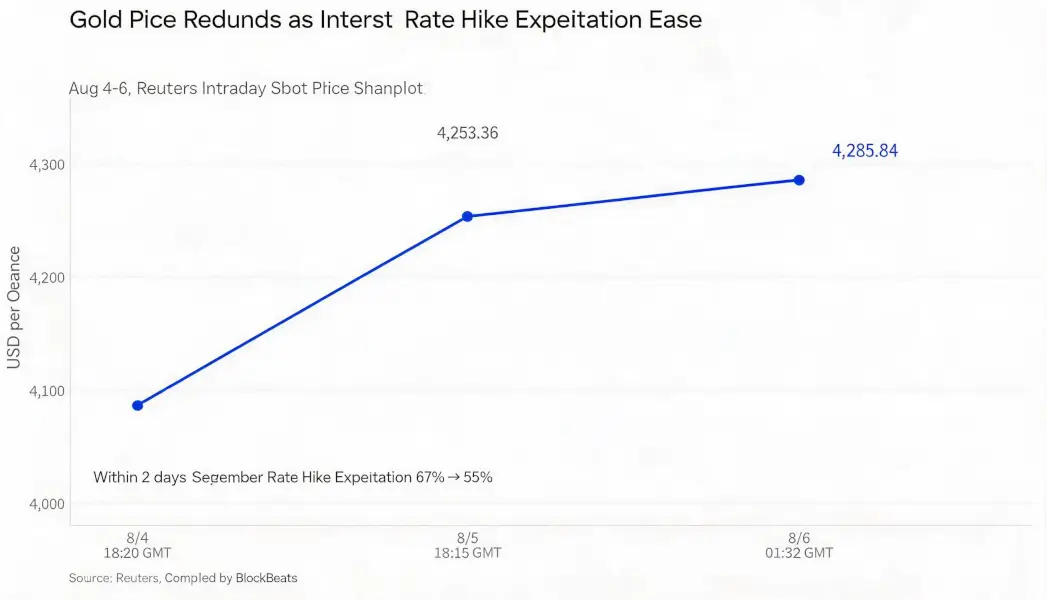
Chart data sourced from intraday quotes on August 4, August 5, and August 6, as reported by Reuters.
The three quotes in the chart are not daily closes, let alone settlement prices. They are more like snapshots the market took at different times. As prices rose, rate-hike pricing retreated—the two are merely two sides of the same macroeconomic repricing.
Data from the St. Louis Fed’s FRED database shows the 10-year Treasury Inflation-Protected Securities yield fell from 2.47% to 2.40%. For gold, this is not an abstract macroeconomic term. It means the risk-free return available on cash not held in gold has edged down. With the hurdle rate for a yield-free asset lowered and a weaker dollar reducing costs for overseas buyers, short-term buying found its footing.
A Repricing, Not a Tonnage Surge
When prices rise quickly, it is easy to assume the world is scrambling for gold. The World Gold Council’s Q2 table paints a quieter picture: the LBMA Gold Price PM averaged 37% higher year-on-year, yet total gold demand, including OTC, was roughly flat at 1,269 tonnes. The World Gold Council places both facts on the same summary table.
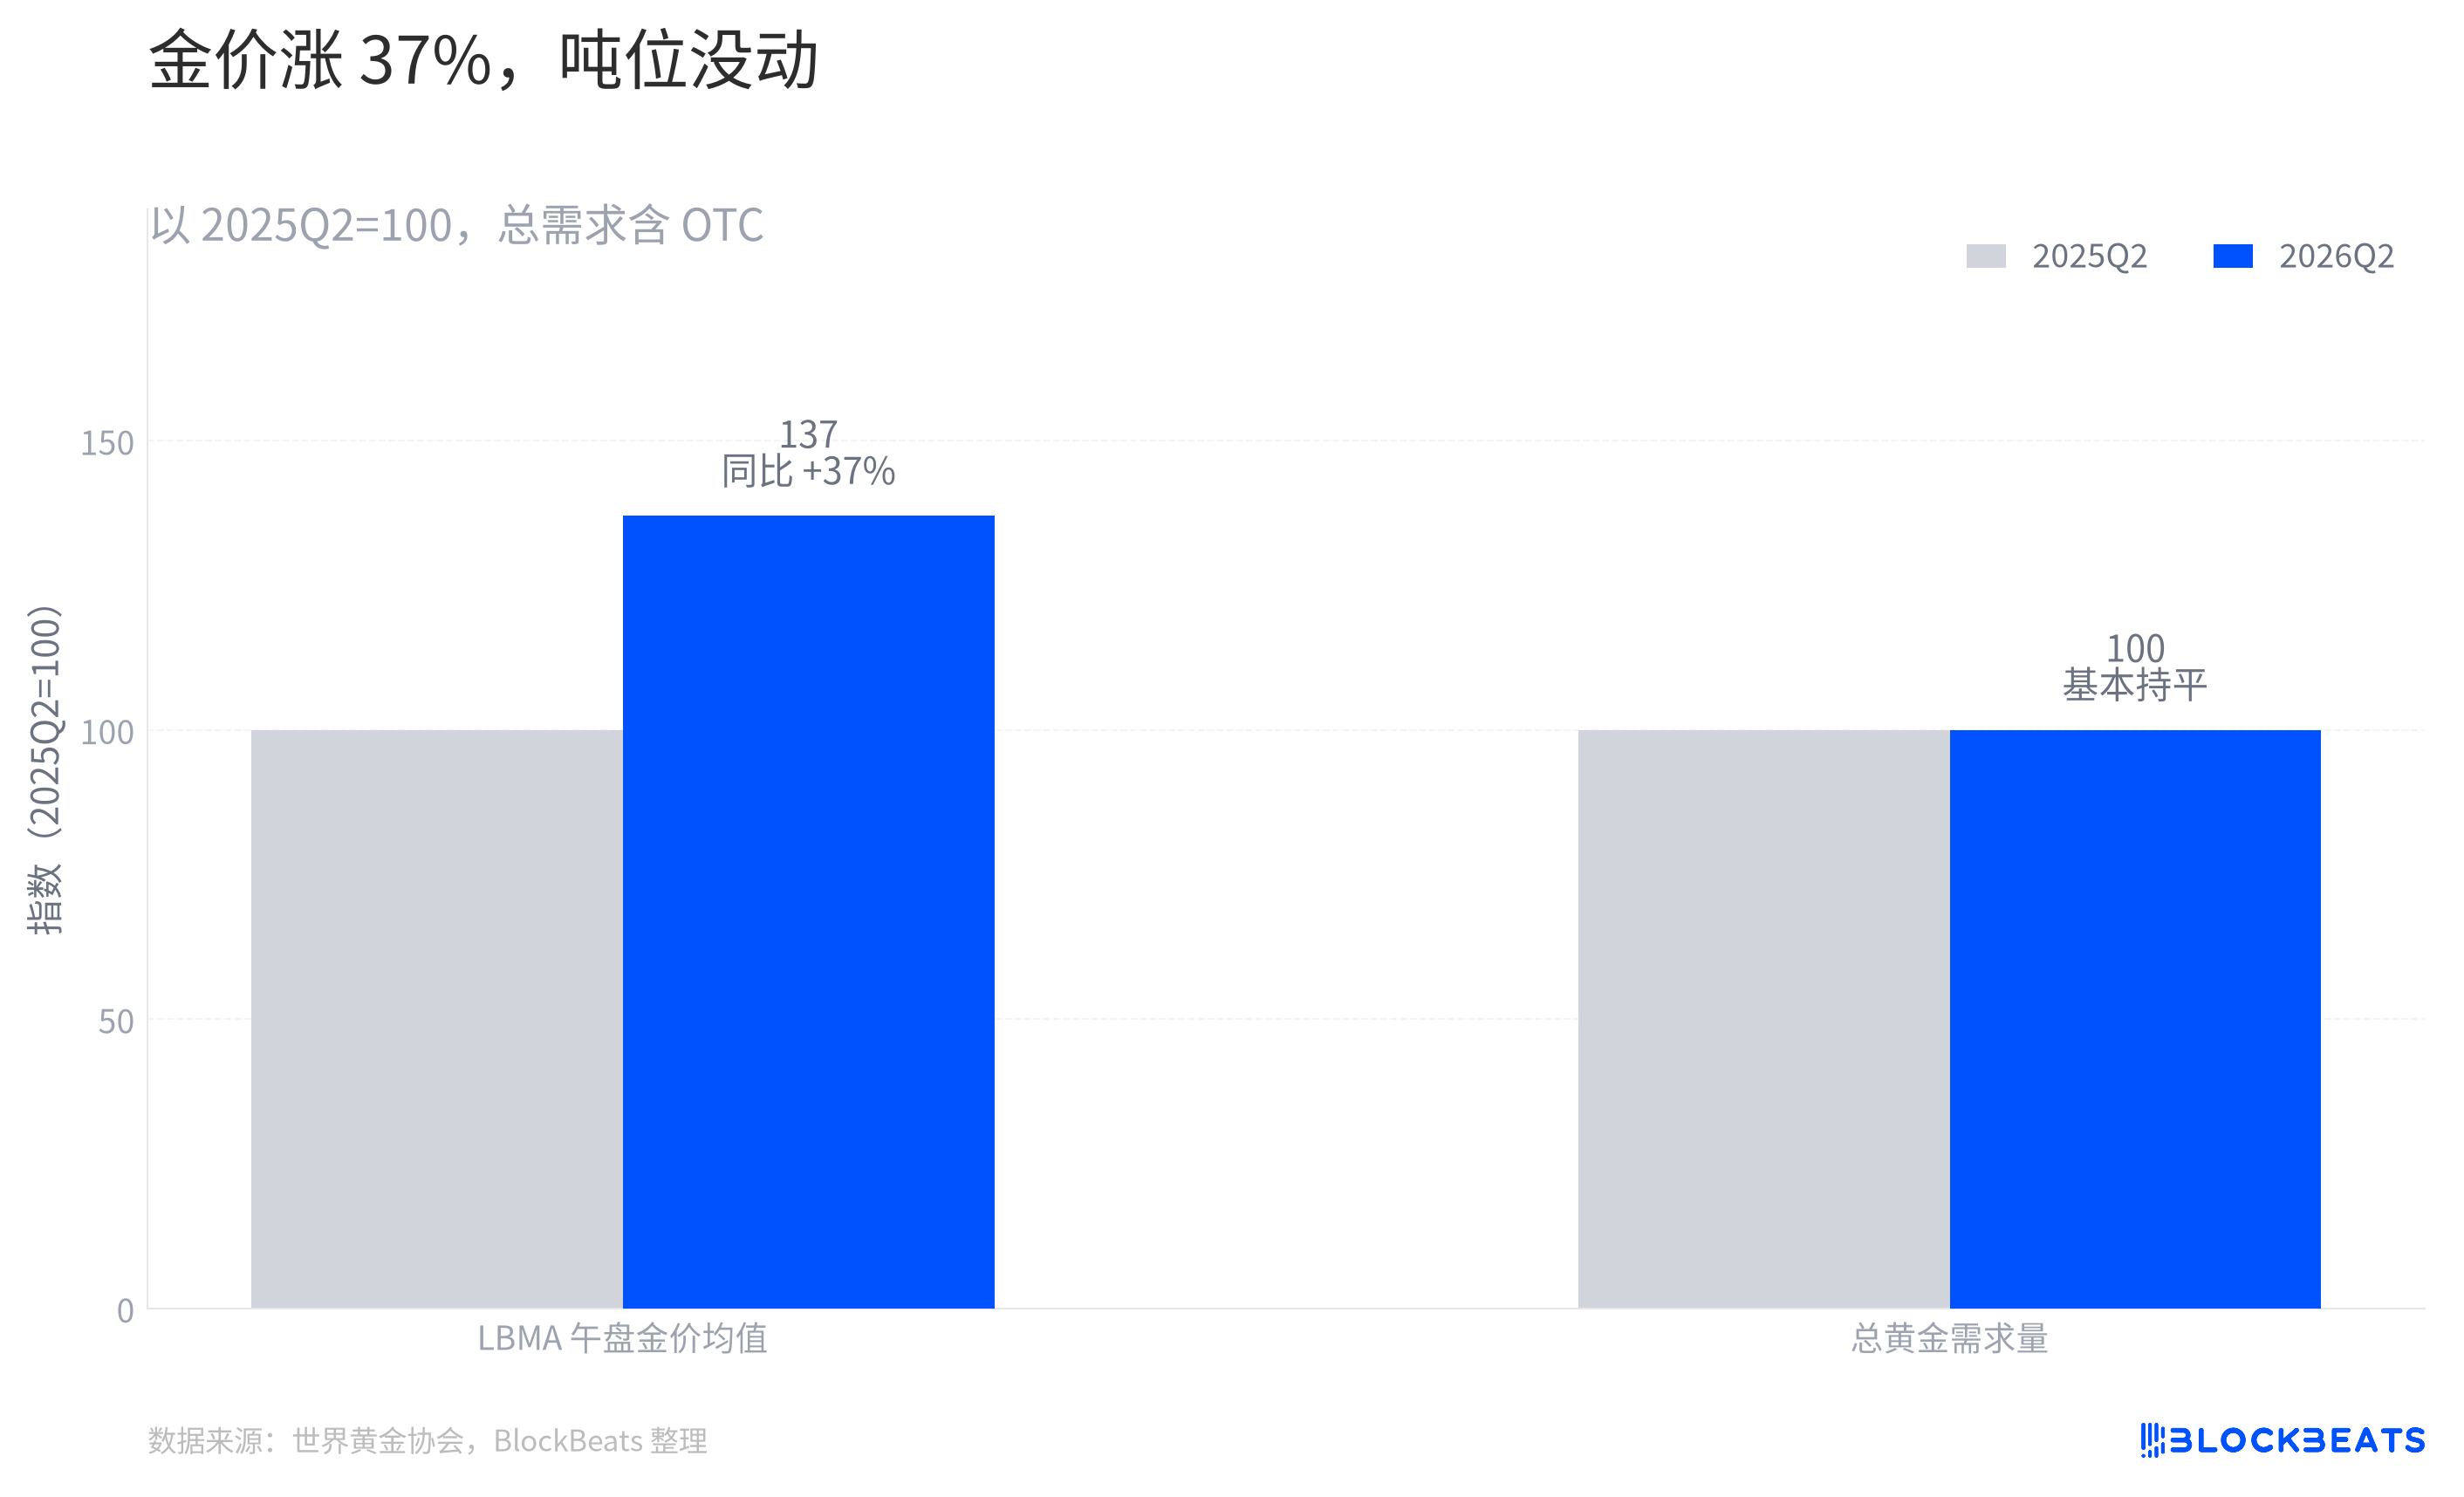
The point of this chart is not that “demand didn’t grow,” but that the composition of demand has changed. Total demand includes OTC transactions and other balancing items—it is not simply a tally of gold bars carried away by retail consumers. The nearly flat tonnage in the chart shows that what happened first was a repricing, not a sudden increase in purchases by every category of buyer.
The World Gold Council’s H1 data also shows demand value hit a record $380 billion, while demand volume rose only 2% year-on-year. This pair of figures indicates that the expansion in demand value did not translate into proportional tonnage growth. What prices reflect is a shift in the weighting of different demand components, not a synchronized increase in purchases across every buyer type.
ETFs Are Not Gold’s Full Ledger
The most visible selling came from gold ETFs. In Q2, ETFs and similar products swung to net outflows. At the same time, the World Gold Council recorded a rebound in net official-sector purchases by central banks and other institutions, while OTC and other items also expanded. Only by placing these items side by side can one see that the gold market does not breathe solely through a single public holdings curve.
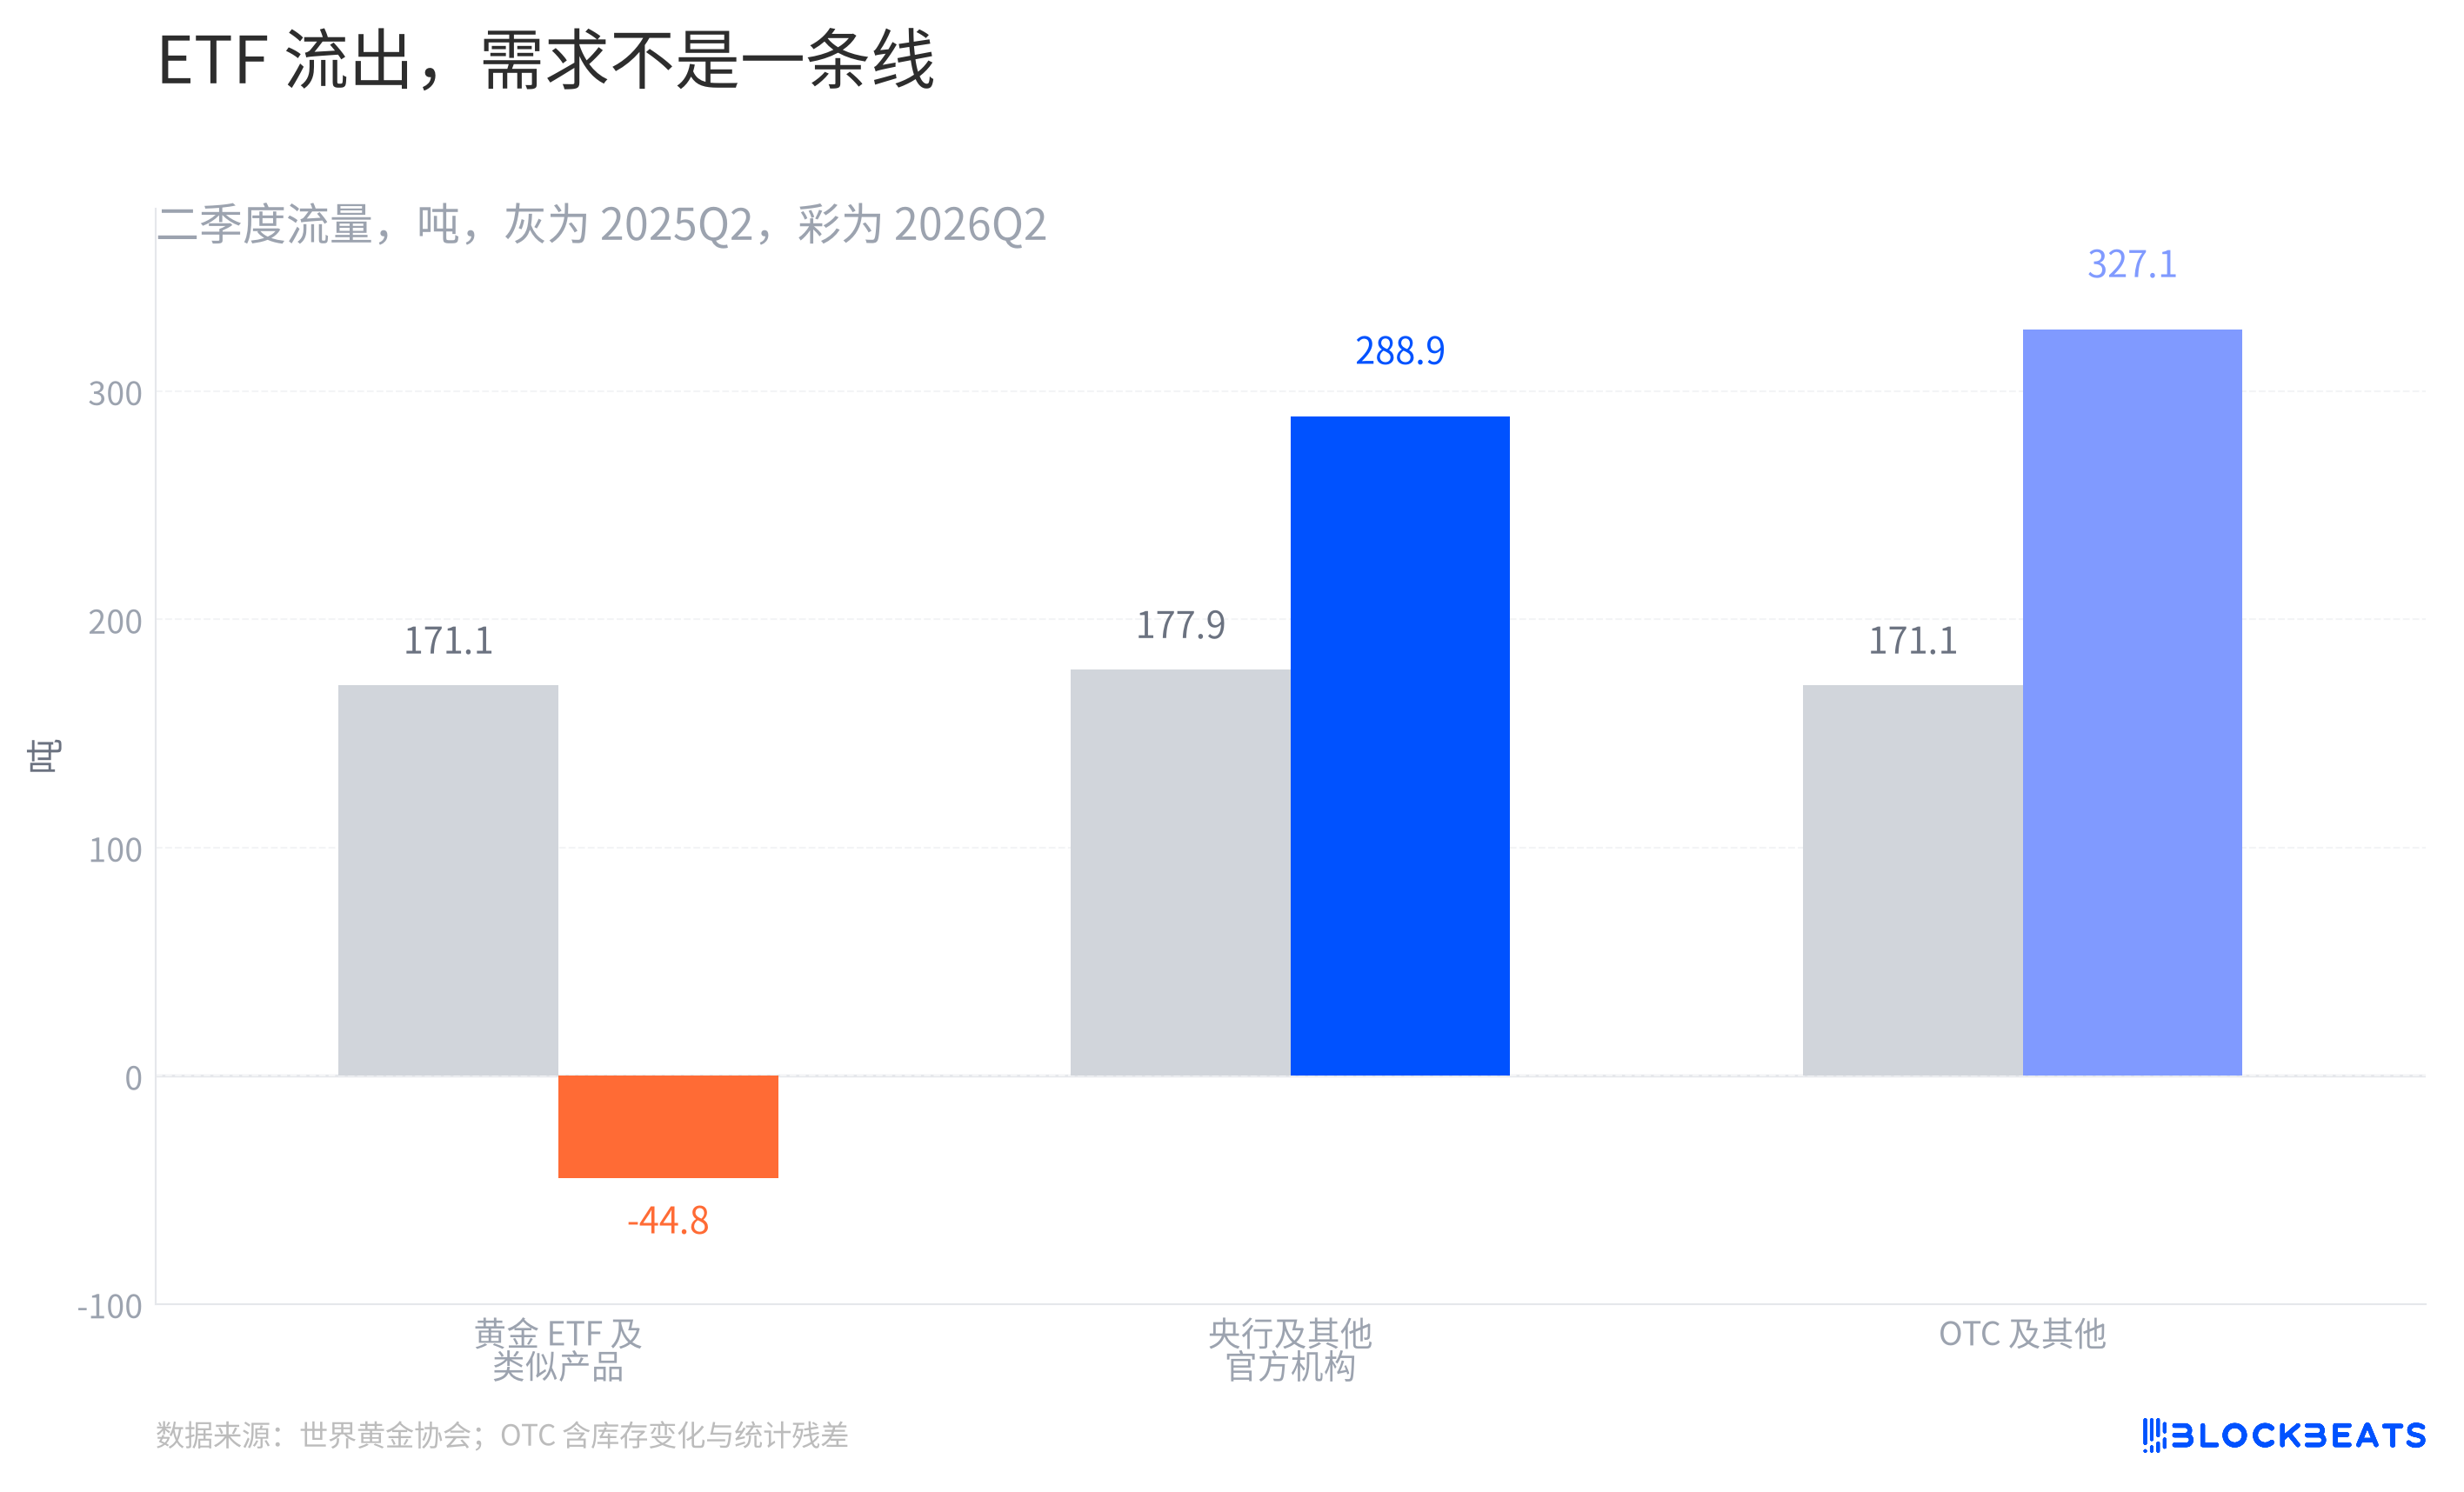
But this chart should not be read as a delivery slip showing “who took over the ETF selling.” The World Gold Council clearly states in its methodology that OTC and other items also include exchange inventory changes, unobserved fabrication inventory changes, and statistical residuals. It can show that public ETF outflows do not mean the entire market lacked absorption; it cannot be traced down to a specific country or type of capital.
Central bank data should likewise not be stretched into a permanently upward-sloping line. The World Gold Council has already revised down its official-sector purchase estimate for Q1, citing lags in reporting and statistics. Treating ETFs as the only thermometer and central banks as the only buyer flattens a multi-layered market into a single story.
The oil price retreat brought a decline in short-term opportunity cost. The decoupling of price from tonnage, and the divergence between public and non-public flows, suggest that when gold rises, what is truly changing is often the structure of its holders.
本文源自網路: Gold breaks through the $4,300 mark—has the uptrend resumed?
Compiled by Odaily Planet Daily, Qin Xiaofeng (@QinXiaofeng 888 ) Editor’s Note:On July 1, the Ethereum Foundation’s Global Policy Strategy team released a policy guide for governments and institutions, positioning Ethereum as critical public infrastructure. The report states that Ethereum has operated uninterrupted since its launch in 2015, secured by approximately $76 billion in staked ETH as of March 2026, with a geographically diverse validator network, multiple independent client implementations, and a vast developer ecosystem. The Foundation notes that many current digital services rely on centralized intermediaries, which pose risks such as single points of failure, cyberattacks, or political pressure. Ethereum’s decentralized architecture is more suitable for applications like digital identity, public records, and asset tokenization. The report cites existing use cases, including decentralized identity initiatives in Bhutan and Buenos Aires, and…































 繁體中文
繁體中文  English
  简体中文
简体中文